 Multi-family
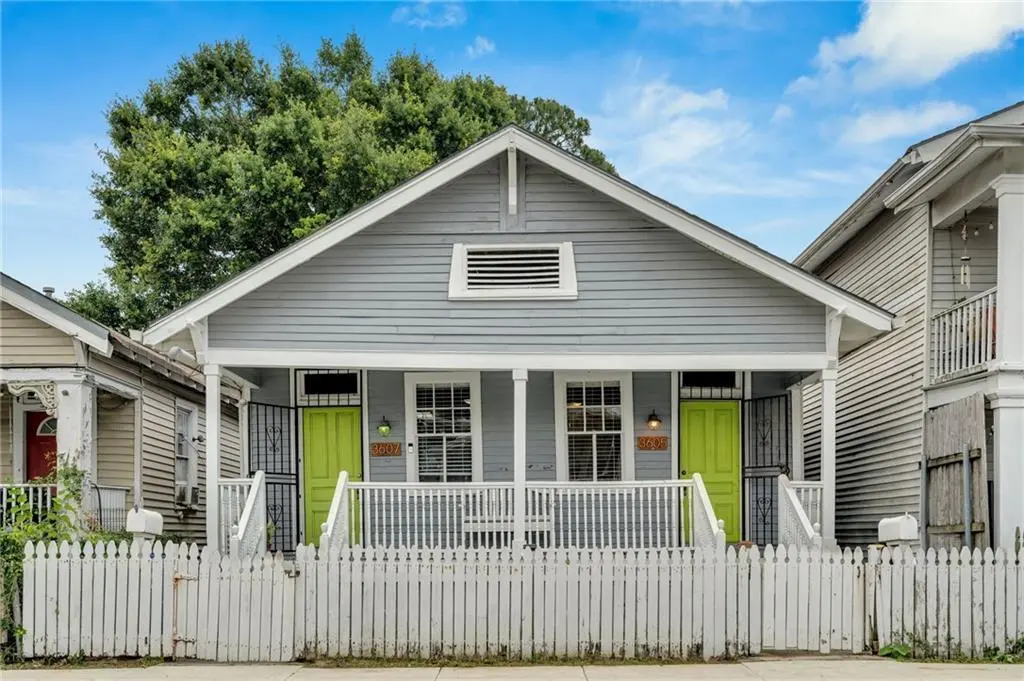
3605 07 Calhoun St · New Orleans, LA
Flood risk 8/10 · Major
- FEMA flood zone
- X (shaded)
- Chance of flooding over 30 yrs
- 0.6%
- Est. flood insurance / yr
- $507 – $1,088
Fire risk 1/10 · Minimal
- Est. fire insurance / yr
- $1,269 – $2,357
Heat risk 10/10 · Severe
- Hot days now (above 108°F)
- 7 days/yr
- Hot days in 30 yrs
- 21 days/yr
Wind risk 10/10 · Severe
- Chance of severe wind over 30 yrs
- 99.0%
Air-quality risk 4/10 · Minor
- Unhealthy air days now
- 4 days/yr
- Unhealthy air days in 30 yrs
- 4 days/yr
Risk factors via First Street. Map © Google.
Why this score? — see what drove the C grade
The composite is a weighted blend of 9 inputs, each scored 0–100. Each bar is that input's sub-score; the figure is the points it added to the 100-point composite (weight × sub-score).
- Cash flow +20.9/30.0
- ARV discount +15.0/15.0
- DSCR +6.7/10.0
- 1% rule +5.5/10.0
- Livability +4.0/5.0
- Rent growth +2.7/5.0
- Condition / age +2.5/5.0
- Schools +1.6/10.0
- Appreciation +0.0/10.0
$325,000
🖨 Deal sheet 📄 Offer letter ✓ Due diligence
Multi-family units
County records classify this as Multi-Family (2-4 Unit). Listing-text estimate: 1 unit. estimate disagrees with records
Listing remarks
Classic Uptown Charm & Proven Performance on Calhoun Street! Nestled in a highly coveted Uptown location just steps from Tulane University, this classic New Orleans double offers a rare blend of historic character and critical structural upgrades. Boasting 4 bedrooms, 2 baths, and 2,200 sq. ft. of living space on a 30'x116' lot, and X-Flood Zone, this property is an exceptional find for investors or owner-occupants seeking a premier neighborhood. The building features a rare shotgun with hallway layout that preserves historic architectural flow while maximizing privacy. Inside, both units welcome you with airy, open-concept living and kitchen areas. The primary bedrooms are quietly si
Key facts
- Structural upgrades
- Shotgun layout
- Historic character
Tags
Property features AI
Finance
- Other: Virtual tour available
- Financial info: Two-unit property where tenants pay electricity, gas, and water
Exterior
- Utilities: Public water; Public sewer
- Home design: Single-story; Raised foundation
- Construction: Aluminum siding; HardiPlank type; Shingle roof
- Exterior features: City lot with rectangular shape (30 x 116 x 29 x 114); Porch; Fence
Interior
- Bathrooms: 2 full bathrooms
- Heating & cooling: Central heating; Dual system heating; Central air conditioning
- Interior features: Porch; Fence; Average condition
Neighborhood map
What this means for you Summary
Snapshot
- This is a 4-bed/2.0-bath multifamily listed at $325k.
Deal economics
- At list price, monthly cash flow is $388 ($5k/yr) — positive.
- The deal already cash-flows at list — no discount required.
- Meets the 1% rule at list price ($3k rent vs $325k).
- Recommended offer: $315k (3.0% below list) — sets the bar for market timing.
- Cap rate 8.0% vs local median 4.4% in New Orleans — top-decile yield for the area; either an underpriced asset or a hidden risk that comps aren't pricing in. Stress-test before assuming the spread holds.
Location & tenants
- Location reads 81/100 on livability (#3 in LA, #1,383 nationally) — a professional / high-income tenant draw. Strengths: amenities A+, commute A+, health & safety A+; Watch: crime C-, employment D.
- Orleans Parish (urban): math 11% / reading 27% proficiency, ranked #69 of 98 in LA (top 70%) — low school quality limits family demand, transient renter base, plan for 1-2y turnover; 68% free/reduced lunch — lower-income household profile, screen leases tightly.
- Market conditions: Rents flat; 217 active listings in the ZIP; 40 comparable units currently listed for rent nearby; rentals at typical pace (median 21d on market — plan ~3-4 weeks tenant-placement turnaround); 710 units permitted in Orleans Parish in 2024 (244 in 5+ unit buildings).
- At $3,425/mo this rent would consume 67% of the median local household income ($61k/yr) (locally 1270% of renters already pay >50% of income on rent) — very limited rent-growth headroom before tenants either downsize or default.
Forward outlook
- Local home prices are declining (-3.0%/yr); year-one equity from $2k of loan paydown is wiped out by about $10k of value loss. Plan a longer hold.
- Orleans County population projected at +61% by 2050 — long-run rental-demand tailwind backs the buy-and-hold thesis.
Negotiation context
- It's been on market 38 days — a 3% lower offer ($315k) is reasonable based on typical stale-listing flexibility.
- Current owner paid $175k; list at $325k implies a 86% gain — meaningful room to come down on a strong offer.
Risks & watch-outs
- Watch-outs: flood insurance adds $66/mo; built in 1953 — expect roof / HVAC / electrical / plumbing capex.
- Climate carrying-cost: severe flood risk; severe wind risk, 99% chance of damaging wind over 30y; extreme-heat days projected 7→21/yr by 2055 (HVAC capex compounding) — expect insurance premiums to compound above CPI over the hold.
Questions for the listing agent
- It's been on market 38 days. Have you received any prior offers? Is the seller open to a 3% concession, seller financing, or rate buy-down credit?
- Built in 1953 — when were the roof, HVAC, electrical panel, plumbing, and water heater last replaced?
- What's the actual annual flood-insurance premium (NFIP or private), and is the property in a SFHA with mandatory coverage?
- Is there a deadline driving the sale (1031 exchange, divorce, estate, relocation)? That informs how much negotiation room exists.
- What's the average days-on-market for RENTAL listings here right now (not sales)? A rising rental-DOM trend means longer vacancies and softer asking-rent achievability than the comps imply.
- What's the recent tenant-quality profile in this submarket — average credit score on applications, eviction rate, late-payment / NSF rate, and stable-employment percentage? A property-management company in the area should have these aggregated.
- How much new apartment / multifamily construction is in the pipeline within 1–3 miles? Heavy new supply (>2% of stock underway) typically softens rents 12–24 months out; light construction supports rent growth.
Investment metrics
- 1% rule
- 1.05% ✓
- Cap rate
- 7.97%
- Cash-on-cash
- 5.99%
- DSCR
- 1.27
- GRM
- 7.9
CMA / ARV
- ARV (median comp)
- $393,738
- List price
- $325,000
- Delta
- -17.46%
- Verdict
- UNDERPRICED
- Comps
- 20 within 1.0 mi
Show comp detail 12 sales within ~0.75 mi
| Address | Dist | Beds/Ba | Sqft | Sold | Price | $/sf | Match |
|---|---|---|---|---|---|---|---|
| 3235 37 Vincennes Pl | 0.08mi | 4/2.0 | 2,072 (+2%) | 1mo | $150,000 | $72 | 91 |
| 6208 S Rocheblave St | 0.22mi | 4/4.0 | 2,000 (-1%) | 0mo | $402,500 | $201 | 80 |
| 6204 S Rocheblave St | 0.22mi | 4/4.0 | 2,000 (-1%) | 0mo | $402,500 | $201 | 79 |
| 2232-34 S Salcedo St | 0.31mi | 4/2.0 | 2,108 (+4%) | 1mo | $391,237 | $186 | 78 |
| 4325 27 Jena St | 0.25mi | 4/2.0 | 2,149 (+6%) | 3mo | $307,500 | $143 | 76 |
| 2625 27 Calhoun St | 0.67mi | 4/2.0 | 1,996 (-1%) | 1mo | $372,500 | $187 | 66 |
| 2900-02 Calhoun St | 0.52mi | 4/2.0 | 2,022 (0%) | 13mo | $482,000 | $238 | 65 |
| 7700 02 Spruce St | 0.58mi | 4/2.0 | 1,900 (-6%) | 11mo | $260,000 | $137 | 54 |
| 1729 31 Burdette St | 0.72mi | 4/2.0 | 2,217 (+10%) | 2mo | $310,000 | $140 | 49 |
| 8009 13 Nelson St | 0.60mi | 4/2.0 | 2,274 (+12%) | 3mo | $410,000 | $180 | 49 |
| 3619-25 Delachaise St | 0.70mi | 4/4.0 | 2,162 (+7%) | 7mo | $315,000 | $146 | 42 |
| 1505 07 S White St | 0.65mi | 5/2.0 (+1) | 2,268 (+12%) | 3mo | $144,900 | $64 | 42 |
Match score weights: distance 35% · size 25% · config 20% · recency 20%. Top-matched comps best support the ARV.
Projected returns pro-forma
-3.0% appreciation · 0.73% rent growth · sell at horizon
- IRR
- -11.0%
- Equity multiple
- 0.61×
- Total profit
- $-35,536
- Equity at exit
- $48,459
- IRR
- -5.4%
- Equity multiple
- 0.68×
- Total profit
- $-28,764
- Equity at exit
- $28,100
Cash invested: $91,000 (down + closing). Projections, not guarantees.
Landlord ↔ Tenant lean methodology
- Overall (STATE)
- 90 Strongly Landlord-Friendly
- State Louisiana
- 90 Strongly Landlord-Friendly · R+12
- County
- — inherits STATE
- City
- — inherits STATE
ZIP-level market 70125
- Home prices YoY
- -16.3%
- Rents YoY
- 0.7%
- Active inventory
- 217
- Price-to-rent
- 15.8×
Monthly cashflow live
- Estimated rent
- $3,425 high interval (Pro) →
- Mortgage (P&I)
- −$1,704
- Tax from tax record
- −$412 /mo · $4,944/yr
- Insurance
- −$135
- Flood insurance flood zone
- −$66 /mo · $798/yr
- HOA
- −$0
- Vacancy / Maint / Mgmt
- −$719
- Net cashflow
- $388
Break-even live
2-unit breakdown (identical units grouped — click to expand)
| Units | Beds | Baths | Est. rent |
|---|---|---|---|
| 2× units | 2 | 1 | $3,424 |
| #1 | 2 | 1 | $1,712 |
| #2 | 2 | 1 | $1,712 |
| Total (2 units) | $3,425 | ||
UW: 25.0% down · 7.5% · 30yr · 1.5% tax · 5.0% vac · 8.0% maint · 8.0% mgmt
Financing live
Cash to close
- Down payment
- $81,250
- Closing costs
- $9,750
- Reserves months
- —
- Total cash needed
- —
Loan-product check · same deal, 3 products live
Conventional
25% down · 7.5% · 30yr
- Down + closing
- —
- Monthly P&I
- —
- Monthly cashflow
- —
- DSCR
- —
- Eligible?
- —
Personal DTI + credit; lowest rate.
DSCR
20% down · 8.5% · 30yr
- Down + closing
- —
- Monthly P&I
- —
- Monthly cashflow
- —
- DSCR
- —
- Eligible?
- —
No personal income docs; deal must DSCR.
Hard money
10% down · 12.0% · 12mo
- Down + closing
- —
- Monthly P&I
- —
- Monthly cashflow
- —
- DSCR
- —
- Eligible?
- —
Short-term bridge; refi at stabilization.
Rent comps 40 comps
| Address | Beds | Baths | Sqft | Rent | $/sqft | DOM | Units | Dist |
|---|---|---|---|---|---|---|---|---|
| 3737 Nashville Ave New Orleans, LA | 4.0 | 2.0 | 2000 | $3,400 | $1.70 | 21d | 1 | 0.14mi |
| 4117 State Street Dr New Orleans, LA | 3.0 | 1.0 | 1678 | $1,550 | $0.92 | 11d | 1 | 0.19mi |
| 2338 Audubon St New Orleans, LA | 3.0 | 2.0 | 1935 | $2,000 | $1.03 | 3d | 1 | 0.22mi |
| 2117 S Lopez St New Orleans, LA | 5.0 | 2.0 | 1920 | $2,000 | $1.04 | 23d | 1 | 0.23mi |
| 2308 Audubon St New Orleans, LA | 4.0 | 1.5 | 1480 | $3,050 | $2.06 | 15d | 1 | 0.25mi |
| 3180 State Street Dr New Orleans, LA | 3.0 | 2.0 | 1600 | $1,900 | $1.19 | 10d | 1 | 0.29mi |
| 5533 S Tonti St New Orleans, LA | 4.0 | 4.0 | 3000 | $3,000 | $1.00 | 14d | 1 | 0.31mi |
| 2203 Broadway St New Orleans, LA | 3.0 | 2.0 | 1491 | $3,000 | $2.01 | 21d | 1 | 0.32mi |
| 2201 Broadway St Unit 2 New Orleans, LA | 4.0 | 2.0 | 2000 | $3,000 | $1.50 | 43d | 1 | 0.33mi |
| 3636 Upperline St New Orleans, LA | 3.0 | 1.0 | 1600 | $1,975 | $1.23 | 23d | 1 | 0.36mi |
| 4400 Elba St New Orleans, LA | 3.0 | 2.0 | 1600 | $1,875 | $1.17 | 23d | 1 | 0.36mi |
| 4403 Elba St New Orleans, LA | 3.0 | 2.0 | 1400 | $1,800 | $1.29 | 3d | 1 | 0.38mi |
| 4401 Elba St New Orleans, LA | 3.0 | 2.0 | 1400 | $1,850 | $1.32 | 23d | 1 | 0.39mi |
| 7325 Sycamore St New Orleans, LA | 4.0 | 3.0 | 2500 | $2,350 | $0.94 | 23d | 1 | 0.41mi |
| 2010 Broadway St New Orleans, LA | 4.0 | 2.0 | 1600 | $2,400 | $1.50 | 23d | 1 | 0.44mi |
| 4603 S Miro St New Orleans, LA | 3.0 | 2.0 | 1650 | $1,650 | $1.00 | 23d | 1 | 0.45mi |
| 6326 S Johnson St Unit 1 New Orleans, LA | 5.0 | 2.0 | 2013 | $3,950 | $1.96 | 43d | 1 | 0.47mi |
| 2014 Lowerline St New Orleans, LA | 3.0 | 1.5 | 1600 | $2,850 | $1.78 | 14d | 1 | 0.51mi |
| 2201 Burdette St New Orleans, LA | 3.0 | 1.5 | 1800 | $2,695 | $1.50 | 16d | 1 | 0.51mi |
| 5417 S Johnson St New Orleans, LA | 3.0 | 3.0 | 1739 | $2,900 | $1.67 | 16d | 1 | 0.52mi |
| 2838 Palmer Ave New Orleans, LA | 3.0 | 1.5 | 1500 | $2,000 | $1.33 | 16d | 1 | 0.53mi |
| 2834 Palmer Ave New Orleans, LA | 3.0 | 2.0 | 1533 | $2,800 | $1.83 | 16d | 1 | 0.54mi |
| 2832 Palmer Ave Unit Up New Orleans, LA | 4.0 | 2.0 | 1720 | $2,900 | $1.69 | 43d | 1 | 0.55mi |
| 2824 Calhoun St Unit A New Orleans, LA | 3.0 | 2.0 | 1828 | $3,900 | $2.13 | 43d | 1 | 0.55mi |
| 2818 Palmer Ave New Orleans, LA | 5.0 | 2.0 | 1832 | $4,900 | $2.67 | 43d | 1 | 0.56mi |
| 2116 Burdette St New Orleans, LA | 3.0 | 1.0 | 1700 | $1,975 | $1.16 | 3d | 1 | 0.56mi |
| 2814 Palmer Ave New Orleans, LA | 3.0 | 2.0 | 1500 | $2,400 | $1.60 | 16d | 1 | 0.56mi |
| 7933 Belfast St Unit Upper New Orleans, LA | 3.0 | 2.0 | 1500 | $2,400 | $1.60 | 23d | 1 | 0.57mi |
| 2738 Calhoun St New Orleans, LA | 4.0 | 2.0 | 1900 | $4,800 | $2.53 | 3d | 1 | 0.60mi |
| 7909 Sycamore St New Orleans, LA | 3.0 | 2.0 | 2000 | $2,400 | $1.20 | 2d | 1 | 0.60mi |
| 7902 Sycamore St New Orleans, LA | 4.0 | 2.0 | 1991 | $3,200 | $1.61 | 43d | 1 | 0.60mi |
| 1736 Pine St New Orleans, LA | 5.0 | 2.0 | 1494 | $4,500 | $3.01 | 23d | 1 | 0.60mi |
| 7616 Cohn St Unit A New Orleans, LA | 3.0 | 2.5 | 1492 | $3,300 | $2.21 | 16d | 1 | 0.61mi |
| 3350 Jena St New Orleans, LA | 3.0 | 2.5 | 2200 | $2,500 | $1.14 | 43d | 1 | 0.61mi |
| 2308 Short St New Orleans, LA | 3.0 | 2.0 | 1600 | $2,800 | $1.75 | 3d | 1 | 0.62mi |
| 1700 Broadway St New Orleans, LA | 4.0 | 2.0 | 1500 | $3,600 | $2.40 | 16d | 1 | 0.62mi |
| 4442 S Johnson St Unit 4442 New Orleans, LA | 4.0 | 4.5 | 3000 | $4,500 | $1.50 | 11d | 1 | 0.62mi |
| 2715 Palmer Ave New Orleans, LA | 5.0 | 2.0 | 2184 | $4,900 | $2.24 | 43d | 1 | 0.63mi |
| 2703 Palmer Ave New Orleans, LA | 5.0 | 2.0 | 2349 | $5,500 | $2.34 | 43d | 1 | 0.63mi |
| 7922 Colapissa St New Orleans, LA | 4.0 | 2.0 | 1848 | $2,400 | $1.30 | 10d | 1 | 0.64mi |
Listing history 17 events
-
2026-06-18days on market $325,000 Active 38 DOM
-
2026-06-17days on market $325,000 Active 37 DOM
-
2026-06-16days on market $325,000 Active 36 DOM
-
2026-06-15days on market $325,000 Active 35 DOM
-
2026-06-13days on market $325,000 Active 33 DOM
-
2026-06-10days on market $325,000 Active 30 DOM
-
2026-06-09days on market $325,000 Active 29 DOM
-
2026-06-08days on market $325,000 Active 28 DOM
-
2026-06-07days on market $325,000 Active 27 DOM
-
2026-06-05days on market $325,000 Active 24 DOM
-
2026-06-03days on market $325,000 Active 23 DOM
-
2026-06-02pricedays on market $325,000 Active 22 DOM
-
2026-06-01days on market $340,000 Active 21 DOM
-
2026-05-31days on market $340,000 Active 20 DOM
-
2026-05-11$340,000 Active 2004-char remark
-
2007-12-10soldstatus $175,000
-
1999-11-15soldstatus $42,000
ⓘ Source: listings_history table (triggers on properties + properties_extension) + one-shot
backfill from property_details.listing_events for pre-trigger history.
Tax reassessment forecast LA · Resets to sale price
- Current annual tax
- $4,944 · $412/mo
- Projected year-2 tax
- $4,944 · $412/mo
- Expected delta
- $0/yr ($0/mo · 0.0%)
ⓘ Screening estimate from a state-policy table — verify with the county assessor before closing.
Climate risk First Street
- Flood 8/10 Severe FEMA zone X (shaded) · 60% chance over 30 yrs
- Wildfire 1/10 Low
- Heat 10/10 Extreme 7 d/yr ≥108°F today · 21 d/yr by 30 yrs out
- Wind 10/10 Extreme 99% chance of damaging wind over 30 yrs
- Air quality 4/10 Moderate 4 unhealthy d/yr today · 4 by 30 yrs out
Nearby sold comps map
Loading sold comps map…
Walkable amenities ~0.75 mi
Loading nearby amenities…
Taxation est. · year 1
- Rental income
- $41,100
- − Mortgage interest
- −$18,205
- − Property taxes
- −$4,944
- − Insurance
- −$2,422
- − Repairs & maintenance
- −$3,288
- − Management
- −$3,288
- − Depreciation
- −$9,455
- Taxable loss
- −$502
- Est. tax savings @ 24.0%
- +$121
- After-tax cash flow
- $4,771/yr
For passive investors: Depreciation is non-cash, so a rental often shows a tax loss while cash-flowing — sheltering income. Rental losses are passive: they offset passive income freely, and up to $25,000/yr can offset ordinary (W-2) income if you actively participate and your MAGI is under $100k (phasing out to $0 by $150k); unused losses carry forward. On sale, claimed depreciation is recaptured at up to 25%, and gains may owe capital-gains tax (a 1031 exchange can defer both). Figures are a year-1 estimate at your 24.0% rate — not tax advice; consult a CPA.
Schools (NCES district)
- District
- Orleans Parish
- NCES district ID
- 2201170
- Math proficiency
- 11% ▼ -52.00%
- Reading proficiency
- 27% ▼ -46.00%
- Median HH income
- $37,011
- Composite
- 15.78/100
- National rank
- #9271
- State rank
- #69 of 98 in LA
Livability — New Orleans
- Score
- 81/100
- State rank
- #3
- US rank
- #1383
Category grades
Schools grade is shown separately in the Schools card above.
Census & demographics
- Census place
- New Orleans, LA
- County
- Orleans Parish · 338,817 people
- City population
- 338,817
- Metro
- New Orleans-Metairie, LA
- Population (ZIP)
- 17,821
- Household income
- $61,174
- Rent vs Own
- Severe rent burden
- 1270.0
Population outlook (Orleans County) Hauer SSP2
- Today (2025)
- 513,025 people
- By 2030
- 575,781 · +12.2%
- By 2040
- 700,174 · +36.5%
- By 2050
- 826,541 · +61.1%
- By 2075
- 1,123,374 · +119.0%
- By 2100
- 1,355,609 · +164.2%
Race, ethnicity, and origin ACS 2023
- Neighborhood character
- Diverse neighborhood (Simpson 0.63)
- Race & ethnicity
- Black 51% White 32% Hispanic / Latino 9% Two or more races 9% Asian 2% Native American 1%
- Hispanic origin (detail)
- Mexican 2%
- Common ancestry
- Lithuanian 8% Romanian 1% Slovak 1%
- Foreign-born
- 7% · Canada, China
- Languages at home
- 90% English-only · Spanish 6% French/Haitian/Cajun 1% Chinese 1%
Political lean MEDSL · Orleans
- 2024 margin
- Solid D (+67.0) · D 82.2% · R 15.2% · Other 2.7%
- 2008→2024 swing
- +6.7pp toward D · 2008: 60.3pp · 2024: 67.0pp
- All cycles
- 2024: D+67.0 2020: D+68.2 2016: D+66.2 2012: D+62.5 2008: D+60.3
Not yet ingested
- Civics
- —
Market trends
- HPI YoY
- ▼ -49.68%
- Current HPI
- 255.5998
- Rent YoY
- ▲ 0.73%
- Metro
- New Orleans-Metairie, LA
- State GDP YoY
- ▲ 3.29%
- F500 in state
- 10
Industry mix (Fortune 500 HQ in LA)
| Industry | F500 HQs | Revenue |
|---|---|---|
| Telecommunications | 2 | $23B |
|
||
| Utilities | 1 | $12B |
|
||
| Wholesale / Distribution | 1 | $5B |
|
||
| Advertising | 1 | $2B |
|
||
Price history
+673.8% since first listed4 events — show timeline
- 2026-06-02 Price Changed $325,000 GSREIN
- 2026-05-11 Listed $340,000 GSREIN
- 2007-12-10 Sold (Public Records) $175,000 Public Records
- 1999-11-15 Sold (Public Records) $42,000 Public Records
Property tax history
+4.3%/yrLatest (2026): $4,944 · +1.1% YoY. Source: county tax records.
Cash-flow waterfall
monthlySold comps — $/sqft
last 12 mo · ≤1 miLoading sold comps…