 Duplex
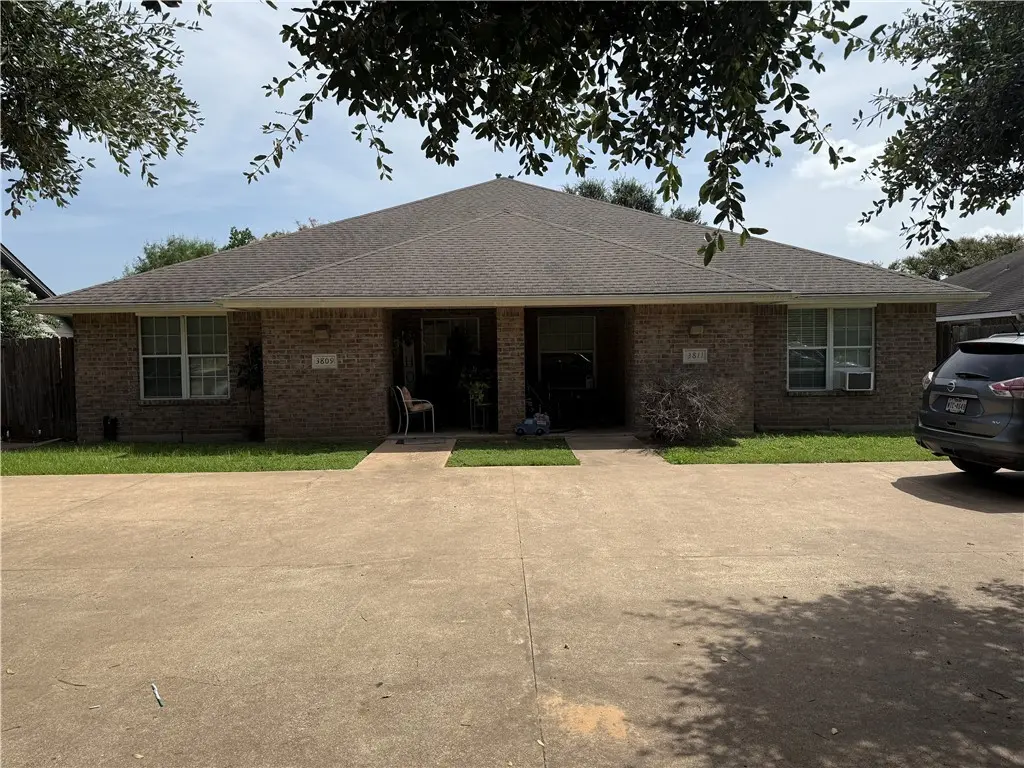
3809-11 Oldenburg Ln · College Station, TX
Flood risk 1/10 · Minimal
- FEMA flood zone
- X (unshaded)
- Chance of flooding over 30 yrs
- 0.0%
- Est. flood insurance / yr
- $507 – $1,088
Fire risk 5/10 · Moderate
- Est. fire insurance / yr
- $1,222 – $2,270
Heat risk 8/10 · Major
- Hot days now (above 110°F)
- 7 days/yr
- Hot days in 30 yrs
- 24 days/yr
Wind risk 8/10 · Major
- Chance of severe wind over 30 yrs
- 91.0%
Air-quality risk 1/10 · Minimal
- Unhealthy air days now
- 0 days/yr
- Unhealthy air days in 30 yrs
- 0 days/yr
Risk factors via First Street. Map © Google.
Why this score? — see what drove the D+ grade
The composite is a weighted blend of 9 inputs, each scored 0–100. Each bar is that input's sub-score; the figure is the points it added to the 100-point composite (weight × sub-score).
- Cash flow +19.4/30.0
- DSCR +6.1/10.0
- 1% rule +5.8/10.0
- Schools +4.7/10.0
- Livability +4.2/5.0
- ARV discount +4.0/15.0
- Rent growth +3.3/5.0
- Condition / age +2.5/5.0
- Appreciation +0.0/10.0
$399,500
🖨 Deal sheet 📄 Offer letter ✓ Due diligence
Multi-family units
County records classify this as Multi-Family (2-4 Unit). Listing-text estimate: 2 units. confirmed
Listing remarks MLS
Exceptional duplex near Texas A & M University, featuring two spacious 3-bed, 3-bath units, each with private fenced-in backyards and patios perfect for outdoor living. Modern interiors boast tile floors, luxury vinyl plank, large closets, and eat-up kitchen bars. Washer/dryer included in each unit, plus ample parking for convenience. Prime location close to grocery stores and shopping. One unit leased through 6/30/27, the other through 2/28/27—ideal for investors or owner-occupants seeking flexibility and value!
Key facts
- Tile floors
- Luxury vinyl plank
- Large closets
Tags
Neighborhood map
What this means for you Summary
Snapshot
- This is a 2 × 3-bed/3-bath units multifamily listed at $400k.
Deal economics
- At list price, monthly cash flow is $449 ($5k/yr) — positive. Per door: $225/mo.
- The deal already cash-flows at list — no discount required.
- Meets the 1% rule at list price ($4k rent vs $400k).
- Recommended offer: $352k (12.0% below list) — sets the bar for market timing.
- Cap rate 7.6% vs local median 3.3% in College Station — top-decile yield for the area; either an underpriced asset or a hidden risk that comps aren't pricing in. Stress-test before assuming the spread holds.
Location & tenants
- Location reads 83/100 on livability (#11 in TX, #994 nationally) — a professional / high-income tenant draw. Strengths: amenities A+, commute A+, crime A-; Watch: employment C-.
- College Station ISD (urban): math 58% / reading 54% proficiency, ranked #113 of 826 in TX (top 14%) — acceptable for families but not a draw, mixed tenant base, ~2y average lease.
- Market conditions: Rents rising (+3.1%/yr); 1168 active listings in the ZIP; solid renter incomes; 2,211 units permitted in Brazos County in 2024 (768 in 5+ unit buildings).
- At $4,300/mo this rent would consume 58% of the median local household income ($89k/yr) (locally 3329% of renters already pay >50% of income on rent) — very limited rent-growth headroom before tenants either downsize or default.
Forward outlook
- Local home prices are declining (-3.0%/yr); year-one equity from $3k of loan paydown is wiped out by about $12k of value loss. Plan a longer hold.
- Brazos County population projected at +55% by 2050 — long-run rental-demand tailwind backs the buy-and-hold thesis.
Negotiation context
- It's been on market 335 days — a 12% lower offer ($352k) is reasonable based on typical stale-listing flexibility.
- 2 sale attempts since 12y ago with the ask held roughly flat each time — persistent listings suggest the price (not the market) is what's stuck; bring a comps-based counter.
Risks & watch-outs
- Climate carrying-cost: severe wind risk, 91% chance of damaging wind over 30y; moderate wildfire risk; extreme-heat days projected 7→24/yr by 2055 (HVAC capex compounding) — expect insurance premiums to compound above CPI over the hold.
Questions for the listing agent
- It's been on market 335 days. Have you received any prior offers? Is the seller open to a 12% concession, seller financing, or rate buy-down credit?
- Can we see the unit-by-unit rent roll, current vacancy, and any below-market leases? What's the average tenancy length?
- What capital expenditures (roof, boiler, parking lot, exteriors) have been made in the last 5 years, and what's planned in the next 2?
- Why hasn't it sold? Are there any deal-killer items the seller is aware of (foundation, flood, title, zoning, code violations)?
- Is there a deadline driving the sale (1031 exchange, divorce, estate, relocation)? That informs how much negotiation room exists.
- Schools are B-rated — typically a magnet for longer-tenancy family renters. What's the average tenant stay here, and is there a school-zone premium baked into asking?
- The area grade is low — what's the realistic commute time and amenity access for the typical tenant pool here? Any planned neighborhood developments (good or bad) we should know about?
- What's the average days-on-market for RENTAL listings here right now (not sales)? A rising rental-DOM trend means longer vacancies and softer asking-rent achievability than the comps imply.
- What's the recent tenant-quality profile in this submarket — average credit score on applications, eviction rate, late-payment / NSF rate, and stable-employment percentage? A property-management company in the area should have these aggregated.
- How much new apartment / multifamily construction is in the pipeline within 1–3 miles? Heavy new supply (>2% of stock underway) typically softens rents 12–24 months out; light construction supports rent growth.
Investment metrics
- 1% rule
- 1.08% ✓
- Cap rate
- 7.64%
- Cash-on-cash
- 4.82%
- DSCR
- 1.21
- GRM
- 7.7
CMA / ARV
- ARV (median comp)
- $370,748
- List price
- $399,500
- Delta
- 10.45%
- Verdict
- OVERPRICED
- Comps
- 6 within 1.0 mi
Projected returns pro-forma
-3.0% appreciation · 3.13% rent growth · sell at horizon
- IRR
- -8.6%
- Equity multiple
- 0.68×
- Total profit
- $-35,386
- Equity at exit
- $59,567
- IRR
- 1.1%
- Equity multiple
- 1.08×
- Total profit
- $9,071
- Equity at exit
- $34,541
Cash invested: $111,860 (down + closing). Projections, not guarantees.
Landlord ↔ Tenant lean methodology
- Overall (STATE)
- 87 Strongly Landlord-Friendly
- State Texas
- 87 Strongly Landlord-Friendly · R+5
- County
- — inherits STATE
- City
- — inherits STATE
ZIP-level market 77845
- Rents YoY
- 3.1%
- Active inventory
- 1168
- Price-to-rent
- 15.5×
Monthly cashflow live
- Estimated rent
- $4,300 high interval (Pro) →
- Mortgage (P&I)
- −$2,095
- Tax from tax record
- −$686 /mo · $8,236/yr
- Insurance
- −$166
- HOA
- −$0
- Vacancy / Maint / Mgmt
- −$903
- Net cashflow
- $449
Break-even live
2-unit breakdown (identical units grouped — click to expand)
| Units | Beds | Baths | Est. rent |
|---|---|---|---|
| 2× units | 3 | 3 | $4,300 |
| #1 | 3 | 3 | $2,150 |
| #2 | 3 | 3 | $2,150 |
| Total (2 units) | $4,300 | ||
UW: 25.0% down · 7.5% · 30yr · 1.5% tax · 5.0% vac · 8.0% maint · 8.0% mgmt
Financing live
Cash to close
- Down payment
- $99,875
- Closing costs
- $11,985
- Reserves months
- —
- Total cash needed
- —
Loan-product check · same deal, 3 products live
Conventional
25% down · 7.5% · 30yr
- Down + closing
- —
- Monthly P&I
- —
- Monthly cashflow
- —
- DSCR
- —
- Eligible?
- —
Personal DTI + credit; lowest rate.
DSCR
20% down · 8.5% · 30yr
- Down + closing
- —
- Monthly P&I
- —
- Monthly cashflow
- —
- DSCR
- —
- Eligible?
- —
No personal income docs; deal must DSCR.
Hard money
10% down · 12.0% · 12mo
- Down + closing
- —
- Monthly P&I
- —
- Monthly cashflow
- —
- DSCR
- —
- Eligible?
- —
Short-term bridge; refi at stabilization.
Listing history 21 events
-
2026-06-18days on market $399,500 Active 335 DOM
-
2026-06-17price $399,500 Active 334 DOM
-
2026-06-17days on market $409,500 Active 334 DOM
-
2026-06-16days on market $409,500 Active 333 DOM
-
2026-06-15days on market $409,500 Active 332 DOM
-
2026-06-14days on market $409,500 Active 330 DOM
-
2026-06-13days on market $409,500 Active 329 DOM
-
2026-06-10days on market $409,500 Active 327 DOM
-
2026-06-09days on market $409,500 Active 326 DOM
-
2026-06-08days on market $409,500 Active 325 DOM
-
2026-06-05days on market $409,500 Active 321 DOM
-
2026-06-02days on market $409,500 Active 319 DOM
-
2026-06-01days on market $409,500 Active 318 DOM
-
2026-05-31days on market $409,500 Active 317 DOM
-
2026-05-30days on market $409,500 Active 316 DOM
-
2025-07-18$409,500 Active 528-char remark
Show marketing remark (528 chars)
Exceptional duplex near Texas A & M University, featuring two spacious 3-bed, 3-bath units, each with private fenced-in backyards and patios perfect for outdoor living. Modern interiors boast tile floors, luxury vinyl plank, large closets, and eat-up kitchen bars. Washer/dryer included in each unit, plus ample parking for convenience. Prime location close to grocery stores and shopping. One unit leased through 6/30/27, the other through 2/28/27—ideal for investors or owner-occupants seeking flexibility and value!
-
2014-05-06soldstatus 364-char remark
Show marketing remark (364 chars)
Great Investment Opportunity! Nice floor plan, living room with raised ceilings, spacious kitchen with plenty of counter space and eating bar, ceramic tile in all wet areas, Luxury water resistant Vinyl Plank on all other floor areas, nice size of bedrooms with 3 full bath. Privacy fenced backyard. Washer, dryer and refrigerator convey. Owner takes care of Lawn.
-
2014-05-06soldstatus
Show marketing remark (364 chars)
Great Investment Opportunity! Nice floor plan, living room with raised ceilings, spacious kitchen with plenty of counter space and eating bar, ceramic tile in all wet areas, Luxury water resistant Vinyl Plank on all other floor areas, nice size of bedrooms with 3 full bath. Privacy fenced backyard. Washer, dryer and refrigerator convey. Owner takes care of Lawn.
-
2014-03-08$232,900 364-char remark
Show marketing remark (364 chars)
Great Investment Opportunity! Nice floor plan, living room with raised ceilings, spacious kitchen with plenty of counter space and eating bar, ceramic tile in all wet areas, Luxury water resistant Vinyl Plank on all other floor areas, nice size of bedrooms with 3 full bath. Privacy fenced backyard. Washer, dryer and refrigerator convey. Owner takes care of Lawn.
-
2007-04-23soldstatus
-
2005-10-13soldstatus
ⓘ Source: listings_history table (triggers on properties + properties_extension) + one-shot
backfill from property_details.listing_events for pre-trigger history.
Tax reassessment forecast TX · Resets to sale price
- Current annual tax
- $8,236 · $686/mo
- Projected year-2 tax
- $8,236 · $686/mo
- Expected delta
- $0/yr ($0/mo · 0.0%)
ⓘ Screening estimate from a state-policy table — verify with the county assessor before closing.
Climate risk First Street
- Flood 1/10 Low FEMA zone X (unshaded) · 0% chance over 30 yrs
- Wildfire 5/10 Major
- Heat 8/10 Severe 7 d/yr ≥110°F today · 24 d/yr by 30 yrs out
- Wind 8/10 Severe 91% chance of damaging wind over 30 yrs
- Air quality 1/10 Low 0 unhealthy d/yr today · 0 by 30 yrs out
Nearby sold comps map
Loading sold comps map…
Walkable amenities ~0.75 mi
Loading nearby amenities…
Taxation est. · year 1
- Rental income
- $51,600
- − Mortgage interest
- −$22,378
- − Property taxes
- −$8,236
- − Insurance
- −$1,998
- − Repairs & maintenance
- −$4,128
- − Management
- −$4,128
- − Depreciation
- −$11,622
- Taxable loss
- −$890
- Est. tax savings @ 24.0%
- +$214
- After-tax cash flow
- $5,604/yr
For passive investors: Depreciation is non-cash, so a rental often shows a tax loss while cash-flowing — sheltering income. Rental losses are passive: they offset passive income freely, and up to $25,000/yr can offset ordinary (W-2) income if you actively participate and your MAGI is under $100k (phasing out to $0 by $150k); unused losses carry forward. On sale, claimed depreciation is recaptured at up to 25%, and gains may owe capital-gains tax (a 1031 exchange can defer both). Figures are a year-1 estimate at your 24.0% rate — not tax advice; consult a CPA.
Schools (NCES district)
- District
- College Station ISD
- NCES district ID
- 4807350
- Math proficiency
- 58% ▼ -4.00%
- Reading proficiency
- 54% ▼ -2.00%
- Median HH income
- $36,991
- Composite
- 46.54/100
- National rank
- #2428
- State rank
- #113 of 826 in TX
Livability — College Station
- Score
- 83/100
- State rank
- #11
- US rank
- #994
Category grades
Schools grade is shown separately in the Schools card above.
Census & demographics
- Census place
- College Station, TX
- County
- Brazos County · 233,400 people
- City population
- 131,628
- Metro
- College Station-Bryan, TX
- Population (ZIP)
- 76,764
- Household income
- $88,851
- Rent vs Own
- Severe rent burden
- 3329.0
Population outlook (Brazos County) Hauer SSP2
- Today (2025)
- 267,942 people
- By 2030
- 296,630 · +10.7%
- By 2040
- 354,560 · +32.3%
- By 2050
- 414,616 · +54.7%
- By 2075
- 562,158 · +109.8%
- By 2100
- 678,828 · +153.3%
Race, ethnicity, and origin ACS 2023
- Neighborhood character
- Predominantly White (69%)
- Race & ethnicity
- White 69% Hispanic / Latino 16% Two or more races 9% Asian 8% Black 5%
- Hispanic origin (detail)
- Mexican 12%
- Common ancestry
- Lithuanian 2% Romanian 2% Italian 2%
- Foreign-born
- 11% · Canada, China, South Korea
- Languages at home
- 83% English-only · Spanish 8% Other Indo-European 3% Chinese 2%
Political lean MEDSL · Brazos
- 2024 margin
- Strong R (+24.9) · D 36.9% · R 61.7% · Other 1.4%
- 2008→2024 swing
- +4.1pp toward D · 2008: -28.9pp · 2024: -24.9pp
- All cycles
- 2024: R+24.9 2020: R+14.3 2016: R+23.7 2012: R+35.3 2008: R+28.9
Not yet ingested
- Civics
- —
Market trends
- HPI YoY
- ▼ -133.31%
- Current HPI
- 175.9669
- Rent YoY
- ▲ 3.13%
- Metro
- College Station-Bryan, TX
- State GDP YoY
- ▲ 3.95%
- F500 in state
- 110
Industry mix (Fortune 500 HQ in TX)
| Industry | F500 HQs | Revenue |
|---|---|---|
| Energy | 16 | $1,198B |
|
||
| Technology | 5 | $198B |
|
||
| Engineering / Construction | 4 | $72B |
|
||
| Energy Services | 3 | $60B |
|
||
| Utilities | 3 | $41B |
|
||
| Healthcare | 2 | $330B |
|
||
Price history
+75.8% since first listed6 events — show timeline
- 2025-07-18 Listed $409,500 BCSRMLS
- 2014-05-06 Sold (Public Records) — Public Records
- 2014-05-06 Sold (MLS) — BCSRMLS
- 2014-03-08 Listed $232,900 BCSRMLS
- 2007-04-23 Sold (Public Records) — Public Records
- 2005-10-13 Sold (Public Records) — Public Records
Property tax history
+4.6%/yrLatest (2025): $8,236 · +16.2% YoY. Source: county tax records.
Cash-flow waterfall
monthlySold comps — $/sqft
last 12 mo · ≤1 miLoading sold comps…