1321 Phoenix Ct · Granbury, TX
Flood risk 6/10 · Moderate
- FEMA flood zone
- X (unshaded)
- Chance of flooding over 30 yrs
- 0.69%
- Est. flood insurance / yr
- $507 – $1,088
Fire risk 6/10 · Moderate
- Est. fire insurance / yr
- $1,222 – $2,270
Heat risk 7/10 · Major
- Hot days now (above 107°F)
- 7 days/yr
- Hot days in 30 yrs
- 21 days/yr
Wind risk 6/10 · Moderate
- Chance of severe wind over 30 yrs
- 27.0%
Air-quality risk 2/10 · Minimal
- Unhealthy air days now
- 1 days/yr
- Unhealthy air days in 30 yrs
- 2 days/yr
Risk factors via First Street. Map © Google.
Why this score? — see what drove the B+ grade
The composite is a weighted blend of 9 inputs, each scored 0–100. Each bar is that input's sub-score; the figure is the points it added to the 100-point composite (weight × sub-score).
- Cash flow +30.0/30.0
- ARV discount +15.0/15.0
- DSCR +10.0/10.0
- 1% rule +9.3/10.0
- Schools +4.0/10.0
- Livability +3.3/5.0
- Rent growth +2.8/5.0
- Condition / age +2.5/5.0
- Appreciation +0.0/10.0
$130,000
🖨 Deal sheet 📄 Offer letter ✓ Due diligence
Listing remarks
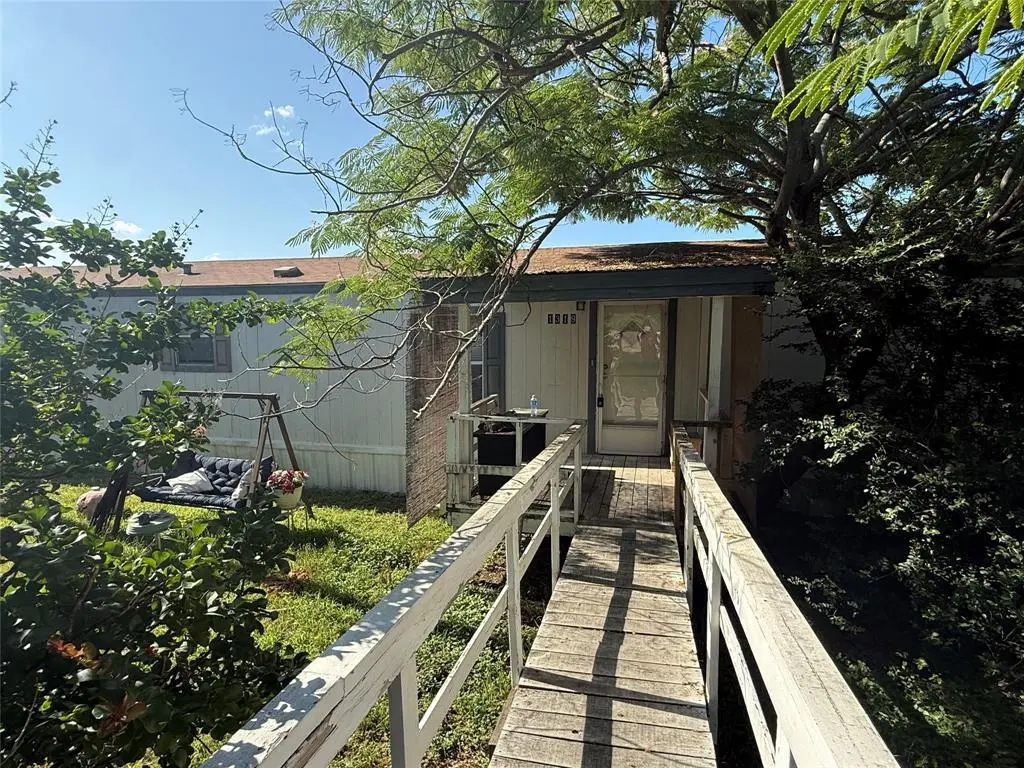
Nestled among mature greenery, this inviting 3 bedroom, 2 bath single wide home offers a peaceful setting with a charming bridge leading to the entrance. Inside, you'll find an open-concept floor plan that creates a spacious and welcoming atmosphere, perfect for everyday living and entertaining. The primary suite features a large walk-in closet, providing plenty of storage space. Enjoy all the amenities Comanche Cove has to offer, including a community park, swimming pool, and boat ramp for easy lake access. This property combines comfort, convenience, and a beautiful natural setting in one of Granbury's popular lake communities. With its functional layout and inviting outdoor surroundings,
Key facts
- Easy lake access
- Community park
- Swimming pool
Tags
Property features AI
Finance
- Other: MLS status: Active; Possession at closing/funding; Exclusions: all items owned by tenant
- Financial info: Treat as clear loan type; No second mortgage
- HOA & community: Mandatory association; Annual association fee of $210; Association fees include full use of facilities
Exterior
- Parking: Detached carport; 2 covered parking spaces; 2 carport spaces
- Utilities: Aerobic septic; Co-op water; Not in a municipal utility district
- Home design: Single-family residence; One story; Residential property
- Construction: Built in 2006
- Exterior features: Less than 0.5-acre lot; Subdivision: Comanche Cove Sub Sec C
Interior
- Kitchen: Dishwasher
- Bedrooms: 3 bedrooms (all on the main level)
- Bathrooms: 2 full bathrooms
- Interior features: Eat-in kitchen; Double vanity; One living area; One dining area; Room count: 4
Neighborhood map
What this means for you Summary
Snapshot
- This is a 3-bed/2.0-bath manufactured listed at $130k.
Deal economics
- At list price, monthly cash flow is $593 ($7k/yr) — positive.
- The deal already cash-flows at list — no discount required.
- Meets the 1% rule at list price ($2k rent vs $130k).
- Recommended offer: $128k (1.5% below list) — sets the bar for market timing.
- Cap rate 11.8% vs local median 3.8% in Granbury — top-decile yield for the area; either an underpriced asset or a hidden risk that comps aren't pricing in. Stress-test before assuming the spread holds.
Location & tenants
- Location reads 66/100 on livability (#628 in TX) — a middle-class / working-renter tenant base. Strengths: cost of living A+, housing A+, health & safety A+; Watch: employment C-, crime D+, amenities F.
- Granbury ISD (town): math 46% / reading 46% proficiency, ranked #237 of 826 in TX (top 29%) — families likely to look elsewhere, expect single-tenant / working-renter base with shorter leases.
- Zoned schools: John And Lynn Brawner El (math 45% / reading 41%, grade F, #1,283 of 4,322 statewide, top 30%, 798 students, 70% FRL) — zoned schools average 70% FRL vs 43% district-wide (27 pts higher); higher-poverty schools than district average — tighter screening recommended.
- Market conditions: Rents rising (+1.1%/yr); 929 active listings in the ZIP; 10 comparable units currently listed for rent nearby; rentals at typical pace (median 24d on market — plan ~3-4 weeks tenant-placement turnaround); 40% of comp listings sitting > 30 days — soft ceiling on asking rent; 125 units permitted in Hood County in 2024 (0 in 5+ unit buildings).
- This rent runs 32% of the median local income ($70k/yr) — at the standard rent-burdened threshold; future hikes will face affordability resistance.
Forward outlook
- Local home prices are declining (-3.0%/yr); year-one equity from $899 of loan paydown is wiped out by about $4k of value loss. Plan a longer hold.
- Hood County population projected at +29% by 2050 — long-run rental-demand tailwind backs the buy-and-hold thesis.
- At projected returns (-3.0% appreciation + 1.1% rent growth), your $36k cash investment doubles in ~8 years — after that, you're playing with house money.
Negotiation context
- It's been on market 15 days — a 2% lower offer ($128k) is reasonable based on typical stale-listing flexibility.
Risks & watch-outs
- Climate carrying-cost: major flood risk; major wind risk, 27% chance of damaging wind over 30y; major wildfire risk; extreme-heat days projected 7→21/yr by 2055 (HVAC capex compounding) — expect insurance premiums to compound above CPI over the hold.
Questions for the listing agent
- What does the HOA fee cover, when was the last increase, and are there any pending special assessments or reserve-fund shortfalls?
- Is there a deadline driving the sale (1031 exchange, divorce, estate, relocation)? That informs how much negotiation room exists.
- Schools are D-rated, which usually means shorter tenancies and higher turnover. Who's the typical renter profile here, and what's been the actual vacancy rate?
- Crime grade is D in this area — have there been break-ins, vandalism, or insurance claims at this property in the last 3 years? What carrier currently insures it and at what premium?
- What's the average days-on-market for RENTAL listings here right now (not sales)? A rising rental-DOM trend means longer vacancies and softer asking-rent achievability than the comps imply.
- What's the recent tenant-quality profile in this submarket — average credit score on applications, eviction rate, late-payment / NSF rate, and stable-employment percentage? A property-management company in the area should have these aggregated.
- How much new for-sale + rental construction is in the pipeline within 1–3 miles? Heavy new supply typically softens prices + rents 12–24 months out; constrained supply supports both.
Investment metrics
- 1% rule
- 1.43% ✓
- Cap rate
- 11.77%
- Cash-on-cash
- 19.56%
- DSCR
- 1.87
- GRM
- 5.8
CMA / ARV
- ARV (on-the-fly)
- $167,680
- Comps found
- 7
Show comp detail 7 sales within ~0.75 mi
| Address | Dist | Beds/Ba | Sqft | Sold | Price | $/sf | Match |
|---|---|---|---|---|---|---|---|
| 1418 Corona Dr | 0.18mi | 3/2.0 | 1,364 (+7%) | 11mo | $180,000 | $132 | 72 |
| 2604 Dove Trl | 0.32mi | 3/2.0 | 1,216 (-5%) | 15mo | $159,900 | $131 | 64 |
| 2518 Quail Run Trl | 0.32mi | 3/2.0 | 1,216 (-5%) | 17mo | $99,000 | $81 | 63 |
| 1315 Woodmere Trl | 0.06mi | 3/2.0 | 1,456 (+14%) | 22mo | $145,000 | $100 | 56 |
| 915 Pecos River Dr | 0.67mi | 3/2.0 | 1,344 (+5%) | 14mo | $199,000 | $148 | 49 |
| 2217 Cedarwood Trl | 0.27mi | 3/2.0 | 1,456 (+14%) | 23mo | $188,000 | $129 | 45 |
| 908 Devils River Dr | 0.70mi | 3/2.0 | 1,344 (+5%) | 18mo | $194,900 | $145 | 44 |
Match score weights: distance 35% · size 25% · config 20% · recency 20%. Top-matched comps best support the ARV.
Projected returns pro-forma
-3.0% appreciation · 1.1% rent growth · sell at horizon
- IRR
- 9.5%
- Equity multiple
- 1.36×
- Total profit
- $13,264
- Equity at exit
- $19,383
- IRR
- 17.0%
- Equity multiple
- 2.28×
- Total profit
- $46,524
- Equity at exit
- $11,240
Cash invested: $36,400 (down + closing). Projections, not guarantees.
Landlord ↔ Tenant lean methodology
- Overall (STATE)
- 87 Strongly Landlord-Friendly
- State Texas
- 87 Strongly Landlord-Friendly · R+5
- County
- — inherits STATE
- City
- — inherits STATE
ZIP-level market 76048
- Home prices YoY
- -23.4%
- Rents YoY
- 1.1%
- Active inventory
- 929
- Price-to-rent
- 5.8×
Monthly cashflow live
- Estimated rent
- $1,854 high interval (Pro) →
- Mortgage (P&I)
- −$682
- Tax from tax record
- −$118 /mo · $1,411/yr
- Insurance
- −$54
- HOA
- −$18
- Vacancy / Maint / Mgmt
- −$389
- Net cashflow
- $593
Break-even live
UW: 25.0% down · 7.5% · 30yr · 1.5% tax · 5.0% vac · 8.0% maint · 8.0% mgmt
Financing live
Cash to close
- Down payment
- $32,500
- Closing costs
- $3,900
- Reserves months
- —
- Total cash needed
- —
Loan-product check · same deal, 3 products live
Conventional
25% down · 7.5% · 30yr
- Down + closing
- —
- Monthly P&I
- —
- Monthly cashflow
- —
- DSCR
- —
- Eligible?
- —
Personal DTI + credit; lowest rate.
DSCR
20% down · 8.5% · 30yr
- Down + closing
- —
- Monthly P&I
- —
- Monthly cashflow
- —
- DSCR
- —
- Eligible?
- —
No personal income docs; deal must DSCR.
Hard money
10% down · 12.0% · 12mo
- Down + closing
- —
- Monthly P&I
- —
- Monthly cashflow
- —
- DSCR
- —
- Eligible?
- —
Short-term bridge; refi at stabilization.
Rent comps 10 comps
| Address | Beds | Baths | Sqft | Rent | $/sqft | DOM | Units | Dist |
|---|---|---|---|---|---|---|---|---|
| 2314 Creekview Dr Granbury, TX | 3.0 | 2.0 | 1294 | $1,850 | $1.43 | 24d | 1 | 0.18mi |
| 2224 Hercules Dr Granbury, TX | 3.0 | 2.0 | 1703 | $2,000 | $1.17 | 24d | 1 | 0.24mi |
| 2502 Coyote Trl Granbury, TX | 2.0 | 2.0 | 900 | $1,400 | $1.56 | 43d | 1 | 0.29mi |
| 2509 Elk Trl Granbury, TX | 3.0 | 2.0 | 1425 | $1,695 | $1.19 | 43d | 1 | 0.39mi |
| 606 Heritage Trl Granbury, TX | 3.0 | 2.0 | 1415 | $1,875 | $1.33 | 43d | 1 | 0.59mi |
| 919 Arkansas River Dr Granbury, TX | 3.0 | 2.0 | 1200 | $1,775 | $1.48 | 12d | 1 | 0.76mi |
| 408 Heritage Trl Granbury, TX | 3.0 | 2.0 | 1635 | $1,890 | $1.16 | 21d | 1 | 0.78mi |
| 3505 Brazos River Dr Granbury, TX | 3.0 | 2.0 | 1337 | $1,900 | $1.42 | 43d | 1 | 0.83mi |
| 1414 Lauren Ln Granbury, TX | 3.0 | 2.0 | 1500 | $2,100 | $1.40 | 24d | 1 | 1.18mi |
| 1113 Gifford Dr Granbury, TX | 3.0 | 2.0 | 1248 | $1,749 | $1.40 | 24d | 1 | 1.39mi |
HOA detail
- Monthly dues
- $18 · $216/yr
- Likely covers
- pool
Listing history 10 events
-
2026-06-18days on market $130,000 Active 15 DOM
-
2026-06-17days on market $130,000 Active 14 DOM
-
2026-06-16days on market $130,000 Active 13 DOM
-
2026-06-15days on market $130,000 Active 12 DOM
-
2026-06-13days on market $130,000 Active 10 DOM
-
2026-06-09days on market $130,000 Active 6 DOM
-
2026-06-08pricedays on market $130,000 Active 5 DOM
-
2026-06-07days on market $150,000 Active 4 DOM
-
2026-06-04remarks 699-char remark
-
2026-06-04$150,000 Active 1 DOM
ⓘ Source: listings_history table (triggers on properties + properties_extension) + one-shot
backfill from property_details.listing_events for pre-trigger history.
Tax reassessment forecast TX · Resets to sale price
- Current annual tax
- $1,411 · $118/mo
- Projected year-2 tax
- $2,379 · $198/mo
- Expected delta
- +$968/yr (+$81/mo · 68.6%)
ⓘ Screening estimate from a state-policy table — verify with the county assessor before closing.
Climate risk First Street
- Flood 6/10 Major FEMA zone X (unshaded) · 69% chance over 30 yrs
- Wildfire 6/10 Major
- Heat 7/10 Severe 7 d/yr ≥107°F today · 21 d/yr by 30 yrs out
- Wind 6/10 Major 27% chance of damaging wind over 30 yrs
- Air quality 2/10 Low 1 unhealthy d/yr today · 2 by 30 yrs out
Nearby sold comps map
Loading sold comps map…
Walkable amenities ~0.75 mi
Loading nearby amenities…
Taxation est. · year 1
- Rental income
- $22,252
- − Mortgage interest
- −$7,282
- − Property taxes
- −$1,411
- − Insurance
- −$650
- − Repairs & maintenance
- −$1,780
- − Management
- −$1,780
- − HOA
- −$216
- − Depreciation
- −$3,782
- Taxable income
- $5,351
- Est. tax owed @ 24.0%
- −$1,284
- After-tax cash flow
- $5,837/yr
For passive investors: Depreciation is non-cash, so a rental often shows a tax loss while cash-flowing — sheltering income. Rental losses are passive: they offset passive income freely, and up to $25,000/yr can offset ordinary (W-2) income if you actively participate and your MAGI is under $100k (phasing out to $0 by $150k); unused losses carry forward. On sale, claimed depreciation is recaptured at up to 25%, and gains may owe capital-gains tax (a 1031 exchange can defer both). Figures are a year-1 estimate at your 24.0% rate — not tax advice; consult a CPA.
Schools (NCES district)
- District
- Granbury ISD
- NCES district ID
- 4821390
- Math proficiency
- 46% ▬ 0.00%
- Reading proficiency
- 46% ▲ 4.00%
- Median HH income
- $55,856
- Composite
- 40.04/100
- National rank
- #3820
- State rank
- #237 of 826 in TX
Livability — Granbury
- Score
- 66/100
- State rank
- #628
- US rank
- #11998
Category grades
Schools grade is shown separately in the Schools card above.
Census & demographics
- County
- Hood County · 58,506 people
- City population
- 58,506
- Metro
- Granbury, TX
- Population (ZIP)
- 27,000
- Household income
- $70,346
- Rent vs Own
- Severe rent burden
- 612.0
Population outlook (Hood County) Hauer SSP2
- Today (2025)
- 63,502 people
- By 2030
- 67,459 · +6.2%
- By 2040
- 74,958 · +18.0%
- By 2050
- 81,922 · +29.0%
- By 2075
- 98,872 · +55.7%
- By 2100
- 107,796 · +69.8%
Race, ethnicity, and origin ACS 2023
- Neighborhood character
- Predominantly White (80%)
- Race & ethnicity
- White 80% Hispanic / Latino 14% Two or more races 11% Black 1%
- Hispanic origin (detail)
- Mexican 13%
- Common ancestry
- Italian 2% Slovak 2% Portuguese 1%
- Foreign-born
- 4% · Canada
- Languages at home
- 89% English-only · Spanish 10%
Political lean MEDSL · Hood
- 2024 margin
- Solid R (+66.0) · D 16.6% · R 82.6%
- 2008→2024 swing
- -11.9pp toward R · 2008: -54.0pp · 2024: -66.0pp
- All cycles
- 2024: R+66.0 2020: R+64.1 2016: R+66.5 2012: R+64.7 2008: R+54.0
Not yet ingested
- Civics
- —
Market trends
- HPI YoY
- ▼ -83.25%
- Current HPI
- 272.2126
- Rent YoY
- ▲ 1.10%
- Metro
- Granbury, TX
- State GDP YoY
- ▲ 3.95%
- F500 in state
- 110
Industry mix (Fortune 500 HQ in TX)
| Industry | F500 HQs | Revenue |
|---|---|---|
| Energy | 16 | $1,198B |
|
||
| Technology | 5 | $198B |
|
||
| Engineering / Construction | 4 | $72B |
|
||
| Energy Services | 3 | $60B |
|
||
| Utilities | 3 | $41B |
|
||
| Healthcare | 2 | $330B |
|
||
Price history
2 events — show timeline
- 2026-06-03 Listed $150,000 NTREIS
- 2004-12-29 Sold (Public Records) — Public Records
Property tax history
+25.5%/yrLatest (2025): $1,411 · -0.4% YoY. Source: county tax records.
Cash-flow waterfall
monthlySold comps — $/sqft
last 12 mo · ≤1 miLoading sold comps…