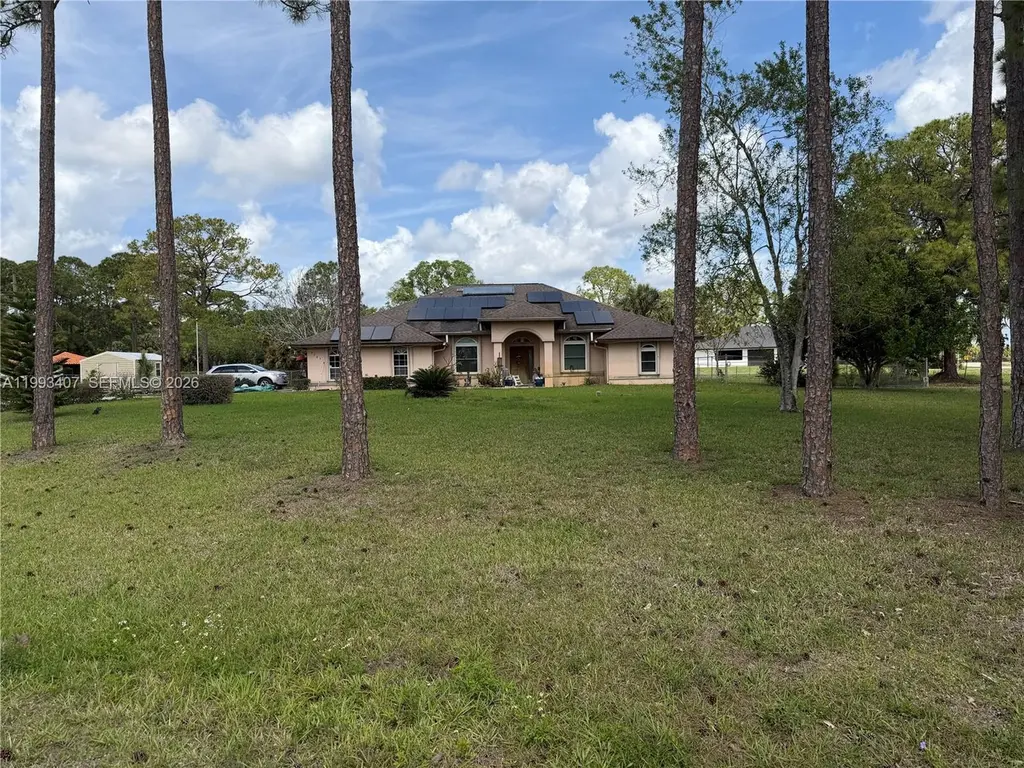
9765 Apache Blvd · The Acreage, FL
Flood risk 1/10 · Minimal
- FEMA flood zone
- X (unshaded)
- Chance of flooding over 30 yrs
- 0.0%
- Est. flood insurance / yr
- $507 – $1,088
Fire risk 4/10 · Minor
- Est. fire insurance / yr
- $947 – $1,759
Heat risk 9/10 · Severe
- Hot days now (above 108°F)
- 7 days/yr
- Hot days in 30 yrs
- 24 days/yr
Wind risk 10/10 · Severe
- Chance of severe wind over 30 yrs
- 99.0%
Air-quality risk 2/10 · Minimal
- Unhealthy air days now
- 1 days/yr
- Unhealthy air days in 30 yrs
- 2 days/yr
Risk factors via First Street. Map © Google.
Why this score? — see what drove the D- grade
The composite is a weighted blend of 9 inputs, each scored 0–100. Each bar is that input's sub-score; the figure is the points it added to the 100-point composite (weight × sub-score).
- Cash flow +9.5/30.0
- ARV discount +7.5/15.0
- Schools +4.3/10.0
- Rent growth +3.5/5.0
- Livability +3.4/5.0
- DSCR +2.7/10.0
- Condition / age +2.5/5.0
- 1% rule +2.0/10.0
- Appreciation +0.0/10.0
$659,900
🖨 Deal sheet 📄 Offer letter ✓ Due diligence
Listing remarks
WONDERFUL PROPERTY WITH 4 BEDS AND 3 BATHS LOCATED IN THE ACREAGE. COUNTRY LIVING IN THE CITY WITH A 1.54 ACRES FULLY FENCED YARD. NEAR MAJOR ROADS AND HIGHWAYS, NEW PUBLIX SHOPPING PLAZA WITH NEW STORES AND RESTAURANTS JUST A FEW MINUTES AWAY. MANY UPGRADES INCLUDING SOLAR PANELS MAKING YOUR ELECTRIC BILL ABOUT $32 A MONTH, WATER HEATER HAS OWN SOLAR PANEL, IMPACT WINDOWS WITH ACCORDION SHUTTERS, AUTOMATIC SPRINKLERS, ROOF INSTALLED 2023, OPEN FLOOR PLAN WITH PLENTY OF SUNSHINE COMING IN, GREAT FOR FAMILY OR ENTERTAINING. CALL TO SHOW. NO HOA.
Key facts
- 1.54 acre lot
- 2 garage spots
- Built 2000
Property features AI
Exterior
- Parking: 2-car garage; Driveway
- Utilities: Well water; Septic tank
- Home design: Single-story home; Faces west; Resale property
- Construction: Block construction; Shingle roof
- Exterior features: Fenced yard; Exterior lighting; City street frontage; One to two acre parcel
Interior
- Kitchen: Gas range; Microwave; Dishwasher; Refrigerator
- Bedrooms: Includes at least one bedroom on the main level
- Flooring: Carpet; Ceramic tile
- Bathrooms: 3 full bathrooms
- Heating & cooling: Central heating; Central air conditioning; Ceiling fans
- Interior features: First-floor entry; Bedroom on the main level; Family room
- Laundry & utility: Washer; Dryer
Neighborhood map
What this means for you Summary
Snapshot
- This is a 3-bed/2.0-bath single-family listed at $660k.
Deal economics
- At list price, monthly cash flow is $-456 ($-5k/yr) — negative.
- To cash-flow at today's rent, offer at most $579k (12.2% below list).
- To meet the 1% rule (rent ≥ 1% of price), the offer needs to be $460k (30.2% below list).
- Recommended offer: $460k (30.2% below list) — sets the bar for 1% rule.
Location & tenants
- Location reads 67/100 on livability (#550 in FL) — a middle-class / working-renter tenant base. Strengths: crime A+, employment A+, housing A+; Watch: amenities F, commute F, cost of living F.
- Palm Beach (suburban): math 46% / reading 53% proficiency, ranked #34 of 73 in FL (top 47%) — families likely to look elsewhere, expect single-tenant / working-renter base with shorter leases.
- Market conditions: Rents rising (+3.9%/yr); 383 active listings in the ZIP; 2 comparable units currently listed for rent nearby; high-income renter base; 3,974 units permitted in Palm Beach County in 2024 (1,012 in 5+ unit buildings).
- This rent runs 42% of the median local income ($130k/yr) — at the standard rent-burdened threshold; future hikes will face affordability resistance.
Forward outlook
- Local home prices are declining (-3.0%/yr); year-one equity from $5k of loan paydown is wiped out by about $20k of value loss. Plan a longer hold.
- Palm Beach County population projected at +30% by 2050 — long-run rental-demand tailwind backs the buy-and-hold thesis.
Negotiation context
- It's been on market 78 days — a 6% lower offer ($620k) is reasonable based on typical stale-listing flexibility.
- 3 sale attempts since 2y ago; this cycle's ask has dropped $65k (9%) from the opening price — seller is motivated, your offer sets the floor, not the list.
Risks & watch-outs
- Climate carrying-cost: severe wind risk, 99% chance of damaging wind over 30y; extreme-heat days projected 7→24/yr by 2055 (HVAC capex compounding) — expect insurance premiums to compound above CPI over the hold.
Questions for the listing agent
- What do current leases actually rent for vs. the listed asking? Can we see a recent rent roll and the last 12 months of T-12 income?
- It's been on market 78 days. Have you received any prior offers? Is the seller open to a 30% concession, seller financing, or rate buy-down credit?
- Why hasn't it sold? Are there any deal-killer items the seller is aware of (foundation, flood, title, zoning, code violations)?
- Is there a deadline driving the sale (1031 exchange, divorce, estate, relocation)? That informs how much negotiation room exists.
- Schools are B-rated — typically a magnet for longer-tenancy family renters. What's the average tenant stay here, and is there a school-zone premium baked into asking?
- The area grade is low — what's the realistic commute time and amenity access for the typical tenant pool here? Any planned neighborhood developments (good or bad) we should know about?
- What's the average days-on-market for RENTAL listings here right now (not sales)? A rising rental-DOM trend means longer vacancies and softer asking-rent achievability than the comps imply.
- What's the recent tenant-quality profile in this submarket — average credit score on applications, eviction rate, late-payment / NSF rate, and stable-employment percentage? A property-management company in the area should have these aggregated.
- How much new for-sale + rental construction is in the pipeline within 1–3 miles? Heavy new supply typically softens prices + rents 12–24 months out; constrained supply supports both.
Investment metrics
- 1% rule
- 0.70% ✗
- Cap rate
- 5.46%
- Cash-on-cash
- -2.96%
- DSCR
- 0.87
- GRM
- 11.9
CMA / ARV
No comps found within radius.
Projected returns pro-forma
-3.0% appreciation · 3.85% rent growth · sell at horizon
- IRR
- -20.4%
- Equity multiple
- 0.28×
- Total profit
- $-132,207
- Equity at exit
- $98,393
- IRR
- -12.1%
- Equity multiple
- 0.26×
- Total profit
- $-136,809
- Equity at exit
- $57,056
Cash invested: $184,772 (down + closing). Projections, not guarantees.
Landlord ↔ Tenant lean methodology
- Overall (STATE)
- 87 Strongly Landlord-Friendly
- State Florida
- 87 Strongly Landlord-Friendly · R+3
- County
- — inherits STATE
- City
- — inherits STATE
ZIP-level market 33412
- Home prices YoY
- -18.2%
- Rents YoY
- 3.9%
- Active inventory
- 383
- Price-to-rent
- 11.9×
Monthly cashflow live
- Estimated rent
- $4,604 medium interval (Pro) →
- Mortgage (P&I)
- −$3,461
- Tax from tax record
- −$357 /mo · $4,285/yr
- Insurance
- −$275
- HOA
- −$0
- Vacancy / Maint / Mgmt
- −$967
- Net cashflow
- $-456
Break-even live
UW: 25.0% down · 7.5% · 30yr · 1.5% tax · 5.0% vac · 8.0% maint · 8.0% mgmt
Financing live
Cash to close
- Down payment
- $164,975
- Closing costs
- $19,797
- Reserves months
- —
- Total cash needed
- —
Loan-product check · same deal, 3 products live
Conventional
25% down · 7.5% · 30yr
- Down + closing
- —
- Monthly P&I
- —
- Monthly cashflow
- —
- DSCR
- —
- Eligible?
- —
Personal DTI + credit; lowest rate.
DSCR
20% down · 8.5% · 30yr
- Down + closing
- —
- Monthly P&I
- —
- Monthly cashflow
- —
- DSCR
- —
- Eligible?
- —
No personal income docs; deal must DSCR.
Hard money
10% down · 12.0% · 12mo
- Down + closing
- —
- Monthly P&I
- —
- Monthly cashflow
- —
- DSCR
- —
- Eligible?
- —
Short-term bridge; refi at stabilization.
Rent comps 2 comps
| Address | Beds | Baths | Sqft | Rent | $/sqft | DOM | Units | Dist |
|---|---|---|---|---|---|---|---|---|
| 15854 Tangelo Blvd West Palm Beach, FL | 3.0 | 3.0 | 1911 | $4,000 | $2.09 | 24d | 1 | 0.49mi |
| 15845 83rd Ln N Loxahatchee, FL | 3.0 | 2.0 | 1850 | $3,999 | $2.16 | 18d | 1 | 1.44mi |
Listing history 23 events
-
2026-06-18days on market $659,900 Active 78 DOM
-
2026-06-17days on market $659,900 Active 77 DOM
-
2026-06-16days on market $659,900 Active 76 DOM
-
2026-06-15price $659,900 Active 75 DOM
-
2026-06-15days on market $699,900 Active 75 DOM
-
2026-06-13days on market $699,900 Active 73 DOM
-
2026-06-09days on market $699,900 Active 69 DOM
-
2026-06-08days on market $699,900 Active 68 DOM
-
2026-06-07days on market $699,900 Active 67 DOM
-
2026-06-04days on market $699,900 Active 64 DOM
-
2026-06-03days on market $699,900 Active 63 DOM
-
2026-06-02days on market $699,900 Active 62 DOM
-
2026-06-01days on market $699,900 Active 61 DOM
-
2026-05-31days on market $699,900 Active 60 DOM
-
2026-05-07price $699,900
-
2026-04-01$725,000 Active
-
2025-08-31historical
-
2025-07-01price $725,000
-
2025-06-23price $775,000
-
2025-05-03price $799,000
-
2025-02-14$825,000 Active
-
2025-02-05historical
-
2024-12-04$750,000 Active
ⓘ Source: listings_history table (triggers on properties + properties_extension) + one-shot
backfill from property_details.listing_events for pre-trigger history.
Tax reassessment forecast FL · Resets to sale price
- Current annual tax
- $4,285 · $357/mo
- Projected year-2 tax
- $5,477 · $456/mo
- Expected delta
- +$1,193/yr (+$99/mo · 27.8%)
ⓘ Screening estimate from a state-policy table — verify with the county assessor before closing.
Climate risk First Street
- Flood 1/10 Low FEMA zone X (unshaded) · 0% chance over 30 yrs
- Wildfire 4/10 Moderate
- Heat 9/10 Extreme 7 d/yr ≥108°F today · 24 d/yr by 30 yrs out
- Wind 10/10 Extreme 99% chance of damaging wind over 30 yrs
- Air quality 2/10 Low 1 unhealthy d/yr today · 2 by 30 yrs out
Nearby sold comps map
Loading sold comps map…
Walkable amenities ~0.75 mi
Loading nearby amenities…
Taxation est. · year 1
- Rental income
- $55,243
- − Mortgage interest
- −$36,965
- − Property taxes
- −$4,285
- − Insurance
- −$3,300
- − Repairs & maintenance
- −$4,419
- − Management
- −$4,419
- − Depreciation
- −$19,197
- Taxable loss
- −$17,342
- Est. tax savings @ 24.0%
- +$4,162
- After-tax cash flow
- $-1,307/yr
For passive investors: Depreciation is non-cash, so a rental often shows a tax loss while cash-flowing — sheltering income. Rental losses are passive: they offset passive income freely, and up to $25,000/yr can offset ordinary (W-2) income if you actively participate and your MAGI is under $100k (phasing out to $0 by $150k); unused losses carry forward. On sale, claimed depreciation is recaptured at up to 25%, and gains may owe capital-gains tax (a 1031 exchange can defer both). Figures are a year-1 estimate at your 24.0% rate — not tax advice; consult a CPA.
Schools (NCES district)
- District
- Palm Beach
- NCES district ID
- 1201500
- Math proficiency
- 46% ▼ -16.00%
- Reading proficiency
- 53% ▼ -4.00%
- Median HH income
- $53,943
- Composite
- 42.72/100
- National rank
- #3160
- State rank
- #34 of 73 in FL
Livability — The Acreage
- Score
- 67/100
- State rank
- #550
- US rank
- #10381
Category grades
Schools grade is shown separately in the Schools card above.
Census & demographics
- Census place
- The Acreage, FL
- County
- Palm Beach County · 1,438,312 people
- Metro
- Miami-Fort Lauderdale-Pompano Beach, FL
- Population (ZIP)
- 15,859
- Household income
- $130,225
- Rent vs Own
- Severe rent burden
- 81.0
Population outlook (Palm Beach County) Hauer SSP2
- Today (2025)
- 1,637,487 people
- By 2030
- 1,743,255 · +6.5%
- By 2040
- 1,948,712 · +19.0%
- By 2050
- 2,132,979 · +30.3%
- By 2075
- 2,530,027 · +54.5%
- By 2100
- 2,706,979 · +65.3%
Race, ethnicity, and origin ACS 2023
- Neighborhood character
- Predominantly White (72%)
- Race & ethnicity
- White 72% Black 11% Hispanic / Latino 11% Two or more races 8% Asian 3%
- Hispanic origin (detail)
- Puerto Rican 4% Cuban 2%
- Common ancestry
- Romanian 5% Lithuanian 4% German 2%
- Foreign-born
- 16% · Canada, Jamaica, China
- Languages at home
- 84% English-only · Spanish 5% French/Haitian/Cajun 5% Other Indo-European 1%
Political lean MEDSL · Palm Beach
- 2024 margin
- Toss-up / Even · D 50.0% · R 49.2%
- 2008→2024 swing
- -22.1pp toward R · 2008: 22.9pp · 2024: 0.8pp
- All cycles
- 2024: D+0.8 2020: D+12.8 2016: D+15.3 2012: D+17.0 2008: D+22.9
Not yet ingested
- Civics
- —
Market trends
- HPI YoY
- ▼ -79.82%
- Current HPI
- 358.0854
- Rent YoY
- ▲ 3.85%
- Metro
- Miami-Fort Lauderdale-Pompano Beach, FL
- State GDP YoY
- ▲ 3.28%
- F500 in state
- 36
Industry mix (Fortune 500 HQ in FL)
| Industry | F500 HQs | Revenue |
|---|---|---|
| Industrial Technology | 2 | $29B |
|
||
| Insurance | 2 | $17B |
|
||
| Retail | 1 | $60B |
|
||
| Technology Distribution | 1 | $58B |
|
||
| Homebuilding | 1 | $35B |
|
||
| Technology Manufacturing | 1 | $35B |
|
||
Price history
-6.7% since first listed9 events — show timeline
- 2026-05-07 Price Changed $699,900 MARMLS
- 2026-04-01 Listed $725,000 MARMLS
- 2025-08-31 Listing Removed — Beaches MLS
- 2025-07-01 Price Changed $725,000 Beaches MLS
- 2025-06-23 Price Changed $775,000 Beaches MLS
- 2025-05-03 Price Changed $799,000 Beaches MLS
- 2025-02-14 Listed $825,000 Beaches MLS
- 2025-02-05 Listing Removed — Beaches MLS
- 2024-12-04 Listed $750,000 Beaches MLS
Property tax history
+1.8%/yrLatest (2025): $4,285 · +4.4% YoY. Source: county tax records.
Cash-flow waterfall
monthlySold comps — $/sqft
last 12 mo · ≤1 miLoading sold comps…