2074 Trailwood Dr · Biloxi, MS
Flood risk 1/10 · Minimal
- FEMA flood zone
- X (unshaded)
- Chance of flooding over 30 yrs
- 0.0%
- Est. flood insurance / yr
- $507 – $1,088
Fire risk 1/10 · Minimal
- Est. fire insurance / yr
- $1,241 – $2,305
Heat risk 10/10 · Severe
- Hot days now (above 106°F)
- 7 days/yr
- Hot days in 30 yrs
- 23 days/yr
Wind risk 9/10 · Severe
- Chance of severe wind over 30 yrs
- 99.0%
Air-quality risk 3/10 · Minor
- Unhealthy air days now
- 2 days/yr
- Unhealthy air days in 30 yrs
- 3 days/yr
Risk factors via First Street. Map © Google.
Why this score? — see what drove the C- grade
The composite is a weighted blend of 9 inputs, each scored 0–100. Each bar is that input's sub-score; the figure is the points it added to the 100-point composite (weight × sub-score).
- Cash flow +14.4/30.0
- ARV discount +13.9/15.0
- Schools +4.5/10.0
- DSCR +4.4/10.0
- 1% rule +4.0/10.0
- Livability +4.0/5.0
- Rent growth +3.2/5.0
- Condition / age +2.5/5.0
- Appreciation +0.0/10.0
$189,900
🖨 Deal sheet 📄 Offer letter ✓ Due diligence
Listing remarks
Calling all investors! Property is sold "AS IS". This 1700 sf 3 bedroom and 1.5 bathroom home is the perfect opportunity to add to your rental portfolio or possible "Flip House". This home is located in Sunkist Manor and is in the North Bay School District. This home will not qulaify for VA or FHA financing. Buyer to verify all information.
Key facts
- 8,712 sq ft lot
- Built 1972
- Listed 15 days
Property features AI
Finance
- HOA & community: Community amenities: boating, fishing, fitness center, golf, near entertainment, restaurant, sports fields
Exterior
- Parking: Driveway with concrete surface
- Utilities: Public water; Public sewer; Electricity connected; Natural gas connected; Water connected
- Home design: Single-family house; One story; Brick veneer construction; Fixer condition; Estimated living area; Faces unspecified
- Construction: Shingle roof; Slab foundation; Built (year per public records)
- Exterior features: Patio; Shed(s); Fenced yard; City lot
Interior
- Kitchen: Dishwasher; Range hood
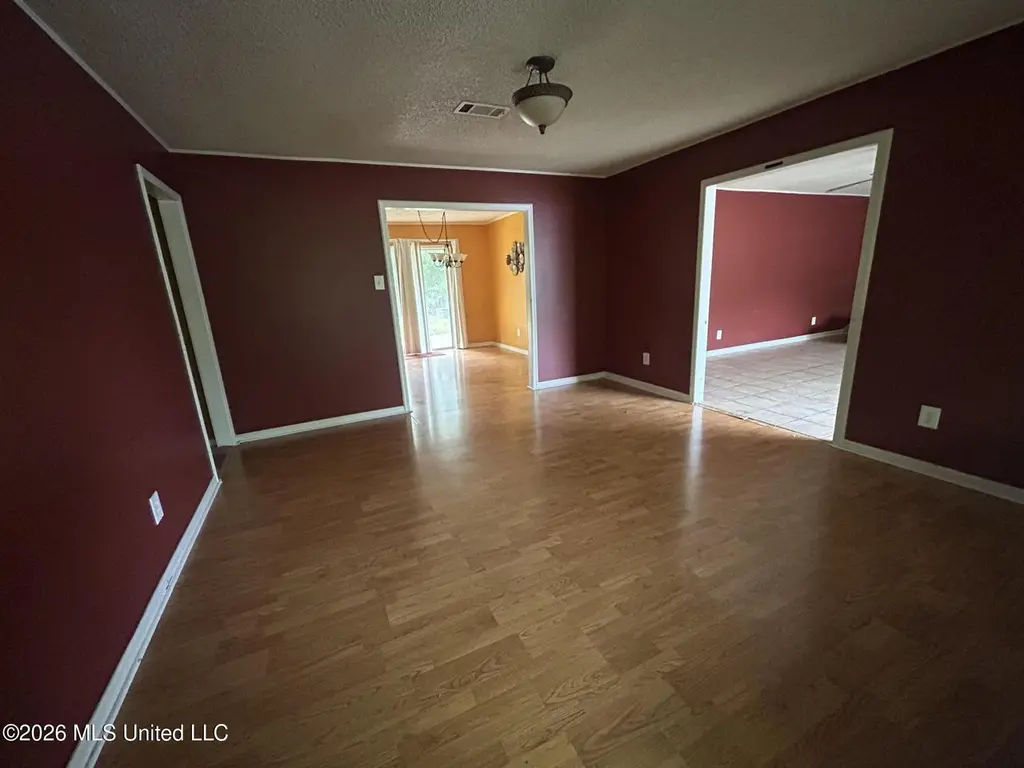
- Flooring: Carpet; Ceramic tile; Laminate
- Bathrooms: 1 full bathroom; 1 half bathroom (1.5 total)
- Heating & cooling: Central heating (natural gas); Central air conditioning (electric)
- Interior features: Sliding doors; Private yard
- Laundry & utility: Laundry room; Gas water heater
Neighborhood map
What this means for you Summary
Snapshot
- This is a 3-bed/1.5-bath single-family listed at $190k.
Deal economics
- At list price, monthly cash flow is $40 ($477/yr) — positive.
- The deal already cash-flows at list — no discount required.
- To meet the 1% rule (rent ≥ 1% of price), the offer needs to be $171k (9.9% below list).
- Recommended offer: $171k (9.9% below list) — sets the bar for 1% rule.
- Cap rate 6.5% vs local median 3.5% in Biloxi — top-decile yield for the area; either an underpriced asset or a hidden risk that comps aren't pricing in. Stress-test before assuming the spread holds.
Location & tenants
- Location reads 79/100 on livability (#6 in MS, #2,141 nationally) — a middle-class / working-renter tenant base. Strengths: crime A+, cost of living A+, housing A+; Watch: commute D+, amenities F, employment D-.
- Biloxi Public School District (urban): math 60% / reading 48% proficiency, ranked #7 of 130 in MS (top 5%) — acceptable for families but not a draw, mixed tenant base, ~2y average lease.
- Market conditions: Rents rising (+3.0%/yr); 392 active listings in the ZIP; 5 comparable units currently listed for rent nearby; rentals leasing fast (median 14d on market — plan ~1-2 weeks tenant-placement turnaround); 2,194 units permitted in Harrison County in 2024 (0 in 5+ unit buildings).
Forward outlook
- Local home prices are declining (-3.0%/yr); year-one equity from $1k of loan paydown is wiped out by about $6k of value loss. Plan a longer hold.
- Harrison County population projected at +27% by 2050 — long-run rental-demand tailwind backs the buy-and-hold thesis.
Negotiation context
- It's been on market 16 days — a 2% lower offer ($187k) is reasonable based on typical stale-listing flexibility.
- 6 sale attempts since 13y ago with the ask held roughly flat each time — persistent listings suggest the price (not the market) is what's stuck; bring a comps-based counter.
Risks & watch-outs
- Climate carrying-cost: severe wind risk, 99% chance of damaging wind over 30y; extreme-heat days projected 7→23/yr by 2055 (HVAC capex compounding) — expect insurance premiums to compound above CPI over the hold.
Questions for the listing agent
- Built in 1972 — when were the roof, HVAC, electrical panel, plumbing, and water heater last replaced?
- Is there a deadline driving the sale (1031 exchange, divorce, estate, relocation)? That informs how much negotiation room exists.
- What's the average days-on-market for RENTAL listings here right now (not sales)? A rising rental-DOM trend means longer vacancies and softer asking-rent achievability than the comps imply.
- What's the recent tenant-quality profile in this submarket — average credit score on applications, eviction rate, late-payment / NSF rate, and stable-employment percentage? A property-management company in the area should have these aggregated.
- How much new for-sale + rental construction is in the pipeline within 1–3 miles? Heavy new supply typically softens prices + rents 12–24 months out; constrained supply supports both.
Investment metrics
- 1% rule
- 0.90% ✗
- Cap rate
- 6.54%
- Cash-on-cash
- 0.90%
- DSCR
- 1.04
- GRM
- 9.2
CMA / ARV
- ARV (median comp)
- $221,476
- List price
- $189,900
- Delta
- -14.26%
- Verdict
- UNDERPRICED
- Comps
- 20 within 1.0 mi
Show comp detail 10 sales within ~0.75 mi
| Address | Dist | Beds/Ba | Sqft | Sold | Price | $/sf | Match |
|---|---|---|---|---|---|---|---|
| 799 Holly Hills Dr | 0.11mi | 3/2.0 | 1,204 (+2%) | 17mo | $170,000 | $141 | 75 |
| 883 Laurelwood Dr | 0.37mi | 2/2.0 (-1) | 1,156 (-2%) | 5mo | $185,000 | $160 | 68 |
| 735 Highland Dr | 0.23mi | 3/1.0 | 1,200 (+2%) | 21mo | $99,000 | $83 | 66 |
| 883 Rustwood Dr | 0.31mi | 3/2.0 | 1,188 (+1%) | 21mo | $172,000 | $145 | 64 |
| 873 Carolee Cir | 0.28mi | 3/2.0 | 1,309 (+11%) | 3mo | $175,000 | $134 | 64 |
| 2219 Popps Ferry Rd | 0.57mi | 3/1.5 | 1,177 (0%) | 21mo | $160,000 | $136 | 56 |
| 957 Rustwood Dr | 0.55mi | 3/2.0 | 1,251 (+6%) | 7mo | $189,900 | $152 | 56 |
| 2059 Woodfield Ln | 0.45mi | 3/2.0 | 1,296 (+10%) | 10mo | $199,000 | $154 | 52 |
| 850 Vee St | 0.36mi | 3/2.0 | 1,092 (-7%) | 23mo | $109,000 | $100 | 50 |
| 2189 Baywood Dr | 0.34mi | 3/2.0 | 1,341 (+14%) | 12mo | $215,000 | $160 | 48 |
Match score weights: distance 35% · size 25% · config 20% · recency 20%. Top-matched comps best support the ARV.
Projected returns pro-forma
-3.0% appreciation · 2.98% rent growth · sell at horizon
- IRR
- -14.9%
- Equity multiple
- 0.47×
- Total profit
- $-28,247
- Equity at exit
- $28,315
- IRR
- -6.2%
- Equity multiple
- 0.60×
- Total profit
- $-21,370
- Equity at exit
- $16,419
Cash invested: $53,172 (down + closing). Projections, not guarantees.
Landlord ↔ Tenant lean methodology
- Overall (STATE)
- 90 Strongly Landlord-Friendly
- State Mississippi
- 90 Strongly Landlord-Friendly · R+11
- County
- — inherits STATE
- City
- — inherits STATE
ZIP-level market 39532
- Rents YoY
- 3.0%
- Active inventory
- 392
- Price-to-rent
- 9.2×
Monthly cashflow live
- Estimated rent
- $1,712 high interval (Pro) →
- Mortgage (P&I)
- −$996
- Tax est. 1.5%
- −$237 /mo · $2,848/yr
- Insurance
- −$79
- HOA
- −$0
- Vacancy / Maint / Mgmt
- −$359
- Net cashflow
- $40
Break-even live
UW: 25.0% down · 7.5% · 30yr · 1.5% tax · 5.0% vac · 8.0% maint · 8.0% mgmt
Financing live
Cash to close
- Down payment
- $47,475
- Closing costs
- $5,697
- Reserves months
- —
- Total cash needed
- —
Loan-product check · same deal, 3 products live
Conventional
25% down · 7.5% · 30yr
- Down + closing
- —
- Monthly P&I
- —
- Monthly cashflow
- —
- DSCR
- —
- Eligible?
- —
Personal DTI + credit; lowest rate.
DSCR
20% down · 8.5% · 30yr
- Down + closing
- —
- Monthly P&I
- —
- Monthly cashflow
- —
- DSCR
- —
- Eligible?
- —
No personal income docs; deal must DSCR.
Hard money
10% down · 12.0% · 12mo
- Down + closing
- —
- Monthly P&I
- —
- Monthly cashflow
- —
- DSCR
- —
- Eligible?
- —
Short-term bridge; refi at stabilization.
Rent comps 5 comps
| Address | Beds | Baths | Sqft | Rent | $/sqft | DOM | Units | Dist |
|---|---|---|---|---|---|---|---|---|
| 883 Rustwood Dr Biloxi, MS | 3.0 | 2.0 | 1188 | $1,700 | $1.43 | 21d | 1 | 0.30mi |
| 875 Laurelwood Dr Biloxi, MS | 2.0 | 2.0 | 1200 | $1,750 | $1.46 | 13d | 1 | 0.37mi |
| 1955 Popps Ferry Rd Biloxi, MS | 1.0–3.0 | 1.0–2.0 | 1347 | $1,647 | $1.22 | 43d | 1 | 0.51mi |
| 1773 Popps Ferry Rd Biloxi, MS | 1.0–2.0 | 1.0–2.0 | 968 | $1,205 | $1.24 | 13d | 13 | 1.45mi |
| 1735 Tribe Dr Biloxi, MS | 3.0 | 2.0 | 1290 | $2,195 | $1.70 | 13d | 12 | 1.47mi |
Listing history 12 events
-
2026-05-11$189,900 Active 363-char remark
-
2021-10-02historical
-
2021-10-02historical
-
2017-04-06$115,000
-
2016-09-13$115,000
-
2016-09-12historical
-
2016-05-02$115,000
-
2016-04-27historical
-
2014-07-28$115,000
-
2014-02-01historical
-
2013-08-01$145,600
-
2010-01-22soldstatus
ⓘ Source: listings_history table (triggers on properties + properties_extension) + one-shot
backfill from property_details.listing_events for pre-trigger history.
Climate risk First Street
- Flood 1/10 Low FEMA zone X (unshaded) · 0% chance over 30 yrs
- Wildfire 1/10 Low
- Heat 10/10 Extreme 7 d/yr ≥106°F today · 23 d/yr by 30 yrs out
- Wind 9/10 Extreme 99% chance of damaging wind over 30 yrs
- Air quality 3/10 Moderate 2 unhealthy d/yr today · 3 by 30 yrs out
Nearby sold comps map
Loading sold comps map…
Walkable amenities ~0.75 mi
Loading nearby amenities…
Taxation est. · year 1
- Rental income
- $20,539
- − Mortgage interest
- −$10,637
- − Property taxes
- −$2,848
- − Insurance
- −$950
- − Repairs & maintenance
- −$1,643
- − Management
- −$1,643
- − Depreciation
- −$5,524
- Taxable loss
- −$2,707
- Est. tax savings @ 24.0%
- +$650
- After-tax cash flow
- $1,127/yr
For passive investors: Depreciation is non-cash, so a rental often shows a tax loss while cash-flowing — sheltering income. Rental losses are passive: they offset passive income freely, and up to $25,000/yr can offset ordinary (W-2) income if you actively participate and your MAGI is under $100k (phasing out to $0 by $150k); unused losses carry forward. On sale, claimed depreciation is recaptured at up to 25%, and gains may owe capital-gains tax (a 1031 exchange can defer both). Figures are a year-1 estimate at your 24.0% rate — not tax advice; consult a CPA.
Schools (NCES district)
- District
- Biloxi Public School District
- NCES district ID
- 2800630
- Math proficiency
- 60% ▼ -7.00%
- Reading proficiency
- 48% ▼ -3.00%
- Median HH income
- $40,608
- Composite
- 45.26/100
- National rank
- #2657
- State rank
- #7 of 130 in MS
Livability — Biloxi
- Score
- 79/100
- State rank
- #6
- US rank
- #2141
Category grades
Schools grade is shown separately in the Schools card above.
Census & demographics
- Census place
- Biloxi, MS
- County
- Harrison County · 178,171 people
- City population
- 63,281
- Metro
- Gulfport-Biloxi, MS
- Population (ZIP)
- 36,662
- Household income
- $68,710
- Rent vs Own
- Severe rent burden
- 954.0
Population outlook (Harrison County) Hauer SSP2
- Today (2025)
- 228,444 people
- By 2030
- 241,942 · +5.9%
- By 2040
- 267,531 · +17.1%
- By 2050
- 291,062 · +27.4%
- By 2075
- 346,711 · +51.8%
- By 2100
- 378,165 · +65.5%
Race, ethnicity, and origin ACS 2023
- Neighborhood character
- Predominantly White (69%)
- Race & ethnicity
- White 69% Black 15% Two or more races 9% Hispanic / Latino 6% Asian 4%
- Hispanic origin (detail)
- Mexican 2%
- Common ancestry
- Lithuanian 5% Italian 2% Serbian 2%
- Foreign-born
- 4% · Vietnam, Canada
- Languages at home
- 94% English-only · Spanish 2% Vietnamese 1% Other Indo-European 1%
Political lean MEDSL · Harrison
- 2024 margin
- Strong R (+28.9) · D 35.0% · R 63.9% · Other 1.1%
- 2008→2024 swing
- -2.9pp toward R · 2008: -26.0pp · 2024: -28.9pp
- All cycles
- 2024: R+28.9 2020: R+25.2 2016: R+30.7 2012: R+26.6 2008: R+26.0
Not yet ingested
- Civics
- —
Market trends
- HPI YoY
- ▼ -90.04%
- Current HPI
- 154.9975
- Rent YoY
- ▲ 2.98%
- Metro
- Gulfport-Biloxi, MS
- State GDP YoY
- —
- F500 in state
- 0
Price history
+30.4% since first listed13 events — show timeline
- 2026-05-28 Listing Removed — MLSU
- 2026-05-11 Listed $189,900 MLSU
- 2021-10-02 Listing Removed — MLSU
- 2021-10-02 Listing Removed — MLSU
- 2017-04-06 Listed $115,000 MLSU
- 2016-09-13 Listed $115,000 MLSU
- 2016-09-12 Listing Removed — MLSU
- 2016-05-02 Listed $115,000 MLSU
- 2016-04-27 Listing Removed — MLSU
- 2014-07-28 Listed $115,000 MLSU
- 2014-02-01 Listing Removed — MLSU
- 2013-08-01 Listed $145,600 MLSU
- 2010-01-22 Sold (Public Records) — Public Records
Property tax history
-14.3%/yrLatest (2025): $108 · +0.9% YoY. Source: county tax records.
Cash-flow waterfall
monthlySold comps — $/sqft
last 12 mo · ≤1 miLoading sold comps…