 🌊 Lakefront
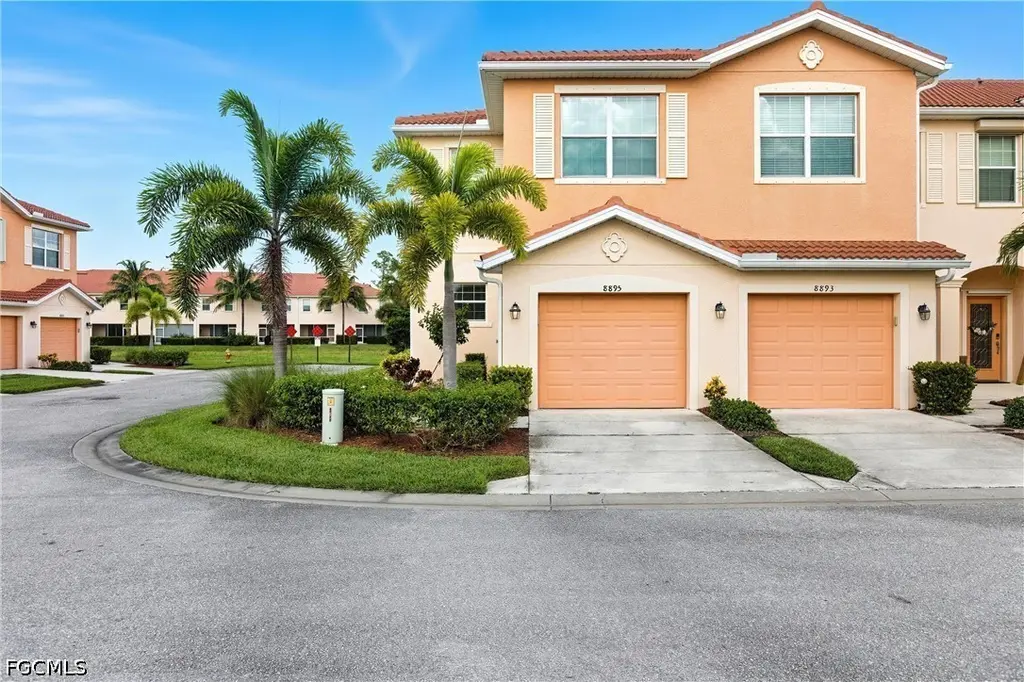
8895 Via Isola Ct · Fort Myers, FL
Flood risk 1/10 · Minimal
- FEMA flood zone
- AE
- Chance of flooding over 30 yrs
- 0.0%
- Est. flood insurance / yr
- $1,737 – $8,500
Fire risk 5/10 · Moderate
- Est. fire insurance / yr
- $947 – $1,759
Heat risk 10/10 · Severe
- Hot days now (above 107°F)
- 7 days/yr
- Hot days in 30 yrs
- 29 days/yr
Wind risk 10/10 · Severe
- Chance of severe wind over 30 yrs
- 99.0%
Air-quality risk 2/10 · Minimal
- Unhealthy air days now
- 1 days/yr
- Unhealthy air days in 30 yrs
- 1 days/yr
Risk factors via First Street. Map © Google.
Why this score? — see what drove the B- grade
The composite is a weighted blend of 9 inputs, each scored 0–100. Each bar is that input's sub-score; the figure is the points it added to the 100-point composite (weight × sub-score).
- Cash flow +30.0/30.0
- 1% rule +10.0/10.0
- DSCR +10.0/10.0
- ARV discount +7.5/15.0
- Livability +4.3/5.0
- Schools +4.1/10.0
- Condition / age +2.5/5.0
- Rent growth +1.2/5.0
- Appreciation +0.0/10.0
$268,500
🖨 Deal sheet 📄 Offer letter ✓ Due diligence
Listing remarks
Beautiful lakefront end-unit townhome with 3 bedrooms, 2.5 baths, and 1,934 sq ft of thoughtfully designed living space. This light-filled residence features a modern kitchen with sleek finishes and abundant cabinet storage, perfect for both everyday living and entertaining. Enjoy peaceful water views, a private garage, and the ease of lawn care included. Pet-friendly community with resort-style amenities, offering a relaxed, low-maintenance lifestyle in a highly desirable setting. Schedule your showing today!
Key facts
- Lakefront
- Water views
- Private garage
Tags
Property features AI
Finance
- Financial info: Pets allowed (call/conditional)
- HOA & community: Homeowners association (quarterly fee); Quarterly association fee of $1,227; Association covers legal/accounting, grounds maintenance, road maintenance, street lights; Community amenities: clubhouse, pool, management
Exterior
- Parking: Attached garage; Garage with opener; 1 covered garage space
- Security: Smoke detector(s); Gated community
- Utilities: Public water; Public sewer; Cable available; Municipal irrigation
- Home design: 2 stories; Entry level: 2; Resale property; Faces southwest
- Construction: Built with block, concrete and stucco; Tile roof
- Exterior features: Storage; Lanai; Porch; Screened porch; Community pool; Pond on lot; Northeast exposure; Has view; Lake waterfront
Interior
- Kitchen: Dishwasher; Electric cooktop; Microwave; Refrigerator
- Bedrooms: Upper-level primary
- Flooring: Carpet; Tile
- Bathrooms: 2 full bathrooms; 1 half bathroom
- Heating & cooling: Central heating (electric); Central air (electric); Ceiling fan(s)
- Interior features: Dual sinks; Living/dining room; Upper-level primary bedroom; Walk-in closet(s); Split bedrooms; Single-hung windows; Unfurnished
- Laundry & utility: Washer hookup; Dryer hookup; Inside laundry
Neighborhood map
What this means for you Summary
Snapshot
- This is a 3-bed/3.0-bath single-family listed at $268k.
Deal economics
- At list price, monthly cash flow is $1k ($13k/yr) — positive.
- The deal already cash-flows at list — no discount required.
- Meets the 1% rule at list price ($5k rent vs $268k).
- Recommended offer: $264k (1.5% below list) — sets the bar for market timing.
- Cap rate 13.2% vs local median 3.0% in Fort Myers — top-decile yield for the area; either an underpriced asset or a hidden risk that comps aren't pricing in. Stress-test before assuming the spread holds.
Location & tenants
- Location reads 86/100 on livability (#14 in FL, #383 nationally) — a professional / high-income tenant draw. Strengths: amenities A+, commute A+, housing A+.
- Lee (suburban): math 47% / reading 50% proficiency, ranked #42 of 73 in FL (top 58%) — families likely to look elsewhere, expect single-tenant / working-renter base with shorter leases.
- Market conditions: Rents falling (-5.3%/yr); 181 active listings in the ZIP; 40 comparable units currently listed for rent nearby; rentals at typical pace (median 24d on market — plan ~3-4 weeks tenant-placement turnaround); solid renter incomes; 15,411 units permitted in Lee County in 2024 (4,686 in 5+ unit buildings).
- At $4,810/mo this rent would consume 68% of the median local household income ($85k/yr) (locally 539% of renters already pay >50% of income on rent) — very limited rent-growth headroom before tenants either downsize or default.
Forward outlook
- Local home prices are declining (-3.0%/yr); year-one equity from $2k of loan paydown is wiped out by about $8k of value loss. Plan a longer hold.
- Lee County population projected at +44% by 2050 — long-run rental-demand tailwind backs the buy-and-hold thesis.
Negotiation context
- It's been on market 17 days — a 2% lower offer ($264k) is reasonable based on typical stale-listing flexibility.
- 19 sale attempts since 3y ago; this cycle's ask has dropped $16k (6%) from the opening price — seller is motivated, your offer sets the floor, not the list.
Risks & watch-outs
- Watch-outs: flood insurance adds $427/mo.
- Climate carrying-cost: in FEMA flood zone AE (mandatory federal flood insurance); severe wind risk, 99% chance of damaging wind over 30y; moderate wildfire risk; extreme-heat days projected 7→29/yr by 2055 (HVAC capex compounding) — expect insurance premiums to compound above CPI over the hold.
Questions for the listing agent
- What's the actual annual flood-insurance premium (NFIP or private), and is the property in a SFHA with mandatory coverage?
- What does the HOA fee cover, when was the last increase, and are there any pending special assessments or reserve-fund shortfalls?
- Is there a deadline driving the sale (1031 exchange, divorce, estate, relocation)? That informs how much negotiation room exists.
- This sits on a lake — are riparian / water-frontage rights deeded with the parcel? Any dock permits, shoreline easements, or HOA water-use restrictions?
- What's the documented flood / surge / shoreline-erosion history here (FEMA AND non-FEMA — e.g., storm surge, creek backup, septic-field saturation)?
- Any water-quality or seasonal algae-bloom issues that affect tenant satisfaction or short-term-rental demand?
- What's the average days-on-market for RENTAL listings here right now (not sales)? A rising rental-DOM trend means longer vacancies and softer asking-rent achievability than the comps imply.
- What's the recent tenant-quality profile in this submarket — average credit score on applications, eviction rate, late-payment / NSF rate, and stable-employment percentage? A property-management company in the area should have these aggregated.
- How much new for-sale + rental construction is in the pipeline within 1–3 miles? Heavy new supply typically softens prices + rents 12–24 months out; constrained supply supports both.
Investment metrics
- 1% rule
- 1.79% ✓
- Cap rate
- 13.20%
- Cash-on-cash
- 24.67%
- DSCR
- 2.10
- GRM
- 4.7
CMA / ARV
No comps found within radius.
Projected returns pro-forma
-3.0% appreciation · 0.0% rent growth · sell at horizon
- IRR
- 5.1%
- Equity multiple
- 1.19×
- Total profit
- $14,244
- Equity at exit
- $40,034
- IRR
- 10.7%
- Equity multiple
- 1.69×
- Total profit
- $52,054
- Equity at exit
- $23,215
Cash invested: $75,180 (down + closing). Projections, not guarantees.
Landlord ↔ Tenant lean methodology
- Overall (STATE)
- 87 Strongly Landlord-Friendly
- State Florida
- 87 Strongly Landlord-Friendly · R+3
- County
- — inherits STATE
- City
- — inherits STATE
ZIP-level market 33966
- Home prices YoY
- -24.2%
- Rents YoY
- -5.3%
- Active inventory
- 181
- Price-to-rent
- 4.7×
Monthly cashflow live
- Estimated rent
- $4,810 high interval (Pro) →
- Mortgage (P&I)
- −$1,408
- Tax from tax record
- −$325 /mo · $3,904/yr
- Insurance
- −$112
- Flood insurance flood zone
- −$427 /mo · $5,118/yr
- HOA
- −$409
- Vacancy / Maint / Mgmt
- −$1,010
- Net cashflow
- $1,119
Break-even live
UW: 25.0% down · 7.5% · 30yr · 1.5% tax · 5.0% vac · 8.0% maint · 8.0% mgmt
Financing live
Cash to close
- Down payment
- $67,125
- Closing costs
- $8,055
- Reserves months
- —
- Total cash needed
- —
Loan-product check · same deal, 3 products live
Conventional
25% down · 7.5% · 30yr
- Down + closing
- —
- Monthly P&I
- —
- Monthly cashflow
- —
- DSCR
- —
- Eligible?
- —
Personal DTI + credit; lowest rate.
DSCR
20% down · 8.5% · 30yr
- Down + closing
- —
- Monthly P&I
- —
- Monthly cashflow
- —
- DSCR
- —
- Eligible?
- —
No personal income docs; deal must DSCR.
Hard money
10% down · 12.0% · 12mo
- Down + closing
- —
- Monthly P&I
- —
- Monthly cashflow
- —
- DSCR
- —
- Eligible?
- —
Short-term bridge; refi at stabilization.
Rent comps 40 comps
| Address | Beds | Baths | Sqft | Rent | $/sqft | DOM | Units | Dist |
|---|---|---|---|---|---|---|---|---|
| 10281 Via Colomba Cir Fort Myers, FL | 3.0 | 2.5 | 1934 | $2,100 | $1.09 | 3d | 1 | 0.05mi |
| 8892 Via Isola Ct Fort Myers, FL | 3.0 | 2.5 | 1942 | $2,000 | $1.03 | 14d | 1 | 0.05mi |
| 10246 Via Colomba Cir Fort Myers, FL | 3.0 | 2.5 | 2350 | $2,395 | $1.02 | 23d | 1 | 0.06mi |
| 10020 Via Colomba Cir Fort Myers, FL | 3.0 | 2.5 | 1942 | $2,100 | $1.08 | 23d | 1 | 0.11mi |
| 10028 Via Colomba Cir Fort Myers, FL | 3.0 | 2.5 | 1942 | $2,250 | $1.16 | 23d | 1 | 0.12mi |
| 9851 6 Mile Cypress Pkwy Fort Myers, FL | 3.0 | 1.0–2.0 | 1040 | $2,437 | $2.34 | 2d | 42 | 0.28mi |
| 7922 Dani Dr Fort Myers, FL | 1.0–3.0 | 1.0–2.0 | 981 | $2,023 | $2.06 | 1d | 32 | 0.34mi |
| 10356 White Palm Way Fort Myers, FL | 2.0 | 2.0 | 1667 | $8,000 | $4.80 | 23d | 1 | 0.57mi |
| 4795 Cypress Gardens Loop Fort Myers, FL | 1.0–3.0 | 1.0–2.0 | 1093 | $2,801 | $2.56 | 10d | 12 | 0.58mi |
| 10381 McArthur Palm Ln #2723 Fort Myers, FL | 2.0 | 2.0 | 1400 | $7,000 | $5.00 | 23d | 1 | 0.67mi |
| 4701 Mirage Bay Cir Fort Myers, FL | 1.0–3.0 | 1.0–2.0 | 1067 | $2,179 | $2.04 | 23d | 14 | 0.70mi |
| 10072 Oakhurst Way Fort Myers, FL | 2.0 | 2.0 | 1511 | $7,400 | $4.90 | 23d | 1 | 0.73mi |
| 10074 Oakhurst Way Fort Myers, FL | 3.0 | 2.0 | 1727 | $7,500 | $4.34 | 23d | 1 | 0.73mi |
| 4633 Mystic Blue Way Fort Myers, FL | 3.0 | 2.5 | 2234 | $3,200 | $1.43 | 23d | 1 | 0.74mi |
| 10401 McArthur Palm Ln #2523 Fort Myers, FL | 2.0 | 2.0 | 1400 | $7,000 | $5.00 | 23d | 1 | 0.75mi |
| 10092 Oakhurst Way Fort Myers, FL | 2.0 | 2.0 | 1505 | $6,700 | $4.45 | 19d | 1 | 0.79mi |
| 10960 Cherry Laurel Dr Fort Myers, FL | 4.0 | 3.0 | 2032 | $4,000 | $1.97 | 23d | 1 | 0.80mi |
| 10025 Oakhurst Way Fort Myers, FL | 2.0 | 2.0 | 1504 | $7,100 | $4.72 | 23d | 1 | 0.81mi |
| 10018 Oakhurst Way Fort Myers, FL | 3.0 | 2.0 | 1512 | $2,975 | $1.97 | 23d | 1 | 0.83mi |
| 10063 Majestic Ave Fort Myers, FL | 2.0 | 2.0 | 1692 | $7,100 | $4.20 | 23d | 1 | 0.87mi |
| 10053 Majestic Ave Fort Myers, FL | 2.0 | 2.0 | 1692 | $7,400 | $4.37 | 23d | 1 | 0.89mi |
| 8076 Queen Palm Ln #437 Fort Myers, FL | 2.0 | 2.0 | 1232 | $6,000 | $4.87 | 23d | 1 | 0.93mi |
| 4048 Cherrybrook Loop Fort Myers, FL | 3.0 | 2.5 | 1876 | $2,400 | $1.28 | 23d | 1 | 0.96mi |
| 4420 Waterscape Ln Fort Myers, FL | 2.0 | 2.0 | 1525 | $2,395 | $1.57 | 23d | 1 | 0.96mi |
| 4590 Winkler Ave Fort Myers, FL | 1.0–3.0 | 1.0–2.0 | 1000 | $1,844 | $1.84 | 23d | 59 | 0.99mi |
| 9639 Hemingway Ln #3505 Fort Myers, FL | 2.0 | 2.0 | 1234 | $4,800 | $3.89 | 23d | 1 | 1.08mi |
| 9661 Hemingway Ln #3207 Fort Myers, FL | 2.0 | 2.0 | 1300 | $3,900 | $3.00 | 3d | 1 | 1.09mi |
| 9453 River Otter Dr Fort Myers, FL | 4.0 | 3.0 | 2032 | $2,995 | $1.47 | 3d | 1 | 1.10mi |
| 10361 Butterfly Palm Dr #745 Fort Myers, FL | 2.0 | 2.0 | 1232 | $6,000 | $4.87 | 23d | 1 | 1.11mi |
| 9582 Hemingway Ln #3403 Fort Myers, FL | 2.0 | 2.0 | 1385 | $5,400 | $3.90 | 14d | 1 | 1.12mi |
| 9582 Hemingway Ln #3403 Fort Myers, FL | 2.0 | 2.0 | 1385 | $5,400 | $3.90 | 23d | 1 | 1.12mi |
| 9582 Hemingway Ln #3402 Fort Myers, FL | 2.0 | 2.0 | 1382 | $5,500 | $3.98 | 23d | 1 | 1.12mi |
| 11280 Reflection Isles Blvd Fort Myers, FL | 3.0 | 2.0 | 1670 | $3,500 | $2.10 | 23d | 1 | 1.15mi |
| 10391 Butterfly Palm Dr #1036 Fort Myers, FL | 2.0 | 2.0 | 1232 | $6,000 | $4.87 | 23d | 1 | 1.15mi |
| 11072 Esteban Dr Fort Myers, FL | 3.0 | 3.0 | 1875 | $7,250 | $3.87 | 23d | 1 | 1.16mi |
| 4732 Imperial Eagle Dr Fort Myers, FL | 4.0 | 3.0 | 1920 | $11,000 | $5.73 | 23d | 1 | 1.24mi |
| 8309 Adelio Ln Fort Myers, FL | 3.0 | 2.0 | 1809 | $6,500 | $3.59 | 3d | 1 | 1.32mi |
| 4116 Sunny Aspen Cir Fort Myers, FL | 1.0–3.0 | 1.0–2.0 | 1007 | $2,079 | $2.06 | 1d | 60 | 1.34mi |
| 11011 Mill Creek Way #1307 Fort Myers, FL | 2.0 | 2.0 | 1379 | $5,000 | $3.63 | 23d | 1 | 1.35mi |
| 10537 Washingtonia Palm Way #4126 Fort Myers, FL | 2.0 | 2.0 | 1662 | $7,000 | $4.21 | 23d | 1 | 1.35mi |
HOA detail
- Monthly dues
- $409 · $4,908/yr
- Likely covers
- waterlandscaping
Listing history 50 events
-
2026-06-18days on market $268,500 Active 17 DOM
-
2026-06-17days on market $268,500 Active 16 DOM
-
2026-06-16days on market $268,500 Active 15 DOM
-
2026-06-15days on market $268,500 Active 14 DOM
-
2026-06-13days on market $268,500 Active 12 DOM
-
2026-06-10days on market $268,500 Active 9 DOM
-
2026-06-09days on market $268,500 Active 8 DOM
-
2026-06-08pricedays on market $268,500 Active 7 DOM
-
2026-06-07days on market $268,900 Active 6 DOM
-
2026-06-03days on market $268,900 Active 2 DOM
-
2026-06-02price $268,900 Active 1 DOM
-
2026-06-02days on market $269,000 Active 1 DOM
-
2026-06-01days on market $269,000 Active 114 DOM
-
2026-06-01days on market $269,000 Active 113 DOM
-
2026-05-14price $269,000
-
2026-05-10price $269,900
-
2026-05-04price $275,700
-
2026-04-26price $275,800
-
2026-04-15price $275,900
-
2026-03-30price $276,000
-
2026-03-07price $279,000
-
2026-02-07$285,000 Active
-
2026-01-29historical $1,949
-
2026-01-27$1,949
-
2026-01-27historical $1,949
-
2026-01-23$1,949
-
2026-01-23historical $1,949
-
2026-01-22$1,949
-
2026-01-21historical $1,949
-
2026-01-10$1,949
-
2026-01-10historical $1,949
-
2026-01-10$1,949
-
2026-01-08historical $1,999
-
2026-01-08$1,999
-
2026-01-08historical $1,999
-
2025-12-18$1,999
-
2025-12-18historical $1,999
-
2025-12-18$1,999
-
2025-12-17historical $1,999
-
2025-11-15$1,999
-
2025-11-14historical $1,999
-
2025-10-28$1,999
-
2025-10-28historical $2,099
-
2025-10-08$2,099
-
2025-10-08historical $2,099
-
2025-10-02$2,099
-
2025-10-02historical $2,099
-
2025-09-27$2,099
-
2025-09-27historical $2,099
-
2025-08-21$2,099
ⓘ Source: listings_history table (triggers on properties + properties_extension) + one-shot
backfill from property_details.listing_events for pre-trigger history.
Tax reassessment forecast FL · Resets to sale price
- Current annual tax
- $3,904 · $325/mo
- Projected year-2 tax
- $3,904 · $325/mo
- Expected delta
- $0/yr ($0/mo · 0.0%)
ⓘ Screening estimate from a state-policy table — verify with the county assessor before closing.
Climate risk First Street
- Flood 1/10 Low FEMA zone AE · 0% chance over 30 yrs
- Wildfire 5/10 Major
- Heat 10/10 Extreme 7 d/yr ≥107°F today · 29 d/yr by 30 yrs out
- Wind 10/10 Extreme 99% chance of damaging wind over 30 yrs
- Air quality 2/10 Low 1 unhealthy d/yr today · 1 by 30 yrs out
Nearby sold comps map
Loading sold comps map…
Walkable amenities ~0.75 mi
Loading nearby amenities…
Taxation est. · year 1
- Rental income
- $57,718
- − Mortgage interest
- −$15,040
- − Property taxes
- −$3,904
- − Insurance
- −$6,461
- − Repairs & maintenance
- −$4,617
- − Management
- −$4,617
- − HOA
- −$4,908
- − Depreciation
- −$7,811
- Taxable income
- $10,359
- Est. tax owed @ 24.0%
- −$2,486
- After-tax cash flow
- $10,942/yr
For passive investors: Depreciation is non-cash, so a rental often shows a tax loss while cash-flowing — sheltering income. Rental losses are passive: they offset passive income freely, and up to $25,000/yr can offset ordinary (W-2) income if you actively participate and your MAGI is under $100k (phasing out to $0 by $150k); unused losses carry forward. On sale, claimed depreciation is recaptured at up to 25%, and gains may owe capital-gains tax (a 1031 exchange can defer both). Figures are a year-1 estimate at your 24.0% rate — not tax advice; consult a CPA.
Schools (NCES district)
- District
- Lee
- NCES district ID
- 1201080
- Math proficiency
- 47% ▼ -11.00%
- Reading proficiency
- 50% ▼ -4.00%
- Median HH income
- $49,518
- Composite
- 41.49/100
- National rank
- #3458
- State rank
- #42 of 73 in FL
Livability — Fort Myers
- Score
- 86/100
- State rank
- #14
- US rank
- #383
Category grades
Schools grade is shown separately in the Schools card above.
Census & demographics
- Census place
- Fort Myers, FL
- County
- Lee County · 788,662 people
- City population
- 278,598
- Metro
- Cape Coral-Fort Myers, FL
- Population (ZIP)
- 12,513
- Household income
- $84,965
- Rent vs Own
- Severe rent burden
- 539.0
Population outlook (Lee County) Hauer SSP2
- Today (2025)
- 871,946 people
- By 2030
- 955,468 · +9.6%
- By 2040
- 1,113,587 · +27.7%
- By 2050
- 1,256,891 · +44.1%
- By 2075
- 1,560,270 · +78.9%
- By 2100
- 1,726,848 · +98.0%
Race, ethnicity, and origin ACS 2023
- Neighborhood character
- Predominantly White (69%)
- Race & ethnicity
- White 69% Two or more races 15% Hispanic / Latino 12% Black 7% Asian 4%
- Hispanic origin (detail)
- Mexican 1% Puerto Rican 2% Cuban 1%
- Common ancestry
- Hispanic 4% Romanian 3% Slovak 3%
- Foreign-born
- 13% · Canada, Vietnam, Philippines
- Languages at home
- 83% English-only · Spanish 10% Other Indo-European 2% Other Asian/Pacific 2%
Political lean MEDSL · Lee
- 2024 margin
- Strong R (+28.4) · D 35.5% · R 63.9%
- 2008→2024 swing
- -18.0pp toward R · 2008: -10.4pp · 2024: -28.4pp
- All cycles
- 2024: R+28.4 2020: R+19.2 2016: R+20.4 2012: R+16.6 2008: R+10.4
Not yet ingested
- Civics
- —
Market trends
- HPI YoY
- ▼ -70.16%
- Current HPI
- 219.1188
- Rent YoY
- ▼ -5.28%
- Metro
- Cape Coral-Fort Myers, FL
- State GDP YoY
- ▲ 3.28%
- F500 in state
- 36
Industry mix (Fortune 500 HQ in FL)
| Industry | F500 HQs | Revenue |
|---|---|---|
| Industrial Technology | 2 | $29B |
|
||
| Insurance | 2 | $17B |
|
||
| Retail | 1 | $60B |
|
||
| Technology Distribution | 1 | $58B |
|
||
| Homebuilding | 1 | $35B |
|
||
| Technology Manufacturing | 1 | $35B |
|
||
Price history
-4.6% since first listed47 events — show timeline
- 2026-05-14 Price Changed $269,000 FORTMLS
- 2026-05-10 Price Changed $269,900 FORTMLS
- 2026-05-04 Price Changed $275,700 FORTMLS
- 2026-04-26 Price Changed $275,800 FORTMLS
- 2026-04-15 Price Changed $275,900 FORTMLS
- 2026-03-30 Price Changed $276,000 FORTMLS
- 2026-03-07 Price Changed $279,000 FORTMLS
- 2026-02-07 Listed $285,000 FORTMLS
- 2026-01-29 Rental Removed $1,949 TENANTTURNER2
- 2026-01-27 Listed for Rent $1,949 TENANTTURNER2
- 2026-01-27 Rental Removed $1,949 FORTMLS
- 2026-01-23 Listed for Rent $1,949 FORTMLS
- 2026-01-23 Rental Removed $1,949 TENANTTURNER2
- 2026-01-22 Listed for Rent $1,949 TENANTTURNER2
- 2026-01-21 Rental Removed $1,949 NAPLESMLS
- 2026-01-10 Listed for Rent $1,949 NAPLESMLS
- 2026-01-10 Rental Removed $1,949 FORTMLS
- 2026-01-10 Listed for Rent $1,949 FORTMLS
- 2026-01-08 Rental Removed $1,999 FGCMLS
- 2026-01-08 Listed for Rent $1,999 FGCMLS
- 2026-01-08 Rental Removed $1,999 FORTMLS
- 2025-12-18 Listed for Rent $1,999 FORTMLS
- 2025-12-18 Rental Removed $1,999 NAPLESMLS
- 2025-12-18 Listed for Rent $1,999 NAPLESMLS
- 2025-12-17 Rental Removed $1,999 NAPLESMLS
- 2025-11-15 Listed for Rent $1,999 NAPLESMLS
- 2025-11-14 Rental Removed $1,999 NAPLESMLS
- 2025-10-28 Listed for Rent $1,999 NAPLESMLS
- 2025-10-28 Rental Removed $2,099 NAPLESMLS
- 2025-10-08 Listed for Rent $2,099 NAPLESMLS
- 2025-10-08 Rental Removed $2,099 NAPLESMLS
- 2025-10-02 Listed for Rent $2,099 NAPLESMLS
- 2025-10-02 Rental Removed $2,099 FORTMLS
- 2025-09-27 Listed for Rent $2,099 FORTMLS
- 2025-09-27 Rental Removed $2,099 NAPLESMLS
- 2025-08-21 Listed for Rent $2,099 NAPLESMLS
- 2025-08-21 Rental Removed $2,199 NAPLESMLS
- 2025-07-24 Listed for Rent $2,199 NAPLESMLS
- 2025-07-24 Rental Removed $2,199 TENANTTURNER2
- 2025-07-20 Listed for Rent $2,199 TENANTTURNER2
- 2024-04-05 Rental Removed $2,299 FORTMLS
- 2024-03-12 Price Changed $2,299 FORTMLS
- 2024-02-24 Listed for Rent $2,399 FORTMLS
- 2024-02-23 Rental Removed $2,500 STELLARMLS
- 2024-01-22 Price Changed $2,500 STELLARMLS
- 2023-11-16 Listed for Rent $2,400 STELLARMLS
- 2019-02-14 Sold (Public Records) $282,000 Public Records
Property tax history
+43.8%/yrLatest (2025): $3,904 · +2.7% YoY. Source: county tax records.
Cash-flow waterfall
monthlySold comps — $/sqft
last 12 mo · ≤1 miLoading sold comps…