 🔨 Auction
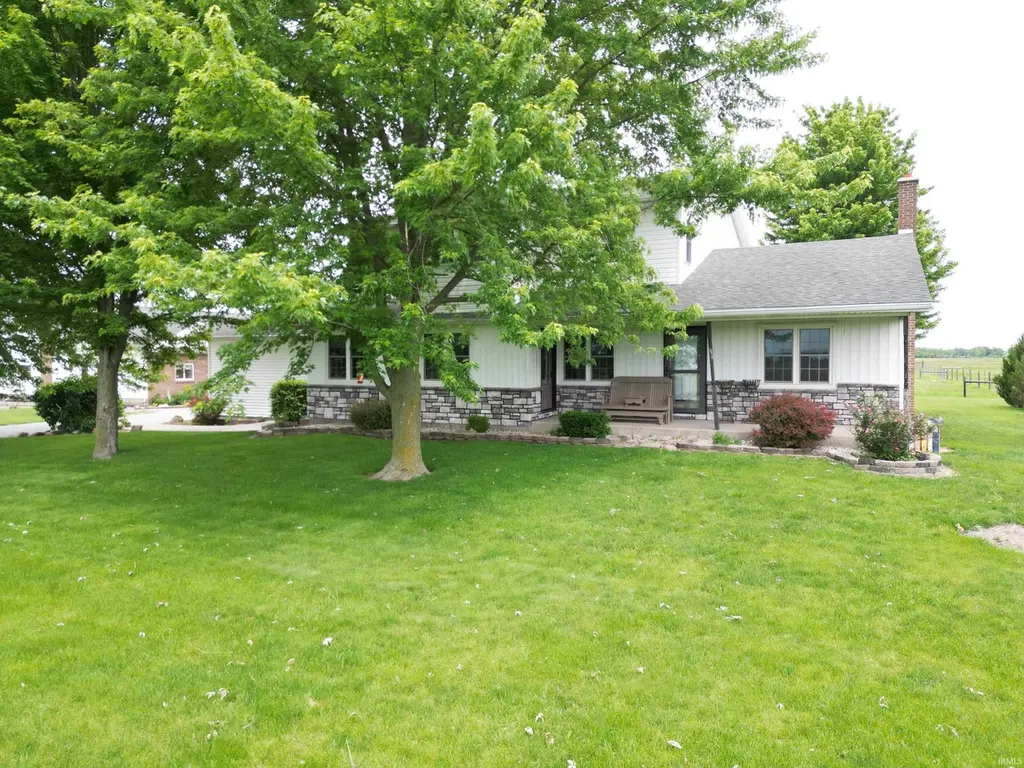
6222 Bruick Rd · Fort Wayne, IN
Flood risk 1/10 · Minimal
- FEMA flood zone
- X (unshaded)
- Chance of flooding over 30 yrs
- 0.0%
- Est. flood insurance / yr
- $473 – $860
Fire risk 1/10 · Minimal
- Est. fire insurance / yr
- $717 – $1,331
Heat risk 3/10 · Minor
- Hot days now (above 100°F)
- 7 days/yr
- Hot days in 30 yrs
- 17 days/yr
Wind risk 2/10 · Minimal
- Chance of severe wind over 30 yrs
- —
Air-quality risk 3/10 · Minor
- Unhealthy air days now
- 3 days/yr
- Unhealthy air days in 30 yrs
- 3 days/yr
Risk factors via First Street. Map © Google.
Why this score? — see what drove the D+ grade
The composite is a weighted blend of 9 inputs, each scored 0–100. Each bar is that input's sub-score; the figure is the points it added to the 100-point composite (weight × sub-score).
- Cash flow +15.0/30.0
- ARV discount +7.5/15.0
- 1% rule +5.0/10.0
- DSCR +5.0/10.0
- Livability +4.2/5.0
- Schools +3.6/10.0
- Rent growth +2.5/5.0
- Condition / age +2.5/5.0
- Appreciation +0.0/10.0
$1,000
🖨 Deal sheet 📄 Offer letter ✓ Due diligence
Listing remarks
13.1 acres offered in 2 tracts . A public Auction on July 21st 2026 at 6:00 P. M.
Key facts
- 13 acre lot
- 2 garage spots
- Built 1998
Property features AI
Finance
- Other: No additional financial amenities provided
- Financial info: No investor or income/expense details provided
- HOA & community: No HOA information provided
Exterior
- Parking: Detached 2-car garage
- Security: No security details provided
- Utilities: Private well water; Septic tank sewer
- Home design: Single-family residence (site-built); 3 stories
- Construction: Metal, shingle, stone, and vinyl siding; Slab foundation
- Exterior features: Sloped and level areas; Pasture; Barn(s); 13-acre lot
Interior
- Kitchen: No kitchen appliance details provided
- Bedrooms: Bedrooms located on various levels
- Flooring: No flooring details provided
- Bathrooms: 2 full bathrooms; 1 bathroom on the main level
- Heating & cooling: Heat pump and natural gas heating; Heat pump cooling
- Interior features: Partial, partially finished basement; 7 total rooms
- Laundry & utility: Main-level laundry
Neighborhood map
What this means for you Summary
Snapshot
- This is a 6-bed/2.0-bath single-family listed at $1k.
Deal economics
- At list price, monthly cash flow is $1k ($16k/yr) — positive.
- The deal already cash-flows at list — no discount required.
- Meets the 1% rule at list price ($2k rent vs $1k).
- Recommended offer: $985 (1.5% below list) — sets the bar for market timing.
- Cap rate 1623.3% vs local median 4.8% in Fort Wayne — top-decile yield for the area; either an underpriced asset or a hidden risk that comps aren't pricing in. Stress-test before assuming the spread holds.
Location & tenants
- Location reads 84/100 on livability (#6 in IN, #676 nationally) — a professional / high-income tenant draw. Strengths: amenities A+, commute A+, cost of living A+; Watch: crime C-, employment D+.
- East Allen County Schools (suburban): math 36% / reading 47% proficiency, ranked #122 of 301 in IN (top 40%) — families likely to look elsewhere, expect single-tenant / working-renter base with shorter leases.
- Zoned schools: Woodlan Elementary School (math 48% / reading 55%, grade C-, #256 of 994 statewide, top 26%, 583 students, 41% FRL); Woodlan Jr/Sr High School (math 35% / reading 52%, grade F, #191 of 369 statewide, top 52%, 727 students, 31% FRL).
- Market conditions: 176 active listings in the ZIP; 1,861 units permitted in Allen County in 2024 (576 in 5+ unit buildings).
Forward outlook
- Local home prices are declining (-3.0%/yr); year-one equity from $7 of loan paydown is wiped out by about $30 of value loss. Plan a longer hold.
- Allen County population projected at +10% by 2050 — modest demand growth; plan on rents tracking national, not racing it.
- At projected returns (-3.0% appreciation + 3.0% rent growth), your $280 cash investment doubles in ~1 year — after that, you're playing with house money.
Negotiation context
- It's been on market 22 days — a 2% lower offer ($985) is reasonable based on typical stale-listing flexibility.
Questions for the listing agent
- Is there a deadline driving the sale (1031 exchange, divorce, estate, relocation)? That informs how much negotiation room exists.
- Schools are D-rated, which usually means shorter tenancies and higher turnover. Who's the typical renter profile here, and what's been the actual vacancy rate?
- The area grade is low — what's the realistic commute time and amenity access for the typical tenant pool here? Any planned neighborhood developments (good or bad) we should know about?
- What's the average days-on-market for RENTAL listings here right now (not sales)? A rising rental-DOM trend means longer vacancies and softer asking-rent achievability than the comps imply.
- What's the recent tenant-quality profile in this submarket — average credit score on applications, eviction rate, late-payment / NSF rate, and stable-employment percentage? A property-management company in the area should have these aggregated.
- How much new for-sale + rental construction is in the pipeline within 1–3 miles? Heavy new supply typically softens prices + rents 12–24 months out; constrained supply supports both.
Investment metrics
- 1% rule
- 171.45% ✓
- Cap rate
- 1623.32%
- Cash-on-cash
- 5775.09%
- DSCR
- 257.96
- GRM
- 0.0
CMA / ARV
No comps found within radius.
Projected returns pro-forma
-3.0% appreciation · 3.0% rent growth · sell at horizon
- IRR
- —
- Equity multiple
- 307.03×
- Total profit
- $85,688
- Equity at exit
- $149
- IRR
- —
- Equity multiple
- 662.55×
- Total profit
- $185,233
- Equity at exit
- $86
Cash invested: $280 (down + closing). Projections, not guarantees.
Landlord ↔ Tenant lean methodology
- Overall (STATE)
- 90 Strongly Landlord-Friendly
- State Indiana
- 90 Strongly Landlord-Friendly · R+11
- County
- — inherits STATE
- City
- — inherits STATE
ZIP-level market 46774
- Active inventory
- 176
Monthly cashflow live
- Estimated rent
- $1,714 medium interval (Pro) →
- Mortgage (P&I)
- −$5
- Tax est. 1.5%
- −$1 /mo · $15/yr
- Insurance
- −$0
- HOA
- −$0
- Vacancy / Maint / Mgmt
- −$360
- Net cashflow
- $1,348
Break-even live
UW: 25.0% down · 7.5% · 30yr · 1.5% tax · 5.0% vac · 8.0% maint · 8.0% mgmt
Financing live
Cash to close
- Down payment
- $250
- Closing costs
- $30
- Reserves months
- —
- Total cash needed
- —
Loan-product check · same deal, 3 products live
Conventional
25% down · 7.5% · 30yr
- Down + closing
- —
- Monthly P&I
- —
- Monthly cashflow
- —
- DSCR
- —
- Eligible?
- —
Personal DTI + credit; lowest rate.
DSCR
20% down · 8.5% · 30yr
- Down + closing
- —
- Monthly P&I
- —
- Monthly cashflow
- —
- DSCR
- —
- Eligible?
- —
No personal income docs; deal must DSCR.
Hard money
10% down · 12.0% · 12mo
- Down + closing
- —
- Monthly P&I
- —
- Monthly cashflow
- —
- DSCR
- —
- Eligible?
- —
Short-term bridge; refi at stabilization.
Listing history 16 events
-
2026-06-18days on market $1,000 Active 22 DOM
-
2026-06-17days on market $1,000 Active 21 DOM
-
2026-06-16days on market $1,000 Active 20 DOM
-
2026-06-15days on market $1,000 Active 19 DOM
-
2026-06-14days on market $1,000 Active 17 DOM
-
2026-06-13days on market $1,000 Active 16 DOM
-
2026-06-10days on market $1,000 Active 14 DOM
-
2026-06-09days on market $1,000 Active 13 DOM
-
2026-06-08days on market $1,000 Active 12 DOM
-
2026-06-07days on market $1,000 Active 11 DOM
-
2026-06-03days on market $1,000 Active 7 DOM
-
2026-06-02days on market $1,000 Active 6 DOM
-
2026-06-01days on market $1,000 Active 5 DOM
-
2026-05-31days on market $1,000 Active 4 DOM
-
2026-05-30days on market $1,000 Active 3 DOM
-
2026-05-27$1,000 Active
ⓘ Source: listings_history table (triggers on properties + properties_extension) + one-shot
backfill from property_details.listing_events for pre-trigger history.
Climate risk First Street
- Flood 1/10 Low FEMA zone X (unshaded) · 0% chance over 30 yrs
- Wildfire 1/10 Low
- Heat 3/10 Moderate 7 d/yr ≥100°F today · 17 d/yr by 30 yrs out
- Wind 2/10 Low
- Air quality 3/10 Moderate 3 unhealthy d/yr today · 3 by 30 yrs out
Nearby sold comps map
Loading sold comps map…
Walkable amenities ~0.75 mi
Loading nearby amenities…
Taxation est. · year 1
- Rental income
- $20,574
- − Mortgage interest
- −$56
- − Property taxes
- −$15
- − Insurance
- −$5
- − Repairs & maintenance
- −$1,646
- − Management
- −$1,646
- − Depreciation
- −$29
- Taxable income
- $17,177
- Est. tax owed @ 24.0%
- −$4,122
- After-tax cash flow
- $12,048/yr
For passive investors: Depreciation is non-cash, so a rental often shows a tax loss while cash-flowing — sheltering income. Rental losses are passive: they offset passive income freely, and up to $25,000/yr can offset ordinary (W-2) income if you actively participate and your MAGI is under $100k (phasing out to $0 by $150k); unused losses carry forward. On sale, claimed depreciation is recaptured at up to 25%, and gains may owe capital-gains tax (a 1031 exchange can defer both). Figures are a year-1 estimate at your 24.0% rate — not tax advice; consult a CPA.
Schools (NCES district)
- District
- East Allen County Schools
- NCES district ID
- 1802850
- Math proficiency
- 36% ▼ -8.00%
- Reading proficiency
- 47% ▼ -4.00%
- Median HH income
- $50,524
- Composite
- 35.75/100
- National rank
- #4849
- State rank
- #122 of 301 in IN
Livability — Fort Wayne
- Score
- 84/100
- State rank
- #6
- US rank
- #676
Category grades
Schools grade is shown separately in the Schools card above.
Census & demographics
- City population
- 326,813
- Population (ZIP)
- 17,066
Population outlook (Allen County) Hauer SSP2
- Today (2025)
- 394,020 people
- By 2030
- 405,128 · +2.8%
- By 2040
- 423,476 · +7.5%
- By 2050
- 435,137 · +10.4%
- By 2075
- 450,293 · +14.3%
- By 2100
- 424,101 · +7.6%
Race, ethnicity, and origin ACS 2023
- Neighborhood character
- Predominantly White (89%)
- Race & ethnicity
- White 89% Two or more races 4% Hispanic / Latino 4% Black 3% Asian 1%
- Common ancestry
- Lithuanian 5% Italian 2% Slovak 1%
- Foreign-born
- 3% · Canada, Philippines
- Languages at home
- 89% English-only · German/W. Germanic 6% Spanish 3% Chinese 1%
Political lean MEDSL · Allen
- 2024 margin
- R (+12.5) · D 42.9% · R 55.4% · Other 1.7%
- 2008→2024 swing
- -8.1pp toward R · 2008: -4.3pp · 2024: -12.5pp
- All cycles
- 2024: R+12.5 2020: R+11.2 2016: R+19.6 2012: R+16.8 2008: R+4.3
Not yet ingested
- Civics
- —
Market trends
- HPI YoY
- ▼ -185.27%
- Current HPI
- 241.5333
- Rent YoY
- —
- Metro
- —
- State GDP YoY
- ▲ 2.90%
- F500 in state
- 18
Industry mix (Fortune 500 HQ in IN)
| Industry | F500 HQs | Revenue |
|---|---|---|
| Industrial Machinery | 2 | $37B |
|
||
| Healthcare | 1 | $177B |
|
||
| Pharmaceuticals | 1 | $45B |
|
||
| Metals / Steel | 1 | $18B |
|
||
| Agriculture | 1 | $17B |
|
||
| Packaging | 1 | $12B |
|
||
Price history
1 event — show timeline
- 2026-05-27 Listed $1,000 IRMLS
Cash-flow waterfall
monthlySold comps — $/sqft
last 12 mo · ≤1 miLoading sold comps…