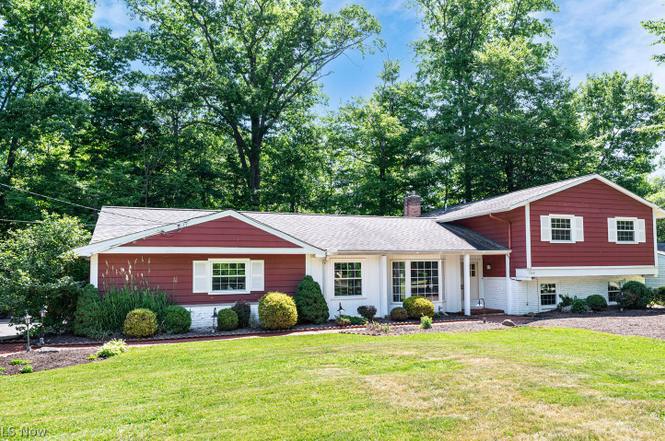
729 Kenwood Dr · Mayfield, OH
Flood risk 1/10 · Minimal
- FEMA flood zone
- X (unshaded)
- Chance of flooding over 30 yrs
- 0.0%
- Est. flood insurance / yr
- $473 – $860
Fire risk 3/10 · Minor
- Est. fire insurance / yr
- $713 – $1,323
Heat risk 2/10 · Minimal
- Hot days now (above 94°F)
- 7 days/yr
- Hot days in 30 yrs
- 17 days/yr
Wind risk 1/10 · Minimal
- Chance of severe wind over 30 yrs
- —
Air-quality risk 3/10 · Minor
- Unhealthy air days now
- 3 days/yr
- Unhealthy air days in 30 yrs
- 4 days/yr
Risk factors via First Street. Map © Google.
Why this score? — see what drove the A- grade
The composite is a weighted blend of 9 inputs, each scored 0–100. Each bar is that input's sub-score; the figure is the points it added to the 100-point composite (weight × sub-score).
- Cash flow +30.0/30.0
- ARV discount +15.0/15.0
- DSCR +10.0/10.0
- 1% rule +9.9/10.0
- Schools +5.5/10.0
- Appreciation +4.0/10.0
- Livability +4.0/5.0
- Rent growth +2.5/5.0
- Condition / age +2.5/5.0
$399,000
🖨 Deal sheet (PDF) 📄 Offer letter ✓ Due diligence
Listing remarks MLS
Fall in love and move right in. Embrace living in a Metro park like setting with all the ease of Suburbia living. Breath Taking! Fresh New Landscaping Just for You. This home has been completely redone! Fresh Carpet though out! Gorgeous Laminate wood flooring. Beautiful Granite countertops! Gleaming appliances. Updated Electrical. Fresh paint great décor. Huge Walk-out Family room new carpet 3 season room with nature stone flooring and new storm door leading out to the patio and beautiful metro park like surroundings! Truly a Master Suite with Full Bath and tons of storage and 5 closets, Additional vanity w sink outside of the Master Bath. Close to All the Area has to offer; Pool, I 271, Medical, Shopping, Library, Schools and Metro Park.
Key facts
- Gas fireplace
- Eat-in kitchen
- Granite counters
Tags
Neighborhood map
What this means for you Summary
Snapshot
- This is a 3-bed/2.5-bath single-family listed at $399k.
Deal economics
- At list price, monthly cash flow is $2k ($22k/yr) — positive.
- The deal already cash-flows at list — no discount required.
- Meets the 1% rule at list price ($6k rent vs $399k).
Location & tenants
- Location reads 80/100 on livability (#115 in OH, #1,710 nationally) — a professional / high-income tenant draw. Strengths: schools A+, crime A+, employment A+; Watch: amenities F, commute F.
- Mayfield City (suburban): math 56% / reading 71% proficiency, ranked #225 of 656 in OH (top 34%) — acceptable for families but not a draw, mixed tenant base, ~2y average lease; only 18% free/reduced lunch — higher-income household profile.
- Market conditions: 24 active listings in the ZIP; 1 comparable units currently listed for rent nearby; high-income renter base; 1,441 units permitted in Cuyahoga County in 2024 (700 in 5+ unit buildings).
- This rent runs 43% of the median local income ($167k/yr) — at the standard rent-burdened threshold; future hikes will face affordability resistance.
Forward outlook
- Local home prices are declining (-1.9%/yr); year-one equity from $3k of loan paydown is wiped out by about $8k of value loss. Plan a longer hold.
- Cuyahoga County population projected to shrink 8% by 2050 — rents likely to lag national; underwrite the cash flow, not the appreciation.
- At projected returns (-1.9% appreciation + 3.0% rent growth), your $112k cash investment doubles in ~6 years — after that, you're playing with house money.
Negotiation context
- Only 8 days on market — expect competitive offers; lowballing is unlikely to land.
- 6 sale attempts since 19y ago with the ask held roughly flat each time — persistent listings suggest the price (not the market) is what's stuck; bring a comps-based counter.
- Current owner paid $263k; list at $399k implies a 52% gain — meaningful room to come down on a strong offer.
Questions for the listing agent
- Built in 1960 — when were the roof, HVAC, electrical panel, plumbing, and water heater last replaced?
- Is there a deadline driving the sale (1031 exchange, divorce, estate, relocation)? That informs how much negotiation room exists.
- Schools are A-rated — typically a magnet for longer-tenancy family renters. What's the average tenant stay here, and is there a school-zone premium baked into asking?
- What's the average days-on-market for RENTAL listings here right now (not sales)? A rising rental-DOM trend means longer vacancies and softer asking-rent achievability than the comps imply.
- What's the recent tenant-quality profile in this submarket — average credit score on applications, eviction rate, late-payment / NSF rate, and stable-employment percentage? A property-management company in the area should have these aggregated.
- How much new for-sale + rental construction is in the pipeline within 1–3 miles? Heavy new supply typically softens prices + rents 12–24 months out; constrained supply supports both.
Investment metrics
- 1% rule
- 1.49% ✓
- Cap rate
- 11.89%
- Cash-on-cash
- 19.99%
- DSCR
- 1.89
- GRM
- 5.6
CMA / ARV
- ARV (on-the-fly)
- $487,432
- Comps found
- 8
Show comp detail 8 sales within ~0.75 mi
| Address | Dist | Beds/Ba | Sqft | Sold | Price | $/sf | Match |
|---|---|---|---|---|---|---|---|
| 6708 Thornapple Dr | 0.29mi | 3/2.5 | 2,500 (-2%) | 16mo | $360,000 | $144 | 70 |
| 6848 Deepwood Ln | 0.36mi | 3/2.5 | 2,778 (+9%) | 6mo | $585,000 | $211 | 63 |
| 754 Oakwood Dr | 0.19mi | 4/2.0 (+1) | 2,838 (+11%) | 5mo | $410,000 | $144 | 61 |
| 6766 Wilson Mills Rd | 0.42mi | 4/3.0 (+1) | 2,732 (+7%) | 2mo | $576,000 | $211 | 60 |
| 734 Oakwood Dr | 0.13mi | 3/2.0 | 2,228 (-13%) | 14mo | $425,500 | $191 | 59 |
| 6698 Wildwood Trl | 0.75mi | 4/3.5 (+1) | 2,504 (-2%) | 3mo | $522,000 | $208 | 51 |
| 6775 Glenview Rd | 0.54mi | 4/2.5 (+1) | 2,757 (+8%) | 11mo | $358,700 | $130 | 47 |
| 6708 Seneca Rd | 0.55mi | 3/3.5 | 2,224 (-13%) | 5mo | $345,000 | $155 | 45 |
Match score weights: distance 35% · size 25% · config 20% · recency 20%. Top-matched comps best support the ARV.
Projected returns pro-forma
-1.91% appreciation · 3.0% rent growth · sell at horizon
- IRR
- 15.1%
- Equity multiple
- 1.65×
- Total profit
- $72,526
- Equity at exit
- $79,212
- IRR
- 22.2%
- Equity multiple
- 3.08×
- Total profit
- $232,930
- Equity at exit
- $69,341
Cash invested: $111,720 (down + closing). Projections, not guarantees.
Landlord ↔ Tenant lean methodology
- Overall (STATE)
- 73 Landlord-Friendly
- State Ohio
- 73 Landlord-Friendly · R+6
- County
- — inherits STATE
- City
- — inherits STATE
ZIP-level market 44040
- Home prices YoY
- -1.0%
- Active inventory
- 24
- Price-to-rent
- 5.6×
Monthly cashflow live
- Estimated rent
- $5,950 medium interval (Pro) →
- Mortgage (P&I)
- −$2,092
- Tax from tax record
- −$581 /mo · $6,975/yr
- Insurance
- −$166
- HOA
- −$0
- Vacancy / Maint / Mgmt
- −$1,250
- Net cashflow
- $1,861
Break-even live
Sensitivity live
| Price | -10% $2,086 | -5% $1,974 | +0% $1,861 | +5% $1,748 | +10% $1,635 |
|---|---|---|---|---|---|
| Rent | -10% $1,391 | -5% $1,626 | +0% $1,861 | +5% $2,096 | +10% $2,331 |
| Rate | -1.0pp $2,062 | -0.5pp $1,962 | base $1,861 | +0.5pp $1,757 | +1.0pp $1,652 |
UW: 25.0% down · 7.5% · 30yr · 1.5% tax · 5.0% vac · 8.0% maint · 8.0% mgmt
Financing live
Cash to close
- Down payment
- $99,750
- Closing costs
- $11,970
- Reserves months
- —
- Total cash needed
- —
Loan-product check · same deal, 3 products live
Conventional
25% down · 7.5% · 30yr
- Down + closing
- —
- Monthly P&I
- —
- Monthly cashflow
- —
- DSCR
- —
- Eligible?
- —
Personal DTI + credit; lowest rate.
DSCR
20% down · 8.5% · 30yr
- Down + closing
- —
- Monthly P&I
- —
- Monthly cashflow
- —
- DSCR
- —
- Eligible?
- —
No personal income docs; deal must DSCR.
Hard money
10% down · 12.0% · 12mo
- Down + closing
- —
- Monthly P&I
- —
- Monthly cashflow
- —
- DSCR
- —
- Eligible?
- —
Short-term bridge; refi at stabilization.
Rent comps 1 comps
| Address | Beds | Baths | Sqft | Rent | $/sqft | DOM | Units | Dist |
|---|---|---|---|---|---|---|---|---|
| 6933 Gates Rd Gates Mills, OH | 4.0 | 4.5 | 3211 | $5,950 | $1.85 | 2d | 1 | 1.45mi |
Listing history 8 events
-
2026-06-18price $399,000 Active 8 DOM
-
2026-06-18days on market $419,900 Active 8 DOM
-
2026-06-17days on market $419,900 Active 7 DOM
-
2026-06-16days on market $419,900 Active 6 DOM
-
2026-06-15days on market $419,900 Active 5 DOM
-
2026-06-13days on market $419,900 Active 3 DOM
-
2026-06-13remarks 699-char remark
-
2026-06-13$419,900 Active 2 DOM
ⓘ Source: listings_history table (triggers on properties + properties_extension) + one-shot
backfill from property_details.listing_events for pre-trigger history.
Tax reassessment forecast OH · Partial reset (capped growth)
- Current annual tax
- $6,975 · $581/mo
- Projected year-2 tax
- $6,975 · $581/mo
- Expected delta
- $0/yr ($0/mo · 0.0%)
ⓘ Screening estimate from a state-policy table — verify with the county assessor before closing.
Climate risk First Street
- Flood 1/10 Low FEMA zone X (unshaded) · 0% chance over 30 yrs
- Wildfire 3/10 Moderate
- Heat 2/10 Low 7 d/yr ≥94°F today · 17 d/yr by 30 yrs out
- Wind 1/10 Low
- Air quality 3/10 Moderate 3 unhealthy d/yr today · 4 by 30 yrs out
Nearby sold comps map
Loading sold comps map…
Walkable amenities ~0.75 mi
Loading nearby amenities…
Taxation est. · year 1
- Rental income
- $71,400
- − Mortgage interest
- −$22,350
- − Property taxes
- −$6,975
- − Insurance
- −$1,995
- − Repairs & maintenance
- −$5,712
- − Management
- −$5,712
- − Depreciation
- −$11,607
- Taxable income
- $17,049
- Est. tax owed @ 24.0%
- −$4,092
- After-tax cash flow
- $18,236/yr
For passive investors: Depreciation is non-cash, so a rental often shows a tax loss while cash-flowing — sheltering income. Rental losses are passive: they offset passive income freely, and up to $25,000/yr can offset ordinary (W-2) income if you actively participate and your MAGI is under $100k (phasing out to $0 by $150k); unused losses carry forward. On sale, claimed depreciation is recaptured at up to 25%, and gains may owe capital-gains tax (a 1031 exchange can defer both). Figures are a year-1 estimate at your 24.0% rate — not tax advice; consult a CPA.
Schools (NCES district)
- District
- Mayfield City
- NCES district ID
- 3904437
- Math proficiency
- 56% ▼ -16.00%
- Reading proficiency
- 71% ▼ -6.00%
- Median HH income
- $57,965
- Composite
- 54.68/100
- National rank
- #1328
- State rank
- #225 of 656 in OH
Livability — Mayfield
- Score
- 80/100
- State rank
- #115
- US rank
- #1710
Category grades
Schools grade is shown separately in the Schools card above.
Census & demographics
- Census place
- Mayfield, OH
- County
- Cuyahoga · 1,045,444 people
- Metro
- Cleveland, OH
- Population (ZIP)
- 3,032
- Household income
- $166,579
- Rent vs Own
Population outlook (Cuyahoga County) Hauer SSP2
- Today (2025)
- 1,244,621 people
- By 2030
- 1,230,093 · -1.2%
- By 2040
- 1,189,108 · -4.5%
- By 2050
- 1,145,706 · -7.9%
- By 2075
- 1,076,557 · -13.5%
- By 2100
- 978,987 · -21.3%
Race, ethnicity, and origin ACS 2023
- Neighborhood character
- Predominantly White (91%)
- Race & ethnicity
- White 91% Asian 3% Black 2% Two or more races 2% Hispanic / Latino 1%
- Common ancestry
- Serbian 8% Romanian 3% Subsaharan African 2%
- Foreign-born
- 13% · Canada
- Languages at home
- 89% English-only · Russian/Polish/Slavic 3% German/W. Germanic 2% Chinese 1%
Political lean MEDSL · Cuyahoga
- 2024 margin
- Solid D (+31.5) · D 65.4% · R 33.9%
- 2008→2024 swing
- -7.4pp toward R · 2008: 38.9pp · 2024: 31.5pp
- All cycles
- 2024: D+31.5 2020: D+34.1 2016: D+35.0 2012: D+38.7 2008: D+38.9
Not yet ingested
- Civics
- —
Market trends
- HPI YoY
- ▼ -1.91%
- Current HPI
- 190.6551
- Rent YoY
- —
- Metro
- —
- State GDP YoY
- ▲ 1.98%
- F500 in state
- 48
Industry mix (Fortune 500 HQ in OH)
| Industry | F500 HQs | Revenue |
|---|---|---|
| Insurance | 3 | $145B |
|
||
| Industrial Machinery | 3 | $49B |
|
||
| Financial Services | 3 | $24B |
|
||
| Consumer Goods | 2 | $93B |
|
||
| Aerospace / Defense | 2 | $47B |
|
||
| Utilities | 2 | $33B |
|
||
Price history
+223.0% since first listed18 events — show timeline
- 2026-06-10 Listed $419,900 MLSNOW
- 2015-10-09 Sold (MLS) $263,000 MLSNOW
- 2015-09-03 Pending — MLSNOW
- 2015-06-24 Price Changed $269,900 MLSNOW
- 2015-04-29 Price Changed $278,900 MLSNOW
- 2015-03-16 Price Changed $280,000 MLSNOW
- 2015-03-05 Price Changed $285,000 MLSNOW
- 2015-03-04 Listed $295,000 MLSNOW
- 2012-03-09 Sold (MLS) $190,000 MLSNOW
- 2012-01-11 Listed $170,000 MLSNOW
- 2011-05-25 Listing Removed — MLSNOW
- 2010-10-25 Listed $269,900 MLSNOW
- 2009-07-31 Listing Removed — MLSNOW
- 2009-02-13 Listed $275,000 MLSNOW
- 2007-10-31 Listing Removed — MLSNOW
- 2007-08-07 Listed $325,000 MLSNOW
- 1998-06-16 Sold (Public Records) $230,000 Public Records
- 1983-10-13 Sold (Public Records) $130,000 Public Records
Property tax history
+2.8%/yrLatest (2025): $6,975 · +0.0% YoY. Source: county tax records.
Cash-flow waterfall
monthlySold comps — $/sqft
last 12 mo · ≤1 miLoading sold comps…