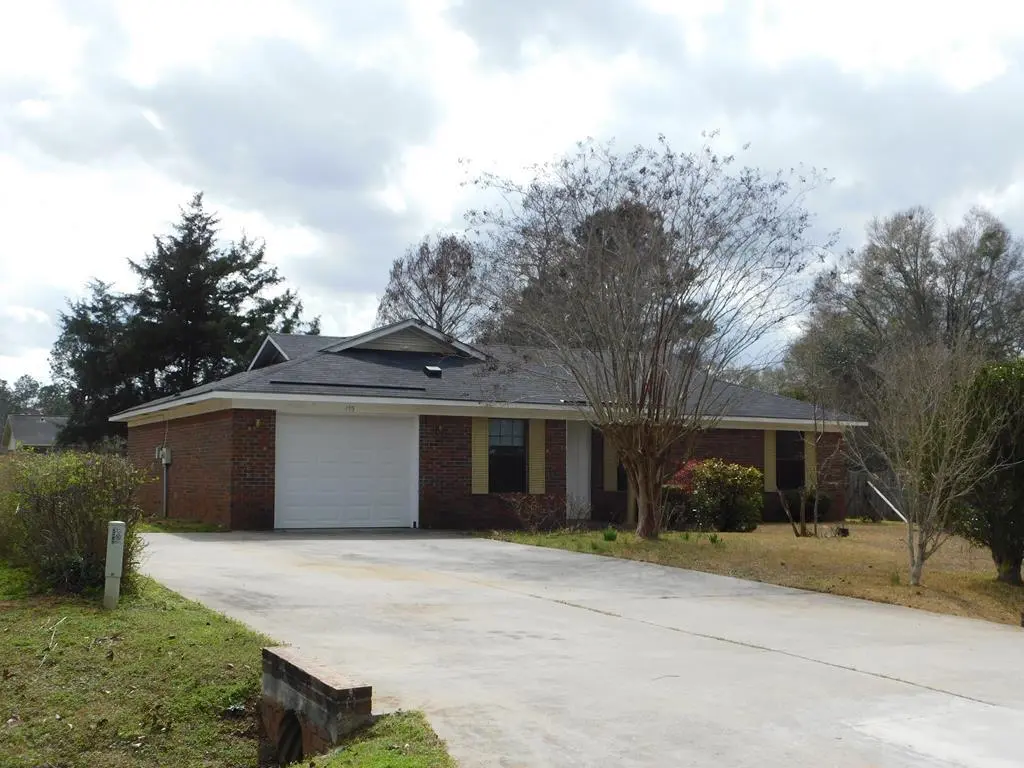
175 Cherokee Ave · Albany, GA
Flood risk 1/10 · Minimal
- FEMA flood zone
- X (unshaded)
- Chance of flooding over 30 yrs
- 0.0%
- Est. flood insurance / yr
- $507 – $1,088
Fire risk 4/10 · Minor
- Est. fire insurance / yr
- $963 – $1,789
Heat risk 8/10 · Major
- Hot days now (above 109°F)
- 7 days/yr
- Hot days in 30 yrs
- 20 days/yr
Wind risk 8/10 · Major
- Chance of severe wind over 30 yrs
- 97.0%
Air-quality risk 4/10 · Minor
- Unhealthy air days now
- 6 days/yr
- Unhealthy air days in 30 yrs
- 6 days/yr
Risk factors via First Street. Map © Google.
Why this score? — see what drove the D+ grade
The composite is a weighted blend of 9 inputs, each scored 0–100. Each bar is that input's sub-score; the figure is the points it added to the 100-point composite (weight × sub-score).
- Cash flow +19.3/30.0
- ARV discount +7.3/15.0
- DSCR +6.1/10.0
- 1% rule +4.4/10.0
- Schools +3.9/10.0
- Rent growth +3.1/5.0
- Livability +3.0/5.0
- Condition / age +2.5/5.0
- Appreciation +0.0/10.0
$183,500
🖨 Deal sheet 📄 Offer letter ✓ Due diligence
Listing remarks
This 4-bedroom, 2 bath home with 1236 sq. ft. is located in West Lee County and sits on . 30 Acre. It offers split bedrooms, a large great room/dining area, an HVAC unit, a single garage with a new garage door & a new opener, + an additional parking pad for extra parking, a new hot water heater a termite repair bond, a stainless smooth top range, a microwave, dishwasher & refrigerator. Enjoy your fenced back yard, a wonderful covered back porch that could easily be screened, and a large, wired shop or wired storage building to fit your needs and store your extra items.
Key facts
- New opener
- Split bedrooms
- Hvac unit
Tags
Property features AI
Exterior
- Parking: 2 parking spaces; Garage with opener
- Security: Smoke detector(s)
- Utilities: Sewer connected
- Home design: Single-family residence; Detached single family; 1 story
- Construction: Brick construction; Shingle roof; Slab foundation; Built on a 0.3-acre lot
- Exterior features: Covered patio/porch; Fenced yard with chain link; Workshop
Interior
- Kitchen: Dishwasher; Refrigerator
- Flooring: Laminate
- Bathrooms: 2 full bathrooms
- Heating & cooling: Electric central heating
- Interior features: Dishwasher; Refrigerator; Smoke detector(s)
- Laundry & utility: Laundry room
Neighborhood map
What this means for you Summary
Snapshot
- This is a 4-bed/2.0-bath single-family listed at $184k.
Deal economics
- At list price, monthly cash flow is $202 ($2k/yr) — positive.
- The deal already cash-flows at list — no discount required.
- To meet the 1% rule (rent ≥ 1% of price), the offer needs to be $173k (5.8% below list).
- Recommended offer: $173k (5.8% below list) — sets the bar for 1% rule.
- Cap rate 7.6% vs local median 4.7% in Albany — top-decile yield for the area; either an underpriced asset or a hidden risk that comps aren't pricing in. Stress-test before assuming the spread holds.
Location & tenants
- Location reads 60/100 on livability (#371 in GA) — a middle-class / working-renter tenant base. Strengths: cost of living A+, housing A-, health & safety B+; Watch: schools F, crime F, amenities F.
- Lee County (rural): math 44% / reading 45% proficiency, ranked #21 of 174 in GA (top 12%) — families likely to look elsewhere, expect single-tenant / working-renter base with shorter leases.
- Market conditions: Rents rising (+2.2%/yr); 203 active listings in the ZIP; 2 comparable units currently listed for rent nearby; solid renter incomes; 133 units permitted in Lee County in 2024 (0 in 5+ unit buildings).
Forward outlook
- Local home prices are declining (-3.0%/yr); year-one equity from $1k of loan paydown is wiped out by about $6k of value loss. Plan a longer hold.
- Lee County population projected at +8% by 2050 — modest demand growth; plan on rents tracking national, not racing it.
Negotiation context
- It's been on market 18 days — a 2% lower offer ($181k) is reasonable based on typical stale-listing flexibility.
- Current owner paid $82k; list at $184k implies a 125% gain — meaningful room to come down on a strong offer.
Risks & watch-outs
- Climate carrying-cost: severe wind risk, 97% chance of damaging wind over 30y; extreme-heat days projected 7→20/yr by 2055 (HVAC capex compounding) — expect insurance premiums to compound above CPI over the hold.
Questions for the listing agent
- Is there a deadline driving the sale (1031 exchange, divorce, estate, relocation)? That informs how much negotiation room exists.
- Schools are F-rated, which usually means shorter tenancies and higher turnover. Who's the typical renter profile here, and what's been the actual vacancy rate?
- Crime grade is F in this area — have there been break-ins, vandalism, or insurance claims at this property in the last 3 years? What carrier currently insures it and at what premium?
- The area grade is low — what's the realistic commute time and amenity access for the typical tenant pool here? Any planned neighborhood developments (good or bad) we should know about?
- What's the average days-on-market for RENTAL listings here right now (not sales)? A rising rental-DOM trend means longer vacancies and softer asking-rent achievability than the comps imply.
- What's the recent tenant-quality profile in this submarket — average credit score on applications, eviction rate, late-payment / NSF rate, and stable-employment percentage? A property-management company in the area should have these aggregated.
- How much new for-sale + rental construction is in the pipeline within 1–3 miles? Heavy new supply typically softens prices + rents 12–24 months out; constrained supply supports both.
Investment metrics
- 1% rule
- 0.94% ✗
- Cap rate
- 7.61%
- Cash-on-cash
- 4.72%
- DSCR
- 1.21
- GRM
- 8.8
CMA / ARV
- ARV (on-the-fly)
- $182,736
- Comps found
- 1
Show comp detail 1 sale within ~0.75 mi
| Address | Dist | Beds/Ba | Sqft | Sold | Price | $/sf | Match |
|---|---|---|---|---|---|---|---|
| 168 Cherokee Ave | 0.04mi | 4/2.0 | 1,300 (+0%) | 12mo | $183,500 | $141 | 87 |
Match score weights: distance 35% · size 25% · config 20% · recency 20%. Top-matched comps best support the ARV.
Projected returns pro-forma
-3.0% appreciation · 2.22% rent growth · sell at horizon
- IRR
- -9.8%
- Equity multiple
- 0.64×
- Total profit
- $-18,258
- Equity at exit
- $27,360
- IRR
- -1.5%
- Equity multiple
- 0.90×
- Total profit
- $-4,931
- Equity at exit
- $15,866
Cash invested: $51,380 (down + closing). Projections, not guarantees.
Landlord ↔ Tenant lean methodology
- Overall (STATE)
- 90 Strongly Landlord-Friendly
- State Georgia
- 90 Strongly Landlord-Friendly · R+3
- County
- — inherits STATE
- City
- — inherits STATE
ZIP-level market 31763
- Home prices YoY
- -15.9%
- Rents YoY
- 2.2%
- Active inventory
- 203
- Price-to-rent
- 8.8×
Monthly cashflow live
- Estimated rent
- $1,729 medium interval (Pro) →
- Mortgage (P&I)
- −$962
- Tax from tax record
- −$125 /mo · $1,504/yr
- Insurance
- −$76
- HOA
- −$0
- Vacancy / Maint / Mgmt
- −$363
- Net cashflow
- $202
Break-even live
UW: 25.0% down · 7.5% · 30yr · 1.5% tax · 5.0% vac · 8.0% maint · 8.0% mgmt
Financing live
Cash to close
- Down payment
- $45,875
- Closing costs
- $5,505
- Reserves months
- —
- Total cash needed
- —
Loan-product check · same deal, 3 products live
Conventional
25% down · 7.5% · 30yr
- Down + closing
- —
- Monthly P&I
- —
- Monthly cashflow
- —
- DSCR
- —
- Eligible?
- —
Personal DTI + credit; lowest rate.
DSCR
20% down · 8.5% · 30yr
- Down + closing
- —
- Monthly P&I
- —
- Monthly cashflow
- —
- DSCR
- —
- Eligible?
- —
No personal income docs; deal must DSCR.
Hard money
10% down · 12.0% · 12mo
- Down + closing
- —
- Monthly P&I
- —
- Monthly cashflow
- —
- DSCR
- —
- Eligible?
- —
Short-term bridge; refi at stabilization.
Rent comps 2 comps
| Address | Beds | Baths | Sqft | Rent | $/sqft | DOM | Units | Dist |
|---|---|---|---|---|---|---|---|---|
| 166 Pelham Dr Leesburg, GA | 3.0 | 2.0 | 1230 | $1,025 | $0.83 | 20d | 1 | 1.23mi |
| 107 Winding Way Unit 107 D WW Leesburg, GA | 3.0 | 2.0 | 1152 | $1,000 | $0.87 | 20d | 1 | 1.38mi |
Listing history 15 events
-
2026-06-19days on market $183,500 Active 18 DOM
-
2026-06-18days on market $183,500 Active 17 DOM
-
2026-06-17days on market $183,500 Active 16 DOM
-
2026-06-16days on market $183,500 Active 15 DOM
-
2026-06-15days on market $183,500 Active 14 DOM
-
2026-06-14days on market $183,500 Active 12 DOM
-
2026-06-13pricedays on market $183,500 Active 11 DOM
-
2026-06-10days on market $188,500 Active 9 DOM
-
2026-06-09days on market $188,500 Active 8 DOM
-
2026-06-08days on market $188,500 Active 7 DOM
-
2026-06-07days on market $188,500 Active 6 DOM
-
2026-06-05days on market $188,500 Active 3 DOM
-
2026-06-03days on market $188,500 Active 2 DOM
-
2026-06-02remarks 579-char remark
-
2026-06-02$188,500 Active 1 DOM
ⓘ Source: listings_history table (triggers on properties + properties_extension) + one-shot
backfill from property_details.listing_events for pre-trigger history.
Tax reassessment forecast GA · Resets to sale price
- Current annual tax
- $1,504 · $125/mo
- Projected year-2 tax
- $1,688 · $141/mo
- Expected delta
- +$184/yr (+$15/mo · 12.2%)
ⓘ Screening estimate from a state-policy table — verify with the county assessor before closing.
Climate risk First Street
- Flood 1/10 Low FEMA zone X (unshaded) · 0% chance over 30 yrs
- Wildfire 4/10 Moderate
- Heat 8/10 Severe 7 d/yr ≥109°F today · 20 d/yr by 30 yrs out
- Wind 8/10 Severe 97% chance of damaging wind over 30 yrs
- Air quality 4/10 Moderate 6 unhealthy d/yr today · 6 by 30 yrs out
Nearby sold comps map
Loading sold comps map…
Walkable amenities ~0.75 mi
Loading nearby amenities…
Taxation est. · year 1
- Rental income
- $20,750
- − Mortgage interest
- −$10,279
- − Property taxes
- −$1,504
- − Insurance
- −$918
- − Repairs & maintenance
- −$1,660
- − Management
- −$1,660
- − Depreciation
- −$5,338
- Taxable loss
- −$609
- Est. tax savings @ 24.0%
- +$146
- After-tax cash flow
- $2,569/yr
For passive investors: Depreciation is non-cash, so a rental often shows a tax loss while cash-flowing — sheltering income. Rental losses are passive: they offset passive income freely, and up to $25,000/yr can offset ordinary (W-2) income if you actively participate and your MAGI is under $100k (phasing out to $0 by $150k); unused losses carry forward. On sale, claimed depreciation is recaptured at up to 25%, and gains may owe capital-gains tax (a 1031 exchange can defer both). Figures are a year-1 estimate at your 24.0% rate — not tax advice; consult a CPA.
Schools (NCES district)
- District
- Lee County
- NCES district ID
- 1303270
- Math proficiency
- 44% ▼ -12.00%
- Reading proficiency
- 45% ▼ -10.00%
- Median HH income
- $60,449
- Composite
- 39.23/100
- National rank
- #4009
- State rank
- #21 of 174 in GA
Livability — Albany
- Score
- 60/100
- State rank
- #371
- US rank
- #18903
Category grades
Schools grade is shown separately in the Schools card above.
Census & demographics
- County
- Lee County · 29,271 people
- City population
- 89,040
- Metro
- Albany, GA
- Population (ZIP)
- 29,271
- Household income
- $88,312
- Rent vs Own
- Severe rent burden
- 700.0
Population outlook (Lee County) Hauer SSP2
- Today (2025)
- 31,140 people
- By 2030
- 31,753 · +2.0%
- By 2040
- 32,710 · +5.0%
- By 2050
- 33,476 · +7.5%
- By 2075
- 35,113 · +12.8%
- By 2100
- 34,821 · +11.8%
Race, ethnicity, and origin ACS 2023
- Neighborhood character
- Predominantly White (66%)
- Race & ethnicity
- White 66% Black 24% Two or more races 6% Hispanic / Latino 3% Asian 2%
- Common ancestry
- Slovak 2% Italian 2% Serbian 2%
- Foreign-born
- 5% · Canada, South Korea
- Languages at home
- 95% English-only · Spanish 2% Korean 1% Other Indo-European 1%
Political lean MEDSL · Lee
- 2024 margin
- Solid R (+43.5) · D 28.0% · R 71.6%
- 2008→2024 swing
- +8.6pp toward D · 2008: -52.1pp · 2024: -43.5pp
- All cycles
- 2024: R+43.5 2020: R+44.6 2016: R+53.0 2012: R+52.4 2008: R+52.1
Not yet ingested
- Civics
- —
Market trends
- HPI YoY
- ▼ -35.33%
- Current HPI
- 187.3672
- Rent YoY
- ▲ 2.22%
- Metro
- Albany, GA
- State GDP YoY
- ▲ 2.66%
- F500 in state
- 28
Industry mix (Fortune 500 HQ in GA)
| Industry | F500 HQs | Revenue |
|---|---|---|
| Paper / Packaging | 2 | $29B |
|
||
| Retail | 1 | $160B |
|
||
| Transportation / Logistics | 1 | $91B |
|
||
| Airlines | 1 | $62B |
|
||
| Consumer Goods | 1 | $47B |
|
||
| Utilities | 1 | $25B |
|
||
Price history
+131.3% since first listed2 events — show timeline
- 2026-06-01 Listed $188,500 SWGABOR
- 2023-11-22 Sold (Public Records) $81,500 Public Records
Property tax history
+5.2%/yrLatest (2025): $1,504 · +33.8% YoY. Source: county tax records.
Cash-flow waterfall
monthlySold comps — $/sqft
last 12 mo · ≤1 miLoading sold comps…