 🌊 Lakefront
None · Salem, PA
Flood risk No data
- FEMA flood zone
- —
- Chance of flooding over 30 yrs
- —
- Est. flood insurance / yr
- —
Fire risk No data
- Est. fire insurance / yr
- —
Heat risk No data
- Hot days now (above threshold)
- —
- Hot days in 30 yrs
- —
Wind risk No data
- Chance of severe wind over 30 yrs
- —
Air-quality risk No data
- Unhealthy air days now
- —
- Unhealthy air days in 30 yrs
- —
Risk factors via First Street. Map © Google.
Why this score? — see what drove the F grade
The composite is a weighted blend of 9 inputs, each scored 0–100. Each bar is that input's sub-score; the figure is the points it added to the 100-point composite (weight × sub-score).
- Appreciation +10.0/10.0
- Cash flow +6.0/30.0
- Schools +4.4/10.0
- Rent growth +2.5/5.0
- Livability +2.5/5.0
- Condition / age +2.5/5.0
- 1% rule +2.1/10.0
- ARV discount +1.4/15.0
- DSCR +0.4/10.0
$325,000
🖨 Deal sheet 📄 Offer letter ✓ Due diligence
Listing remarks MLS
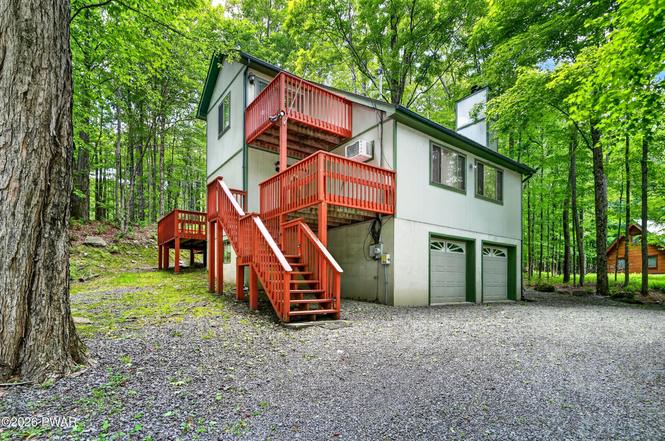
It's your time! Pamper yourself in this great home with master suite encompassing the second floor. Here you will enjoy an oversize bedroom with your own private balcony for your morning coffee, a bath ensuite with a soothing jetted tub, separate shower, and an awesome sauna for pure relaxation. On the main floor you will find a modern kitchen, sunroom, two more decks, a bright living room, bedroom and a bath. The lower level will give your guests privacy with a bedroom, bath, and family room. You will have a circular drive and a two car garage. No need to worry about the big ticket items like a roof as this roof is only three years old and the water heater is also new. All this in the full amenity community of The Hideout which offers golf, skiing, lakes, pools, tennis, clubhouse, lodge fitness center, security, central sewer and water, and so much more. There is something to do all year round making it perfect for either full time living or as your secret getaway.
Key facts
- Office space
- Rear grilling deck
- Private bath
Tags
Property features AI
Finance
- Other: Located in The Hideout community; directions: From Entrance of The Hideout take Lakeview Dr for 0.5 miles, home on the left
- HOA & community: Homeowners association with annual fee (approximately $2,400 / $200 monthly); Community amenities include clubhouse, pool, tennis and sport courts, basketball court, fitness center, playground, picnic area, party room, restaurant, golf, marina/boat access (powered boats allowed), fishing, trash and water services, recreation facilities, and gated entry
Exterior
- Parking: 2-car garage; Basement access and gravel parking
- Security: Community security (gated community)
- Utilities: Public sewer
- Home design: Single-family residence; Updated/remodeled condition; Two levels
- Construction: Asphalt roof
- Exterior features: Deck; Wooded lot with many trees; View of Roamingwood Lake; Private maintained road, asphalt surface
Interior
- Kitchen: Dishwasher; Refrigerator; Microwave; Electric range
- Bedrooms: Total of 6 rooms (bedrooms not individually listed)
- Flooring: Carpet; Tile
- Bathrooms: 3 full bathrooms
- Heating & cooling: Baseboard heating; Electric heating; Fireplace(s); Ceiling fan cooling
- Interior features: Cathedral ceilings; Ceiling fans; Daylight, full basement with interior and exterior entry
- Laundry & utility: Stacked washer/dryer; Laundry closet
Neighborhood map
What this means for you Summary
Snapshot
- This is a 3-bed/3.0-bath single-family listed at $325k.
Deal economics
- At list price, monthly cash flow is $-616 ($-7k/yr) — negative.
- To cash-flow at today's rent, offer at most $236k (27.4% below list).
- To meet the 1% rule (rent ≥ 1% of price), the offer needs to be $232k (28.7% below list).
- Recommended offer: $232k (28.7% below list) — sets the bar for 1% rule.
Location & tenants
- Location reads: area grade F — affects rentability + tenant quality, not the cash-flow math above.
- Western Wayne SD (rural): math 39% / reading 63% proficiency, ranked #165 of 539 in PA (top 31%) — acceptable for families but not a draw, mixed tenant base, ~2y average lease.
- Market conditions: 337 active listings in the ZIP; 177 units permitted in Wayne County in 2024 (0 in 5+ unit buildings).
Forward outlook
- In year one you build about $35k of equity ($2k loan paydown + $32k appreciation (10.0% local appreciation)).
- Wayne County population projected at -17% by 2050 — secular population decline; favor cash flow + early exit over multi-decade hold.
- By year 2, paydown + projected appreciation supports a ~$56k cash-out refi (75% LTV) — recoverable capital for the next deal without selling this one.
Negotiation context
- Only 1 days on market — expect competitive offers; lowballing is unlikely to land.
- 3 sale attempts since 5y ago with the ask held roughly flat each time — persistent listings suggest the price (not the market) is what's stuck; bring a comps-based counter.
- Current owner paid $244k; 33% above their basis — modest negotiation headroom, anchor on the comps not their cost.
Questions for the listing agent
- What do current leases actually rent for vs. the listed asking? Can we see a recent rent roll and the last 12 months of T-12 income?
- What does the HOA fee cover, when was the last increase, and are there any pending special assessments or reserve-fund shortfalls?
- Is there a deadline driving the sale (1031 exchange, divorce, estate, relocation)? That informs how much negotiation room exists.
- The area grade is low — what's the realistic commute time and amenity access for the typical tenant pool here? Any planned neighborhood developments (good or bad) we should know about?
- This sits on a lake — are riparian / water-frontage rights deeded with the parcel? Any dock permits, shoreline easements, or HOA water-use restrictions?
- What's the documented flood / surge / shoreline-erosion history here (FEMA AND non-FEMA — e.g., storm surge, creek backup, septic-field saturation)?
- Any water-quality or seasonal algae-bloom issues that affect tenant satisfaction or short-term-rental demand?
- What's the average days-on-market for RENTAL listings here right now (not sales)? A rising rental-DOM trend means longer vacancies and softer asking-rent achievability than the comps imply.
- What's the recent tenant-quality profile in this submarket — average credit score on applications, eviction rate, late-payment / NSF rate, and stable-employment percentage? A property-management company in the area should have these aggregated.
- How much new for-sale + rental construction is in the pipeline within 1–3 miles? Heavy new supply typically softens prices + rents 12–24 months out; constrained supply supports both.
Investment metrics
- 1% rule
- 0.71% ✗
- Cap rate
- 4.02%
- Cash-on-cash
- -8.12%
- DSCR
- 0.64
- GRM
- 11.7
CMA / ARV
- ARV (on-the-fly)
- $286,208
- Comps found
- 10
Show comp detail 10 sales within ~0.75 mi
| Address | Dist | Beds/Ba | Sqft | Sold | Price | $/sf | Match |
|---|---|---|---|---|---|---|---|
| 6 Greenview Court Ct | 0.37mi | 3/2.0 | 1,593 (-4%) | 9mo | $315,000 | $198 | 64 |
| 12 Parkwood Dr Lot 429 | 0.39mi | 3/2.0 | 1,547 (-7%) | 4mo | $370,000 | $239 | 63 |
| 582 Lakeview Dr W | 0.67mi | 3/3.0 | 1,692 (+2%) | 9mo | $275,000 | $163 | 59 |
| 445 Lakewood Dr | 0.51mi | 3/1.5 | 1,512 (-9%) | 1mo | $250,000 | $165 | 54 |
| 145 Lakeview Dr W | 0.64mi | 3/2.0 | 1,806 (+8%) | 4mo | $310,000 | $172 | 49 |
| 470 Oakwood Ct | 0.57mi | 4/2.0 (+1) | 1,536 (-8%) | 8mo | $290,000 | $189 | 45 |
| 70 Lakewood Dr | 0.58mi | 4/2.0 (+1) | 1,800 (+8%) | 10mo | $280,000 | $156 | 42 |
| 24 Lakewood Dr | 0.53mi | 4/2.0 (+1) | 1,900 (+14%) | 5mo | $240,000 | $126 | 39 |
| 123 Ridgewood Cir | 0.74mi | 3/2.0 | 1,514 (-9%) | 19mo | $210,000 | $139 | 30 |
| 1555 Ledgedale Rd | 0.53mi | 3/2.5 | 1,908 (+15%) | 23mo | $382,000 | $200 | 30 |
Match score weights: distance 35% · size 25% · config 20% · recency 20%. Top-matched comps best support the ARV.
Projected returns pro-forma
10.0% appreciation · 3.0% rent growth · sell at horizon
- IRR
- 18.6%
- Equity multiple
- 2.52×
- Total profit
- $137,958
- Equity at exit
- $292,786
- IRR
- 17.3%
- Equity multiple
- 5.81×
- Total profit
- $437,407
- Equity at exit
- $631,404
Cash invested: $91,000 (down + closing). Projections, not guarantees.
Landlord ↔ Tenant lean methodology
- Overall (STATE)
- 62 Landlord-Friendly
- State Pennsylvania
- 62 Landlord-Friendly · EVEN
- County
- — inherits STATE
- City
- — inherits STATE
ZIP-level market 18436
- Home prices YoY
- 16.9%
- Active inventory
- 337
- Price-to-rent
- 11.7×
Monthly cashflow live
- Estimated rent
- $2,317 medium interval (Pro) →
- Mortgage (P&I)
- −$1,704
- Tax est. 1.5%
- −$406 /mo · $4,875/yr
- Insurance
- −$135
- HOA
- −$200
- Vacancy / Maint / Mgmt
- −$487
- Net cashflow
- $-616
Break-even live
UW: 25.0% down · 7.5% · 30yr · 1.5% tax · 5.0% vac · 8.0% maint · 8.0% mgmt
Financing live
Cash to close
- Down payment
- $81,250
- Closing costs
- $9,750
- Reserves months
- —
- Total cash needed
- —
Loan-product check · same deal, 3 products live
Conventional
25% down · 7.5% · 30yr
- Down + closing
- —
- Monthly P&I
- —
- Monthly cashflow
- —
- DSCR
- —
- Eligible?
- —
Personal DTI + credit; lowest rate.
DSCR
20% down · 8.5% · 30yr
- Down + closing
- —
- Monthly P&I
- —
- Monthly cashflow
- —
- DSCR
- —
- Eligible?
- —
No personal income docs; deal must DSCR.
Hard money
10% down · 12.0% · 12mo
- Down + closing
- —
- Monthly P&I
- —
- Monthly cashflow
- —
- DSCR
- —
- Eligible?
- —
Short-term bridge; refi at stabilization.
HOA detail
- Monthly dues
- $200 · $2,400/yr
- Likely covers
- watersewerpoolgymsecurity
Listing history 2 events
-
2026-06-17remarks 699-char remark
-
2026-06-17$325,000 Active 1 DOM
ⓘ Source: listings_history table (triggers on properties + properties_extension) + one-shot
backfill from property_details.listing_events for pre-trigger history.
Nearby sold comps map
Loading sold comps map…
Walkable amenities ~0.75 mi
Loading nearby amenities…
Taxation est. · year 1
- Rental income
- $27,805
- − Mortgage interest
- −$18,205
- − Property taxes
- −$4,875
- − Insurance
- −$1,625
- − Repairs & maintenance
- −$2,224
- − Management
- −$2,224
- − HOA
- −$2,400
- − Depreciation
- −$9,455
- Taxable loss
- −$13,204
- Est. tax savings @ 24.0%
- +$3,169
- After-tax cash flow
- $-4,217/yr
For passive investors: Depreciation is non-cash, so a rental often shows a tax loss while cash-flowing — sheltering income. Rental losses are passive: they offset passive income freely, and up to $25,000/yr can offset ordinary (W-2) income if you actively participate and your MAGI is under $100k (phasing out to $0 by $150k); unused losses carry forward. On sale, claimed depreciation is recaptured at up to 25%, and gains may owe capital-gains tax (a 1031 exchange can defer both). Figures are a year-1 estimate at your 24.0% rate — not tax advice; consult a CPA.
Schools (NCES district)
- District
- Western Wayne SD
- NCES district ID
- 4226070
- Math proficiency
- 39% ▼ -12.00%
- Reading proficiency
- 63% ▼ -6.00%
- Median HH income
- $51,358
- Composite
- 43.65/100
- National rank
- #2964
- State rank
- #165 of 539 in PA
Livability — Salem
No livability data for this city. (Only ~50 U.S. cities are tracked.)
Census & demographics
- Census place
- The Hideout, PA
- Population (ZIP)
- 13,225
Population outlook (Wayne County) Hauer SSP2
- Today (2025)
- 47,924 people
- By 2030
- 46,191 · -3.6%
- By 2040
- 42,815 · -10.7%
- By 2050
- 39,873 · -16.8%
- By 2075
- 34,556 · -27.9%
- By 2100
- 28,358 · -40.8%
Race, ethnicity, and origin ACS 2023
- Neighborhood character
- Predominantly White (95%)
- Race & ethnicity
- White 95% Two or more races 3% Hispanic / Latino 2%
- Common ancestry
- Romanian 9% Scotch-Irish 2% Iranian 2%
- Foreign-born
- 4%
- Languages at home
- 95% English-only · French/Haitian/Cajun 2% Russian/Polish/Slavic 1% Spanish 1%
Political lean MEDSL · Wayne
- 2024 margin
- Solid R (+37.1) · D 31.1% · R 68.2%
- 2008→2024 swing
- -24.8pp toward R · 2008: -12.3pp · 2024: -37.1pp
- All cycles
- 2024: R+37.1 2020: R+33.6 2016: R+39.7 2012: R+20.9 2008: R+12.3
Not yet ingested
- Civics
- —
Market trends
- HPI YoY
- ▲ 47.95%
- Current HPI
- 331.9645
- Rent YoY
- —
- Metro
- —
- State GDP YoY
- ▲ 1.68%
- F500 in state
- 34
Industry mix (Fortune 500 HQ in PA)
| Industry | F500 HQs | Revenue |
|---|---|---|
| Healthcare | 2 | $309B |
|
||
| Insurance | 2 | $27B |
|
||
| Telecommunications / Media | 1 | $124B |
|
||
| Industrial Distribution | 1 | $22B |
|
||
| Financial Services | 1 | $20B |
|
||
| Chemicals / Materials | 1 | $18B |
|
||
Price history
+25.5% since first listed5 events — show timeline
- 2026-06-17 Listed $325,000 PWMLS
- 2021-12-20 Sold (MLS) $244,000 PWMLS
- 2021-12-20 Sold (MLS) — PWMLS
- 2021-07-31 Listed $259,000 PWMLS
- 2021-07-31 Listed $259,000 PWMLS
Cash-flow waterfall
monthlySold comps — $/sqft
last 12 mo · ≤1 miLoading sold comps…