 Fourplex
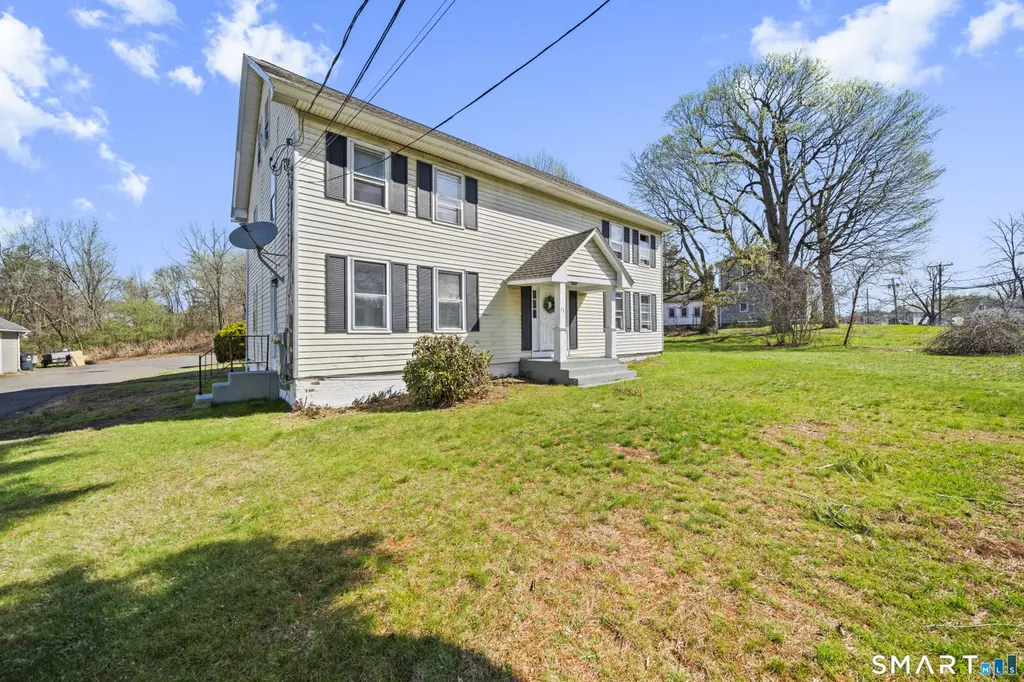
73 Main St · Hazardville, CT
Flood risk No data
- FEMA flood zone
- —
- Chance of flooding over 30 yrs
- —
- Est. flood insurance / yr
- —
Fire risk No data
- Est. fire insurance / yr
- —
Heat risk No data
- Hot days now (above threshold)
- —
- Hot days in 30 yrs
- —
Wind risk No data
- Chance of severe wind over 30 yrs
- —
Air-quality risk No data
- Unhealthy air days now
- —
- Unhealthy air days in 30 yrs
- —
Risk factors via First Street. Map © Google.
Why this score? — see what drove the B grade
The composite is a weighted blend of 9 inputs, each scored 0–100. Each bar is that input's sub-score; the figure is the points it added to the 100-point composite (weight × sub-score).
- Cash flow +30.0/30.0
- 1% rule +10.0/10.0
- DSCR +10.0/10.0
- ARV discount +7.5/15.0
- Schools +5.2/10.0
- Livability +3.6/5.0
- Rent growth +2.5/5.0
- Condition / age +2.5/5.0
- Appreciation +0.0/10.0
$500,000
🖨 Deal sheet 📄 Offer letter ✓ Due diligence
Multi-family units
County records classify this as Multi-Family (5+ Unit). Listing-text estimate: 4 units. estimate disagrees with records
5+ unit building — per-unit beds/baths from public records are typically unavailable; the breakdown below (if shown) is an estimate from the listing text.
Listing remarks MLS
Excellent income return for the investor from this 4-family in very good condition.Good location. 2Nd.Fl.Apartments with 3rd.Fl.Bedrooms. Vinyl sided,large yard,newer ext.Stairs and deck. Water assess.Approx.1900.Balance.
Key facts
- Brand new roof
- New carpet
- New flooring
Tags
Neighborhood map
What this means for you Summary
Snapshot
- This is a 4 × 2-bed/1.0-bath units multifamily listed at $500k.
Deal economics
- At list price, monthly cash flow is $3k ($35k/yr) — positive. Per door: $736/mo.
- The deal already cash-flows at list — no discount required.
- Meets the 1% rule at list price ($8k rent vs $500k).
- Cap rate 13.4% vs local median 3.7% in Hazardville — top-decile yield for the area; either an underpriced asset or a hidden risk that comps aren't pricing in. Stress-test before assuming the spread holds.
Location & tenants
- Location reads 72/100 on livability (#82 in CT) — a middle-class / working-renter tenant base. Strengths: employment A+, housing A+, crime A; Watch: amenities F, commute F.
- Somers School District (suburban): math 49% / reading 63% proficiency, ranked #53 of 153 in CT (top 35%) — acceptable for families but not a draw, mixed tenant base, ~2y average lease; only 5% free/reduced lunch — higher-income household profile.
- Zoned schools: Somers Elementary School (math 46% / reading 56%, grade C-, #232 of 553 statewide, top 42%, 649 students, 7% FRL); Somers High School (math 52% / reading 77%, grade B-, #33 of 194 statewide, top 18%, 384 students, 4% FRL) — zoned schools at 6% FRL track the district average.
- Market conditions: 47 active listings in the ZIP; 1,867 units permitted in Capitol Planning Region in 2024 (1,399 in 5+ unit buildings).
Forward outlook
- Local home prices are declining (-3.0%/yr); year-one equity from $3k of loan paydown is wiped out by about $15k of value loss. Plan a longer hold.
- At projected returns (-3.0% appreciation + 3.0% rent growth), your $140k cash investment doubles in ~5 years — after that, you're playing with house money.
Negotiation context
- Only 9 days on market — expect competitive offers; lowballing is unlikely to land.
- 2 sale attempts since 23y ago with the ask held roughly flat each time — persistent listings suggest the price (not the market) is what's stuck; bring a comps-based counter.
- Current owner paid $210k; list at $500k implies a 138% gain — meaningful room to come down on a strong offer.
Risks & watch-outs
- Watch-outs: built in 1900 — expect roof / HVAC / electrical / plumbing capex.
Questions for the listing agent
- Can we see the unit-by-unit rent roll, current vacancy, and any below-market leases? What's the average tenancy length?
- What capital expenditures (roof, boiler, parking lot, exteriors) have been made in the last 5 years, and what's planned in the next 2?
- Built in 1900 — when were the roof, HVAC, electrical panel, plumbing, and water heater last replaced?
- Is there a deadline driving the sale (1031 exchange, divorce, estate, relocation)? That informs how much negotiation room exists.
- What's the average days-on-market for RENTAL listings here right now (not sales)? A rising rental-DOM trend means longer vacancies and softer asking-rent achievability than the comps imply.
- What's the recent tenant-quality profile in this submarket — average credit score on applications, eviction rate, late-payment / NSF rate, and stable-employment percentage? A property-management company in the area should have these aggregated.
- How much new apartment / multifamily construction is in the pipeline within 1–3 miles? Heavy new supply (>2% of stock underway) typically softens rents 12–24 months out; light construction supports rent growth.
Investment metrics
- 1% rule
- 1.55% ✓
- Cap rate
- 13.36%
- Cash-on-cash
- 25.24%
- DSCR
- 2.12
- GRM
- 5.4
CMA / ARV
No comps found within radius.
Projected returns pro-forma
-3.0% appreciation · 3.0% rent growth · sell at horizon
- IRR
- 18.8%
- Equity multiple
- 1.76×
- Total profit
- $106,467
- Equity at exit
- $74,552
- IRR
- 27.1%
- Equity multiple
- 3.39×
- Total profit
- $334,003
- Equity at exit
- $43,231
Cash invested: $140,000 (down + closing). Projections, not guarantees.
Landlord ↔ Tenant lean methodology
- Overall (STATE)
- 27 Tenant-Leaning
- State Connecticut
- 27 Tenant-Leaning · D+7
- County
- — inherits STATE
- City
- — inherits STATE
ZIP-level market 06071
- Active inventory
- 47
- Price-to-rent
- 21.5×
Monthly cashflow live
- Estimated rent
- $7,765 medium interval (Pro) →
- Mortgage (P&I)
- −$2,622
- Tax from tax record
- −$360 /mo · $4,314/yr
- Insurance
- −$208
- HOA
- −$0
- Vacancy / Maint / Mgmt
- −$1,631
- Net cashflow
- $2,944
Break-even live
4-unit breakdown (identical units grouped — click to expand)
| Units | Beds | Baths | Est. rent |
|---|---|---|---|
| 4× units | 2 | 1 | $7,764 |
| #1 | 2 | 1 | $1,941 |
| #2 | 2 | 1 | $1,941 |
| #3 | 2 | 1 | $1,941 |
| #4 | 2 | 1 | $1,941 |
| Total (4 units) | $7,765 | ||
UW: 25.0% down · 7.5% · 30yr · 1.5% tax · 5.0% vac · 8.0% maint · 8.0% mgmt
Financing live
Cash to close
- Down payment
- $125,000
- Closing costs
- $15,000
- Reserves months
- —
- Total cash needed
- —
Loan-product check · same deal, 3 products live
Conventional
25% down · 7.5% · 30yr
- Down + closing
- —
- Monthly P&I
- —
- Monthly cashflow
- —
- DSCR
- —
- Eligible?
- —
Personal DTI + credit; lowest rate.
DSCR
20% down · 8.5% · 30yr
- Down + closing
- —
- Monthly P&I
- —
- Monthly cashflow
- —
- DSCR
- —
- Eligible?
- —
No personal income docs; deal must DSCR.
Hard money
10% down · 12.0% · 12mo
- Down + closing
- —
- Monthly P&I
- —
- Monthly cashflow
- —
- DSCR
- —
- Eligible?
- —
Short-term bridge; refi at stabilization.
Listing history 9 events
-
2026-06-02statusdays on market $500,000 Under Contract 9 DOM
-
2026-06-01days on market $500,000 Active 8 DOM
-
2026-05-31days on market $500,000 Active 7 DOM
-
2026-04-21status Under Contract
-
2026-04-17$500,000 Active
-
2011-12-21soldstatus $210,000
-
2003-12-04soldstatus $218,750
-
2003-12-02soldstatus $216,000 221-char remark
Show marketing remark (221 chars)
Excellent income return for the investor from this 4-family in very good condition.Good location. 2Nd.Fl.Apartments with 3rd.Fl.Bedrooms. Vinyl sided,large yard,newer ext.Stairs and deck. Water assess.Approx.1900.Balance.
-
2003-10-27$218,900 221-char remark
Show marketing remark (221 chars)
Excellent income return for the investor from this 4-family in very good condition.Good location. 2Nd.Fl.Apartments with 3rd.Fl.Bedrooms. Vinyl sided,large yard,newer ext.Stairs and deck. Water assess.Approx.1900.Balance.
ⓘ Source: listings_history table (triggers on properties + properties_extension) + one-shot
backfill from property_details.listing_events for pre-trigger history.
Tax reassessment forecast CT · Partial reset (capped growth)
- Current annual tax
- $4,314 · $360/mo
- Projected year-2 tax
- $7,507 · $626/mo
- Expected delta
- +$3,193/yr (+$266/mo · 74.0%)
ⓘ Screening estimate from a state-policy table — verify with the county assessor before closing.
Nearby sold comps map
Loading sold comps map…
Walkable amenities ~0.75 mi
Loading nearby amenities…
Taxation est. · year 1
- Rental income
- $93,180
- − Mortgage interest
- −$28,008
- − Property taxes
- −$4,314
- − Insurance
- −$2,500
- − Repairs & maintenance
- −$7,454
- − Management
- −$7,454
- − Depreciation
- −$14,545
- Taxable income
- $28,904
- Est. tax owed @ 24.0%
- −$6,937
- After-tax cash flow
- $28,397/yr
For passive investors: Depreciation is non-cash, so a rental often shows a tax loss while cash-flowing — sheltering income. Rental losses are passive: they offset passive income freely, and up to $25,000/yr can offset ordinary (W-2) income if you actively participate and your MAGI is under $100k (phasing out to $0 by $150k); unused losses carry forward. On sale, claimed depreciation is recaptured at up to 25%, and gains may owe capital-gains tax (a 1031 exchange can defer both). Figures are a year-1 estimate at your 24.0% rate — not tax advice; consult a CPA.
Schools (NCES district)
- District
- Somers School District
- NCES district ID
- 0904140
- Math proficiency
- 49% ▼ -3.00%
- Reading proficiency
- 63% ▼ -1.00%
- Median HH income
- $96,412
- Composite
- 52.14/100
- National rank
- #1615
- State rank
- #53 of 153 in CT
Livability — Hazardville
- Score
- 72/100
- State rank
- #82
- US rank
- #6039
Category grades
Schools grade is shown separately in the Schools card above.
Census & demographics
- City population
- 41,100
- Population (ZIP)
- 10,554
Population outlook (Capitol County) Hauer SSP2
- By 2040
- 1,063,519
Race, ethnicity, and origin ACS 2023
- Neighborhood character
- Predominantly White (84%)
- Race & ethnicity
- White 84% Hispanic / Latino 6% Black 4% Two or more races 3%
- Hispanic origin (detail)
- Puerto Rican 2%
- Common ancestry
- Romanian 14% Lithuanian 10% Slovak 3%
- Foreign-born
- 4% · Canada
- Languages at home
- 96% English-only · Spanish 3%
Political lean MEDSL · Capitol
- 2024 margin
- Strong D (+21.9) · D 60.1% · R 38.2% · Other 1.7%
- All cycles
- 2024: D+21.9
Not yet ingested
- Civics
- —
Market trends
- HPI YoY
- ▼ -141.15%
- Current HPI
- 167.3798
- Rent YoY
- —
- Metro
- —
- State GDP YoY
- ▲ 1.06%
- F500 in state
- 38
Industry mix (Fortune 500 HQ in CT)
| Industry | F500 HQs | Revenue |
|---|---|---|
| Industrial Machinery | 4 | $38B |
|
||
| Insurance | 3 | $71B |
|
||
| Financial Services | 2 | $25B |
|
||
| Transportation / Logistics | 2 | $18B |
|
||
| Healthcare | 1 | $247B |
|
||
| Telecommunications | 1 | $55B |
|
||
Price history
+128.4% since first listed6 events — show timeline
- 2026-04-21 Pending — Smart MLS
- 2026-04-17 Listed $500,000 Smart MLS
- 2011-12-21 Sold (Public Records) $210,000 Public Records
- 2003-12-04 Sold (Public Records) $218,750 Public Records
- 2003-12-02 Sold (MLS) $216,000 Smart MLS
- 2003-10-27 Listed $218,900 Smart MLS
Property tax history
+1.1%/yrLatest (2023): $4,314 · +2.7% YoY. Source: county tax records.
Cash-flow waterfall
monthlySold comps — $/sqft
last 12 mo · ≤1 miLoading sold comps…