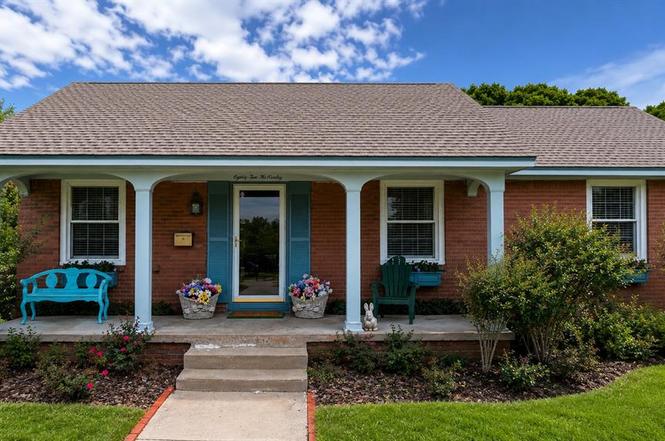
8010 N Mckinley Ave · Oklahoma City, OK
Flood risk 1/10 · Minimal
- FEMA flood zone
- X (unshaded)
- Chance of flooding over 30 yrs
- 0.0%
- Est. flood insurance / yr
- $507 – $1,088
Fire risk 1/10 · Minimal
- Est. fire insurance / yr
- $2,463 – $4,575
Heat risk 6/10 · Moderate
- Hot days now (above 107°F)
- 7 days/yr
- Hot days in 30 yrs
- 18 days/yr
Wind risk 2/10 · Minimal
- Chance of severe wind over 30 yrs
- 2.0%
Air-quality risk 2/10 · Minimal
- Unhealthy air days now
- 2 days/yr
- Unhealthy air days in 30 yrs
- 2 days/yr
Risk factors via First Street. Map © Google.
Why this score? — see what drove the D- grade
The composite is a weighted blend of 9 inputs, each scored 0–100. Each bar is that input's sub-score; the figure is the points it added to the 100-point composite (weight × sub-score).
- Cash flow +15.6/30.0
- DSCR +4.8/10.0
- Livability +4.0/5.0
- Rent growth +3.4/5.0
- 1% rule +2.9/10.0
- Condition / age +2.5/5.0
- ARV discount +1.4/15.0
- Schools +0.7/10.0
- Appreciation +0.0/10.0
$163,800
🖨 Deal sheet (PDF) 📄 Offer letter ✓ Due diligence
Listing remarks
Fully remodeled and move-in ready! This charming 3-bedroom, 1-bath home features a roof, new HVAC system, updated plumbing, new windows, and modern finishes throughout. The spacious layout offers comfortable living with lower maintenance and improved energy efficiency. Conveniently located near shopping, dining, schools, and major highways, providing easy access to all that Oklahoma City has to offer. Whether you're a first-time home-buyer, downsizing, or looking for an investment property, this home offers exceptional value and peace of mind with its extensive updates. Schedule your showing today!
Key facts
- Modern finishes
- New roof
- Spacious layout
Tags
Property features AI
Finance
- Other: Historic designation: yes; Located in Highland View Addition; Lot features: other
- Financial info: Not assumable; Loan qualification unknown; Property is occupied; Active MLS status
- HOA & community: No mandatory association dues
Exterior
- Parking: Detached or attached garage providing 5 garage spaces
- Home design: Single-family residence; Lower level entry (condo-only designation noted); Existing property
- Construction: Frame construction; Composition roof (roof year 1949); Combination foundation
- Exterior features: No notable exterior features; Storm shelter (other)
Interior
- Bedrooms: 3 bedrooms
- Bathrooms: 1 full bathroom
- Heating & cooling: Other heating
- Interior features: No fireplace; Single living area
Neighborhood map
What this means for you Summary
Snapshot
- This is a 3-bed/1.0-bath single-family listed at $164k.
Deal economics
- At list price, monthly cash flow is $70 ($838/yr) — positive.
- The deal already cash-flows at list — no discount required.
- To meet the 1% rule (rent ≥ 1% of price), the offer needs to be $130k (20.7% below list).
- Recommended offer: $130k (20.7% below list) — sets the bar for 1% rule.
- Cap rate 6.8% vs local median 3.7% in Oklahoma City — top-decile yield for the area; either an underpriced asset or a hidden risk that comps aren't pricing in. Stress-test before assuming the spread holds.
Location & tenants
- Location reads 80/100 on livability (#3 in OK, #1,635 nationally) — a professional / high-income tenant draw. Strengths: amenities A+, commute A+, cost of living A+; Watch: crime F.
- Oklahoma City (urban): math 7% / reading 10% proficiency, ranked #254 of 270 in OK (top 94%) — low school quality limits family demand, transient renter base, plan for 1-2y turnover; 82% free/reduced lunch — lower-income household profile, screen leases tightly.
- Zoned schools: Nichols Hills Es (math 17% / reading 17%, grade F, #540 of 845 statewide, top 68%, 494 students, 0% FRL); Classen Ms of Advanced Studies (math 35% / reading 46%, grade F, #6 of 345 statewide, top 1%, 855 students, 0% FRL); John Marshall Hs (math 2% / reading 8%, grade F, #430 of 447 statewide, top 99%, 829 students, 0% FRL) — zoned schools average 0% FRL vs 82% district-wide (82 pts lower); this property's tenant base skews higher-income than the district average.
- Zoned-school proficiency averages 21% at this address vs 8% district-wide (+12 pts) — the actual schools serving this property are materially stronger than the Oklahoma City average implies; a family-tenant draw the district grade alone would hide.
- Market conditions: Rents rising (+3.5%/yr); 150 active listings in the ZIP; 26 comparable units currently listed for rent nearby; rentals at typical pace (median 22d on market — plan ~3-4 weeks tenant-placement turnaround); 5,365 units permitted in Oklahoma County in 2024 (569 in 5+ unit buildings).
Forward outlook
- Local home prices are declining (-3.0%/yr); year-one equity from $1k of loan paydown is wiped out by about $5k of value loss. Plan a longer hold.
- Oklahoma County population projected at +41% by 2050 — long-run rental-demand tailwind backs the buy-and-hold thesis.
Negotiation context
- Only 5 days on market — expect competitive offers; lowballing is unlikely to land.
Risks & watch-outs
- Watch-outs: built in 1949 — expect roof / HVAC / electrical / plumbing capex.
- Climate carrying-cost: extreme-heat days projected 7→18/yr by 2055 (HVAC capex compounding) — expect insurance premiums to compound above CPI over the hold.
Questions for the listing agent
- Built in 1949 — when were the roof, HVAC, electrical panel, plumbing, and water heater last replaced?
- Is there a deadline driving the sale (1031 exchange, divorce, estate, relocation)? That informs how much negotiation room exists.
- Schools are F-rated, which usually means shorter tenancies and higher turnover. Who's the typical renter profile here, and what's been the actual vacancy rate?
- Crime grade is F in this area — have there been break-ins, vandalism, or insurance claims at this property in the last 3 years? What carrier currently insures it and at what premium?
- The area grade is low — what's the realistic commute time and amenity access for the typical tenant pool here? Any planned neighborhood developments (good or bad) we should know about?
- What's the average days-on-market for RENTAL listings here right now (not sales)? A rising rental-DOM trend means longer vacancies and softer asking-rent achievability than the comps imply.
- What's the recent tenant-quality profile in this submarket — average credit score on applications, eviction rate, late-payment / NSF rate, and stable-employment percentage? A property-management company in the area should have these aggregated.
- How much new for-sale + rental construction is in the pipeline within 1–3 miles? Heavy new supply typically softens prices + rents 12–24 months out; constrained supply supports both.
Investment metrics
- 1% rule
- 0.79% ✗
- Cap rate
- 6.80%
- Cash-on-cash
- 1.83%
- DSCR
- 1.08
- GRM
- 10.5
CMA / ARV
- ARV (on-the-fly)
- $144,144
- Comps found
- 9
Show comp detail 9 sales within ~0.75 mi
| Address | Dist | Beds/Ba | Sqft | Sold | Price | $/sf | Match |
|---|---|---|---|---|---|---|---|
| 1221 NW 83rd St | 0.25mi | 3/1.0 | 996 (+6%) | 2mo | $161,000 | $162 | 77 |
| 1310 NW 84th St | 0.26mi | 3/1.0 | 1,024 (+9%) | 1mo | $148,400 | $145 | 72 |
| 904 Westchester Dr | 0.51mi | 3/1.0 | 980 (+5%) | 2mo | $155,000 | $158 | 67 |
| 1223 NW 84th St | 0.30mi | 3/1.0 | 1,037 (+11%) | 12mo | $160,000 | $154 | 58 |
| 728 NW 87th St | 0.75mi | 2/1.0 (-1) | 894 (-4%) | 0mo | $135,000 | $151 | 52 |
| 740 NW 87th St | 0.72mi | 2/2.0 (-1) | 974 (+4%) | 2mo | $160,000 | $164 | 48 |
| 923 Kenilworth Rd | 0.47mi | 2/1.5 (-1) | 1,064 (+14%) | 5mo | $148,500 | $140 | 44 |
| 1512 Andover Ct | 0.72mi | 3/1.0 | 1,020 (+9%) | 14mo | $199,500 | $196 | 40 |
| 1406 Sheffield Rd | 0.73mi | 3/1.0 | 1,070 (+14%) | 10mo | $150,000 | $140 | 34 |
Match score weights: distance 35% · size 25% · config 20% · recency 20%. Top-matched comps best support the ARV.
Projected returns pro-forma
-3.0% appreciation · 3.47% rent growth · sell at horizon
- IRR
- -13.0%
- Equity multiple
- 0.53×
- Total profit
- $-21,565
- Equity at exit
- $24,423
- IRR
- -3.5%
- Equity multiple
- 0.76×
- Total profit
- $-10,854
- Equity at exit
- $14,162
Cash invested: $45,864 (down + closing). Projections, not guarantees.
Landlord ↔ Tenant lean methodology
- Overall (STATE)
- 83 Strongly Landlord-Friendly
- State Oklahoma
- 83 Strongly Landlord-Friendly · R+20
- County
- — inherits STATE
- City
- — inherits STATE
ZIP-level market 73114
- Home prices YoY
- -12.5%
- Rents YoY
- 3.5%
- Active inventory
- 150
- Price-to-rent
- 10.5×
Monthly cashflow live
- Estimated rent
- $1,299 high interval (Pro) →
- Mortgage (P&I)
- −$859
- Tax from tax record
- −$29 /mo · $346/yr
- Insurance
- −$68
- HOA
- −$0
- Vacancy / Maint / Mgmt
- −$273
- Net cashflow
- $70
Break-even live
Sensitivity live
| Price | -10% $163 | -5% $116 | +0% $70 | +5% $23 | +10% $-219 |
|---|---|---|---|---|---|
| Rent | -10% $-33 | -5% $19 | +0% $70 | +5% $121 | +10% $172 |
| Rate | -1.0pp $152 | -0.5pp $112 | base $70 | +0.5pp $27 | +1.0pp $-16 |
UW: 25.0% down · 7.5% · 30yr · 1.5% tax · 5.0% vac · 8.0% maint · 8.0% mgmt
Financing live
Cash to close
- Down payment
- $40,950
- Closing costs
- $4,914
- Reserves months
- —
- Total cash needed
- —
Loan-product check · same deal, 3 products live
Conventional
25% down · 7.5% · 30yr
- Down + closing
- —
- Monthly P&I
- —
- Monthly cashflow
- —
- DSCR
- —
- Eligible?
- —
Personal DTI + credit; lowest rate.
DSCR
20% down · 8.5% · 30yr
- Down + closing
- —
- Monthly P&I
- —
- Monthly cashflow
- —
- DSCR
- —
- Eligible?
- —
No personal income docs; deal must DSCR.
Hard money
10% down · 12.0% · 12mo
- Down + closing
- —
- Monthly P&I
- —
- Monthly cashflow
- —
- DSCR
- —
- Eligible?
- —
Short-term bridge; refi at stabilization.
Rent comps 26 comps
| Address | Beds | Baths | Sqft | Rent | $/sqft | DOM | Units | Dist |
|---|---|---|---|---|---|---|---|---|
| 1214 NW 81st St Oklahoma City, OK | 3.0 | 1.0 | 1100 | $1,350 | $1.23 | 3d | 1 | 0.12mi |
| 1133 NW 84th St Oklahoma City, OK | 3.0 | 1.0 | 884 | $1,150 | $1.30 | 25d | 1 | 0.35mi |
| 1025 NW 86th St Oklahoma City, OK | 2.0 | 1.5 | 1100 | $1,000 | $0.91 | 45d | 1 | 0.59mi |
| 1435 NW 91st St Oklahoma City, OK | 2.0 | 1.5 | 1090 | $1,000 | $0.92 | 45d | 1 | 0.76mi |
| 1434 NW 92nd St Unit 3 Oklahoma City, OK | 2.0 | 1.5 | 950 | $915 | $0.96 | 45d | 1 | 0.78mi |
| 745 NW 89th St Oklahoma City, OK | 3.0 | 1.0 | 1000 | $1,275 | $1.27 | 3d | 1 | 0.81mi |
| 1441 NW 92nd St Oklahoma City, OK | 1.0–2.0 | 1.0 | 725 | $850 | $1.17 | 45d | 1 | 0.81mi |
| 1618 Oxford Way Oklahoma City, OK | 3.0 | 1.0 | 1039 | $1,350 | $1.30 | 25d | 1 | 0.94mi |
| 1425 NW 94th St Oklahoma City, OK | 2.0 | 1.0 | 816 | $795 | $0.97 | 23d | 1 | 0.96mi |
| 1708 Sheffield Rd Oklahoma City, OK | 3.0 | 1.0 | 1057 | $1,400 | $1.32 | 4d | 1 | 0.98mi |
| 1702 W Britton Rd Oklahoma City, OK | 2.0 | 1.0 | 950 | $1,195 | $1.26 | 4d | 1 | 0.98mi |
| 1016 NW 67th St Oklahoma City, OK | 2.0 | 1.0–2.0 | 708 | $2,395 | $3.38 | 3d | 6 | 1.00mi |
| 1417 NW 95th St Oklahoma City, OK | 2.0 | 1.0 | 916 | $1,085 | $1.18 | 25d | 1 | 1.02mi |
| 9111 N Walker Ave Oklahoma City, OK | 3.0 | 1.5 | 1092 | $1,195 | $1.09 | 3d | 1 | 1.07mi |
| 333 NW 90th St Oklahoma City, OK | 3.0 | 1.5 | 1053 | $1,350 | $1.28 | 45d | 1 | 1.20mi |
| 413 W Britton Rd Oklahoma City, OK | 2.0 | 1.0 | 912 | $840 | $0.92 | 22d | 1 | 1.29mi |
| 413 W Britton Rd Oklahoma City, OK | 2.0 | 1.0 | 912 | $840 | $0.92 | 25d | 1 | 1.29mi |
| 1913 Downing St Oklahoma City, OK | 2.0 | 1.0 | 940 | $1,245 | $1.32 | 3d | 1 | 1.29mi |
| 1913 Downing St Oklahoma City, OK | 2.0 | 1.0 | 940 | $1,245 | $1.32 | 4d | 1 | 1.29mi |
| 911 NW 98th St Oklahoma City, OK | 3.0 | 1.0 | 1122 | $1,100 | $0.98 | 3d | 1 | 1.29mi |
| 2116 Andover Ct Oklahoma City, OK | 3.0 | 1.0 | 1103 | $1,495 | $1.36 | 5d | 1 | 1.34mi |
| 2104 Churchill Way Oklahoma City, OK | 3.0 | 1.0 | 866 | $1,365 | $1.58 | 3d | 1 | 1.39mi |
| 2113 Churchill Pl Oklahoma City, OK | 3.0 | 1.0 | 1025 | $1,250 | $1.22 | 45d | 1 | 1.40mi |
| 1025 Hoyt Ave Oklahoma City, OK | 4.0 | 1.0 | 884 | $1,150 | $1.30 | 13d | 1 | 1.44mi |
| 2204 Downing St Oklahoma City, OK | 2.0 | 1.0 | 750 | $1,295 | $1.73 | 21d | 1 | 1.48mi |
| 910 NW 101st St Oklahoma City, OK | 3.0 | 1.0 | 1100 | $1,400 | $1.27 | 3d | 1 | 1.49mi |
Listing history 4 events
-
2026-06-16statusdays on market $163,800 Pending 5 DOM
-
2026-06-15days on market $163,800 Active 4 DOM
-
2026-06-13remarks 605-char remark
-
2026-06-13$163,800 Active 2 DOM
ⓘ Source: listings_history table (triggers on properties + properties_extension) + one-shot
backfill from property_details.listing_events for pre-trigger history.
Tax reassessment forecast OK · Resets to sale price
- Current annual tax
- $346 · $29/mo
- Projected year-2 tax
- $1,474 · $123/mo
- Expected delta
- +$1,128/yr (+$94/mo · 326.0%)
ⓘ Screening estimate from a state-policy table — verify with the county assessor before closing.
Climate risk First Street
- Flood 1/10 Low FEMA zone X (unshaded) · 0% chance over 30 yrs
- Wildfire 1/10 Low
- Heat 6/10 Major 7 d/yr ≥107°F today · 18 d/yr by 30 yrs out
- Wind 2/10 Low 2% chance of damaging wind over 30 yrs
- Air quality 2/10 Low 2 unhealthy d/yr today · 2 by 30 yrs out
Nearby sold comps map
Loading sold comps map…
Walkable amenities ~0.75 mi
Loading nearby amenities…
Taxation est. · year 1
- Rental income
- $15,584
- − Mortgage interest
- −$9,175
- − Property taxes
- −$346
- − Insurance
- −$819
- − Repairs & maintenance
- −$1,247
- − Management
- −$1,247
- − Depreciation
- −$4,765
- Taxable loss
- −$2,015
- Est. tax savings @ 24.0%
- +$484
- After-tax cash flow
- $1,322/yr
For passive investors: Depreciation is non-cash, so a rental often shows a tax loss while cash-flowing — sheltering income. Rental losses are passive: they offset passive income freely, and up to $25,000/yr can offset ordinary (W-2) income if you actively participate and your MAGI is under $100k (phasing out to $0 by $150k); unused losses carry forward. On sale, claimed depreciation is recaptured at up to 25%, and gains may owe capital-gains tax (a 1031 exchange can defer both). Figures are a year-1 estimate at your 24.0% rate — not tax advice; consult a CPA.
Schools (NCES district)
- District
- Oklahoma City
- NCES district ID
- 4022770
- Math proficiency
- 7% ▼ -5.00%
- Reading proficiency
- 10% ▼ -6.00%
- Median HH income
- $35,606
- Composite
- 7.0/100
- National rank
- #9970
- State rank
- #254 of 270 in OK
Livability — Oklahoma City
- Score
- 80/100
- State rank
- #3
- US rank
- #1635
Category grades
Schools grade is shown separately in the Schools card above.
Census & demographics
- Census place
- Oklahoma City, OK
- County
- Oklahoma County · 771,644 people
- City population
- 498,656
- Metro
- Oklahoma City, OK
- Population (ZIP)
- 17,656
- Household income
- $54,936
- Rent vs Own
- Severe rent burden
- 1035.0
Population outlook (Oklahoma County) Hauer SSP2
- Today (2025)
- 911,875 people
- By 2030
- 982,413 · +7.7%
- By 2040
- 1,130,468 · +24.0%
- By 2050
- 1,288,422 · +41.3%
- By 2075
- 1,711,482 · +87.7%
- By 2100
- 2,088,448 · +129.0%
Race, ethnicity, and origin ACS 2023
- Neighborhood character
- Highly diverse neighborhood (Simpson 0.71)
- Race & ethnicity
- Black 41% White 29% Hispanic / Latino 20% Two or more races 12% Native American 3%
- Hispanic origin (detail)
- Mexican 16% Puerto Rican 1%
- Common ancestry
- Russian 1% Slovak 1% Italian 1%
- Foreign-born
- 12% · Canada, Jamaica
- Languages at home
- 78% English-only · Spanish 18%
Political lean MEDSL · Oklahoma
- 2024 margin
- Toss-up / Even · D 48.0% · R 49.7% · Other 2.3%
- 2008→2024 swing
- +15.1pp toward D · 2008: -16.8pp · 2024: -1.7pp
- All cycles
- 2024: R+1.7 2020: R+1.1 2016: R+10.5 2012: R+16.7 2008: R+16.8
Not yet ingested
- Civics
- —
Market trends
- HPI YoY
- ▼ -44.26%
- Current HPI
- 310.4705
- Rent YoY
- ▲ 3.47%
- Metro
- Oklahoma City, OK
- State GDP YoY
- ▲ 1.55%
- F500 in state
- 6
Industry mix (Fortune 500 HQ in OK)
| Industry | F500 HQs | Revenue |
|---|---|---|
| Energy | 3 | $48B |
|
||
Price history
1 event — show timeline
- 2026-06-01 Listed $163,800 MLSOK
Property tax history
-1.1%/yrLatest (2025): $346 · -0.8% YoY. Source: county tax records.
Cash-flow waterfall
monthlySold comps — $/sqft
last 12 mo · ≤1 miLoading sold comps…