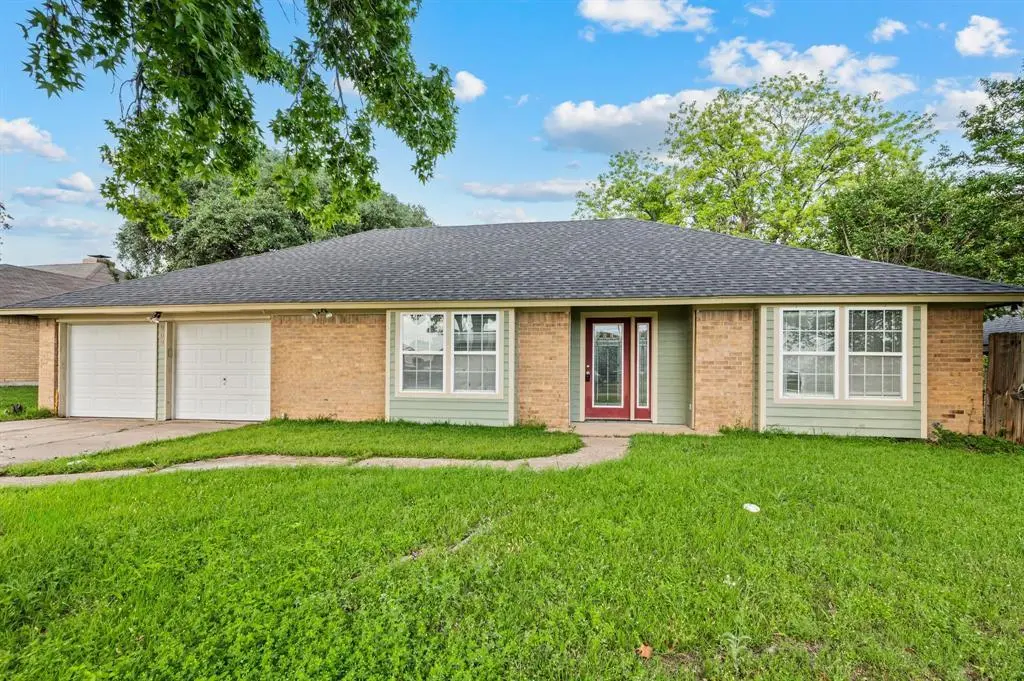
204 Overcrest Dr · Benbrook, TX
Flood risk 1/10 · Minimal
- FEMA flood zone
- X (unshaded)
- Chance of flooding over 30 yrs
- 0.0%
- Est. flood insurance / yr
- $507 – $1,088
Fire risk 5/10 · Moderate
- Est. fire insurance / yr
- $1,222 – $2,270
Heat risk 7/10 · Major
- Hot days now (above 109°F)
- 7 days/yr
- Hot days in 30 yrs
- 23 days/yr
Wind risk 4/10 · Minor
- Chance of severe wind over 30 yrs
- 24.0%
Air-quality risk 3/10 · Minor
- Unhealthy air days now
- 2 days/yr
- Unhealthy air days in 30 yrs
- 3 days/yr
Risk factors via First Street. Map © Google.
Why this score? — see what drove the D- grade
The composite is a weighted blend of 9 inputs, each scored 0–100. Each bar is that input's sub-score; the figure is the points it added to the 100-point composite (weight × sub-score).
- ARV discount +11.2/15.0
- Cash flow +10.3/30.0
- Livability +3.9/5.0
- 1% rule +3.1/10.0
- DSCR +2.9/10.0
- Rent growth +2.9/5.0
- Condition / age +2.5/5.0
- Schools +2.0/10.0
- Appreciation +0.0/10.0
$289,900
🖨 Deal sheet 📄 Offer letter ✓ Due diligence
Listing remarks
Don't miss this captivating, move-in ready gem tucked in one of Benbrook's most established neighborhoods — and don't wait, because updated homes like this don't last. Fresh from top to bottom: brand-new roof (2025), luxurious new flooring throughout, and fresh interior paint give this home the feel of a full remodel at a fraction of the price. From the moment you walk in, you'll notice it — impeccable, clean, and upgraded in all the right places. The functional layout offers four well-proportioned bedrooms, beautiful living spaces, and a flow that just works. The backyard is a blank canvas ready for your vision — landscaped and full of potential. Location seals the deal.
Key facts
- Landscaped backyard
- Brand new roof
- New flooring
Tags
Property features AI
Finance
- Financial info: Treat as clear loan type; No second mortgage
- HOA & community: No homeowner association
Exterior
- Parking: Covered parking for 2 vehicles; Driveway; Attached 2-car garage
- Utilities: City water; City sewer
- Home design: Single-family residence; Attached property; One story; Built in 1978
- Construction: Year built 1978
- Exterior features: Lot under 0.5 acre (about 0.207 acres); Subdivision: Westpark Add; Directions: 377 North, left on Overcrest, across from the middle school
Interior
- Kitchen: Dishwasher; Electric oven
- Bedrooms: 4 bedrooms (all on the main level); Primary bedroom approximately 12 x 13 (main level)
- Bathrooms: 2 full bathrooms (both on the main level)
- Interior features: Decorative lighting; One living area; One dining area; 8 total rooms; Wood-burning fireplace (1)
Neighborhood map
What this means for you Summary
Snapshot
- This is a 3-bed/2.0-bath single-family listed at $290k.
Deal economics
- At list price, monthly cash flow is $-161 ($-2k/yr) — negative.
- To cash-flow at today's rent, offer at most $261k (9.8% below list).
- To meet the 1% rule (rent ≥ 1% of price), the offer needs to be $235k (19.1% below list).
- Recommended offer: $235k (19.1% below list) — sets the bar for 1% rule.
- Cap rate 5.6% vs local median 2.9% in Benbrook — top-decile yield for the area; either an underpriced asset or a hidden risk that comps aren't pricing in. Stress-test before assuming the spread holds.
Location & tenants
- Location reads 77/100 on livability (#90 in TX, #3,172 nationally) — a middle-class / working-renter tenant base. Strengths: cost of living A+, housing A+, health & safety A+; Watch: amenities F, commute F.
- Fort Worth ISD (urban): math 18% / reading 28% proficiency, ranked #742 of 826 in TX (top 90%) — low school quality limits family demand, transient renter base, plan for 1-2y turnover; 73% free/reduced lunch — lower-income household profile, screen leases tightly.
- Zoned schools: Westpark El (math 58% / reading 56%, grade C+, #505 of 4,322 statewide, top 13%, 711 students, 37% FRL) — zoned schools average 37% FRL vs 73% district-wide (35 pts lower); this property's tenant base skews higher-income than the district average.
- Zoned-school proficiency averages 57% at this address vs 23% district-wide (+34 pts) — the actual schools serving this property are materially stronger than the Fort Worth ISD average implies; a family-tenant draw the district grade alone would hide.
- Market conditions: Rents rising (+1.6%/yr); 365 active listings in the ZIP; 10 comparable units currently listed for rent nearby; rentals at typical pace (median 20d on market — plan ~3-4 weeks tenant-placement turnaround); high-income renter base; 18,938 units permitted in Tarrant County in 2024 (8,336 in 5+ unit buildings).
Forward outlook
- Local home prices are declining (-3.0%/yr); year-one equity from $2k of loan paydown is wiped out by about $9k of value loss. Plan a longer hold.
- Tarrant County population projected at +41% by 2050 — long-run rental-demand tailwind backs the buy-and-hold thesis.
Negotiation context
- It's been on market 29 days — a 2% lower offer ($286k) is reasonable based on typical stale-listing flexibility.
Risks & watch-outs
- Climate carrying-cost: moderate wildfire risk; extreme-heat days projected 7→23/yr by 2055 (HVAC capex compounding) — expect insurance premiums to compound above CPI over the hold.
Questions for the listing agent
- What do current leases actually rent for vs. the listed asking? Can we see a recent rent roll and the last 12 months of T-12 income?
- Built in 1978 — when were the roof, HVAC, electrical panel, plumbing, and water heater last replaced?
- Is there a deadline driving the sale (1031 exchange, divorce, estate, relocation)? That informs how much negotiation room exists.
- Schools are D-rated, which usually means shorter tenancies and higher turnover. Who's the typical renter profile here, and what's been the actual vacancy rate?
- The area grade is low — what's the realistic commute time and amenity access for the typical tenant pool here? Any planned neighborhood developments (good or bad) we should know about?
- What's the average days-on-market for RENTAL listings here right now (not sales)? A rising rental-DOM trend means longer vacancies and softer asking-rent achievability than the comps imply.
- What's the recent tenant-quality profile in this submarket — average credit score on applications, eviction rate, late-payment / NSF rate, and stable-employment percentage? A property-management company in the area should have these aggregated.
- How much new for-sale + rental construction is in the pipeline within 1–3 miles? Heavy new supply typically softens prices + rents 12–24 months out; constrained supply supports both.
Investment metrics
- 1% rule
- 0.81% ✗
- Cap rate
- 5.63%
- Cash-on-cash
- -2.38%
- DSCR
- 0.89
- GRM
- 10.3
CMA / ARV
- ARV (median comp)
- $316,075
- List price
- $289,900
- Delta
- -8.28%
- Verdict
- FAIR
- Comps
- 20 within 1.0 mi
Show comp detail 12 sales within ~0.75 mi
| Address | Dist | Beds/Ba | Sqft | Sold | Price | $/sf | Match |
|---|---|---|---|---|---|---|---|
| 204 Overcrest Dr | 0.00mi | 4/2.0 (+1) | 1,763 (0%) | 0mo | $289,900 | $164 | 95 |
| 208 Meadowhill Dr | 0.09mi | 3/2.0 | 1,775 (+1%) | 3mo | $349,900 | $197 | 92 |
| 209 Lansford Dr | 0.08mi | 3/2.0 | 1,861 (+6%) | 2mo | $365,000 | $196 | 85 |
| 9928 Edmund Dr | 0.29mi | 3/2.0 | 1,879 (+7%) | 3mo | $340,000 | $181 | 73 |
| 7529 Whitestone Ranch Rd | 0.41mi | 3/2.0 | 1,711 (-3%) | 3mo | $315,500 | $184 | 73 |
| 10120 Regent Row St | 0.40mi | 3/2.0 | 1,826 (+4%) | 3mo | $360,000 | $197 | 73 |
| 10124 Stoneleigh Dr | 0.45mi | 3/2.0 | 1,826 (+4%) | 1mo | $349,750 | $192 | 72 |
| 5233 Concho Valley Trl | 0.75mi | 3/2.0 | 1,820 (+3%) | 1mo | $389,990 | $214 | 59 |
| 9808 Mullins Crossing Dr | 0.67mi | 3/2.0 | 1,664 (-6%) | 1mo | $349,000 | $210 | 59 |
| 10505 Stonehill Dr | 0.50mi | 3/2.0 | 2,000 (+13%) | 0mo | $385,000 | $193 | 54 |
| 7317 Royal Oak Dr | 0.70mi | 4/2.0 (+1) | 1,866 (+6%) | 1mo | $319,900 | $171 | 52 |
| 10604 Cobblestone Dr | 0.73mi | 4/2.0 (+1) | 1,866 (+6%) | 1mo | $310,000 | $166 | 50 |
Match score weights: distance 35% · size 25% · config 20% · recency 20%. Top-matched comps best support the ARV.
Projected returns pro-forma
-3.0% appreciation · 1.61% rent growth · sell at horizon
- IRR
- -21.8%
- Equity multiple
- 0.26×
- Total profit
- $-60,441
- Equity at exit
- $43,225
- IRR
- -19.3%
- Equity multiple
- 0.03×
- Total profit
- $-78,598
- Equity at exit
- $25,065
Cash invested: $81,172 (down + closing). Projections, not guarantees.
Landlord ↔ Tenant lean methodology
- Overall (STATE)
- 87 Strongly Landlord-Friendly
- State Texas
- 87 Strongly Landlord-Friendly · R+5
- County
- — inherits STATE
- City
- — inherits STATE
ZIP-level market 76126
- Home prices YoY
- -33.4%
- Rents YoY
- 1.6%
- Active inventory
- 365
- Price-to-rent
- 10.3×
Monthly cashflow live
- Estimated rent
- $2,346 high interval (Pro) →
- Mortgage (P&I)
- −$1,520
- Tax from tax record
- −$373 /mo · $4,480/yr
- Insurance
- −$121
- HOA
- −$0
- Vacancy / Maint / Mgmt
- −$493
- Net cashflow
- $-161
Break-even live
UW: 25.0% down · 7.5% · 30yr · 1.5% tax · 5.0% vac · 8.0% maint · 8.0% mgmt
Financing live
Cash to close
- Down payment
- $72,475
- Closing costs
- $8,697
- Reserves months
- —
- Total cash needed
- —
Loan-product check · same deal, 3 products live
Conventional
25% down · 7.5% · 30yr
- Down + closing
- —
- Monthly P&I
- —
- Monthly cashflow
- —
- DSCR
- —
- Eligible?
- —
Personal DTI + credit; lowest rate.
DSCR
20% down · 8.5% · 30yr
- Down + closing
- —
- Monthly P&I
- —
- Monthly cashflow
- —
- DSCR
- —
- Eligible?
- —
No personal income docs; deal must DSCR.
Hard money
10% down · 12.0% · 12mo
- Down + closing
- —
- Monthly P&I
- —
- Monthly cashflow
- —
- DSCR
- —
- Eligible?
- —
Short-term bridge; refi at stabilization.
Rent comps 10 comps
| Address | Beds | Baths | Sqft | Rent | $/sqft | DOM | Units | Dist |
|---|---|---|---|---|---|---|---|---|
| 10413 Trevino Ln Benbrook, TX | 3.0 | 2.0 | 1855 | $2,495 | $1.35 | 19d | 1 | 0.49mi |
| 10332 Trevino Ln Benbrook, TX | 3.0 | 2.0 | 1456 | $2,400 | $1.65 | 24d | 1 | 0.50mi |
| 7205 Hogan Dr Benbrook, TX | 3.0 | 2.0 | 1508 | $2,400 | $1.59 | 24d | 1 | 0.56mi |
| 7124 Summerset Dr Benbrook, TX | 4.0 | 3.0 | 1886 | $2,200 | $1.17 | 43d | 1 | 0.71mi |
| 9510 Westpark Dr Benbrook, TX | 3.0 | 2.0 | 1361 | $1,942 | $1.43 | 4d | 1 | 0.82mi |
| 9510 Westpark Dr Unit 9543 Benbrook, TX | 3.0 | 2.0 | 1361 | $2,037 | $1.50 | 43d | 1 | 0.82mi |
| 9510 Westpark Dr Unit 3121 Benbrook, TX | 3.0 | 2.0 | 1361 | $1,903 | $1.40 | 3d | 1 | 0.82mi |
| 10449 Orchard Way Fort Worth, TX | 1.0–3.0 | 1.0–2.0 | 1057 | $2,852 | $2.70 | 1d | 47 | 1.43mi |
| 1011 Usher St Benbrook, TX | 4.0 | 2.0 | 2071 | $2,175 | $1.05 | 13d | 1 | 1.46mi |
| 6142 Lavanda Ave Benbrook, TX | 3.0 | 2.0 | 1369 | $2,750 | $2.01 | 5d | 1 | 1.48mi |
Listing history 13 events
-
2026-06-07statusdays on market $289,900 Pending 29 DOM
-
2026-06-04days on market $289,900 Active Option Contract 28 DOM
-
2026-06-03days on market $289,900 Active Option Contract 27 DOM
-
2026-06-02days on market $289,900 Active Option Contract 26 DOM
-
2026-06-01days on market $289,900 Active Option Contract 25 DOM
-
2026-05-31days on market $289,900 Active Option Contract 24 DOM
-
2026-05-15historical Active Option Contract 1202-char remark
-
2026-05-07$289,900 Active 1202-char remark
-
2017-04-25soldstatus
-
2017-04-24soldstatus
-
2001-06-29soldstatus
-
1999-11-02soldstatus
-
1999-11-02soldstatus
ⓘ Source: listings_history table (triggers on properties + properties_extension) + one-shot
backfill from property_details.listing_events for pre-trigger history.
Tax reassessment forecast TX · Resets to sale price
- Current annual tax
- $4,480 · $373/mo
- Projected year-2 tax
- $5,305 · $442/mo
- Expected delta
- +$825/yr (+$69/mo · 18.4%)
ⓘ Screening estimate from a state-policy table — verify with the county assessor before closing.
Climate risk First Street
- Flood 1/10 Low FEMA zone X (unshaded) · 0% chance over 30 yrs
- Wildfire 5/10 Major
- Heat 7/10 Severe 7 d/yr ≥109°F today · 23 d/yr by 30 yrs out
- Wind 4/10 Moderate 24% chance of damaging wind over 30 yrs
- Air quality 3/10 Moderate 2 unhealthy d/yr today · 3 by 30 yrs out
Nearby sold comps map
Loading sold comps map…
Walkable amenities ~0.75 mi
Loading nearby amenities…
Taxation est. · year 1
- Rental income
- $28,149
- − Mortgage interest
- −$16,239
- − Property taxes
- −$4,480
- − Insurance
- −$1,450
- − Repairs & maintenance
- −$2,252
- − Management
- −$2,252
- − Depreciation
- −$8,433
- Taxable loss
- −$6,957
- Est. tax savings @ 24.0%
- +$1,670
- After-tax cash flow
- $-266/yr
For passive investors: Depreciation is non-cash, so a rental often shows a tax loss while cash-flowing — sheltering income. Rental losses are passive: they offset passive income freely, and up to $25,000/yr can offset ordinary (W-2) income if you actively participate and your MAGI is under $100k (phasing out to $0 by $150k); unused losses carry forward. On sale, claimed depreciation is recaptured at up to 25%, and gains may owe capital-gains tax (a 1031 exchange can defer both). Figures are a year-1 estimate at your 24.0% rate — not tax advice; consult a CPA.
Schools (NCES district)
- District
- Fort Worth ISD
- NCES district ID
- 4819700
- Math proficiency
- 18% ▼ -16.00%
- Reading proficiency
- 28% ▼ -6.00%
- Median HH income
- $42,109
- Composite
- 19.61/100
- National rank
- #8753
- State rank
- #742 of 826 in TX
Livability — Benbrook
- Score
- 77/100
- State rank
- #90
- US rank
- #3172
Category grades
Schools grade is shown separately in the Schools card above.
Census & demographics
- Census place
- Benbrook, TX
- County
- Tarrant County · 2,033,669 people
- City population
- 27,689
- Metro
- Dallas-Fort Worth-Arlington, TX
- Population (ZIP)
- 27,689
- Household income
- $113,905
- Rent vs Own
- Severe rent burden
- 228.0
Population outlook (Tarrant County) Hauer SSP2
- Today (2025)
- 2,380,417 people
- By 2030
- 2,578,900 · +8.3%
- By 2040
- 2,974,995 · +25.0%
- By 2050
- 3,350,489 · +40.8%
- By 2075
- 4,216,909 · +77.2%
- By 2100
- 4,741,527 · +99.2%
Race, ethnicity, and origin ACS 2023
- Neighborhood character
- Predominantly White (73%)
- Race & ethnicity
- White 73% Hispanic / Latino 20% Two or more races 18% Black 2% Asian 2%
- Hispanic origin (detail)
- Mexican 18%
- Common ancestry
- Italian 4% Lithuanian 2% Slovak 2%
- Foreign-born
- 5% · Canada
- Languages at home
- 91% English-only · Spanish 7% Other Asian/Pacific 1%
Political lean MEDSL · Tarrant
- 2024 margin
- Lean R (+5.1) · D 46.7% · R 51.9% · Other 1.4%
- 2008→2024 swing
- +6.6pp toward D · 2008: -11.7pp · 2024: -5.1pp
- All cycles
- 2024: R+5.1 2020: D+0.2 2016: R+8.7 2012: R+15.7 2008: R+11.7
Not yet ingested
- Civics
- —
Market trends
- HPI YoY
- ▼ -130.45%
- Current HPI
- 260.2385
- Rent YoY
- ▲ 1.61%
- Metro
- Dallas-Fort Worth-Arlington, TX
- State GDP YoY
- ▲ 3.95%
- F500 in state
- 110
Industry mix (Fortune 500 HQ in TX)
| Industry | F500 HQs | Revenue |
|---|---|---|
| Energy | 16 | $1,198B |
|
||
| Technology | 5 | $198B |
|
||
| Engineering / Construction | 4 | $72B |
|
||
| Energy Services | 3 | $60B |
|
||
| Utilities | 3 | $41B |
|
||
| Healthcare | 2 | $330B |
|
||
Price history
9 events — show timeline
- 2026-06-12 Sold (MLS) — NTREIS
- 2026-06-05 Pending — NTREIS
- 2026-05-15 Contingent — NTREIS
- 2026-05-07 Listed $289,900 NTREIS
- 2017-04-25 Sold (Public Records) — Public Records
- 2017-04-24 Sold (Public Records) — Public Records
- 2001-06-29 Sold (Public Records) — Public Records
- 1999-11-02 Sold (Public Records) — Public Records
- 1999-11-02 Sold (Public Records) — Public Records
Property tax history
+2.3%/yrLatest (2025): $4,480 · -13.8% YoY. Source: county tax records.
Cash-flow waterfall
monthlySold comps — $/sqft
last 12 mo · ≤1 miLoading sold comps…