314 S Main St #100 · Angels, CA
Flood risk 1/10 · Minimal
- FEMA flood zone
- X (unshaded)
- Chance of flooding over 30 yrs
- 0.0%
- Est. flood insurance / yr
- $507 – $1,088
Fire risk 8/10 · Major
- Est. fire insurance / yr
- $659 – $1,223
Heat risk 6/10 · Moderate
- Hot days now (above 102°F)
- 6 days/yr
- Hot days in 30 yrs
- 13 days/yr
Wind risk 1/10 · Minimal
- Chance of severe wind over 30 yrs
- —
Air-quality risk 10/10 · Severe
- Unhealthy air days now
- 27 days/yr
- Unhealthy air days in 30 yrs
- 31 days/yr
Risk factors via First Street. Map © Google.
Why this score? — see what drove the B+ grade
The composite is a weighted blend of 9 inputs, each scored 0–100. Each bar is that input's sub-score; the figure is the points it added to the 100-point composite (weight × sub-score).
- Cash flow +30.0/30.0
- 1% rule +10.0/10.0
- DSCR +10.0/10.0
- ARV discount +7.5/15.0
- Appreciation +5.0/10.0
- Schools +4.5/10.0
- Livability +3.5/5.0
- Rent growth +2.5/5.0
- Condition / age +2.5/5.0
$65,900
🖨 Deal sheet 📄 Offer letter ✓ Due diligence
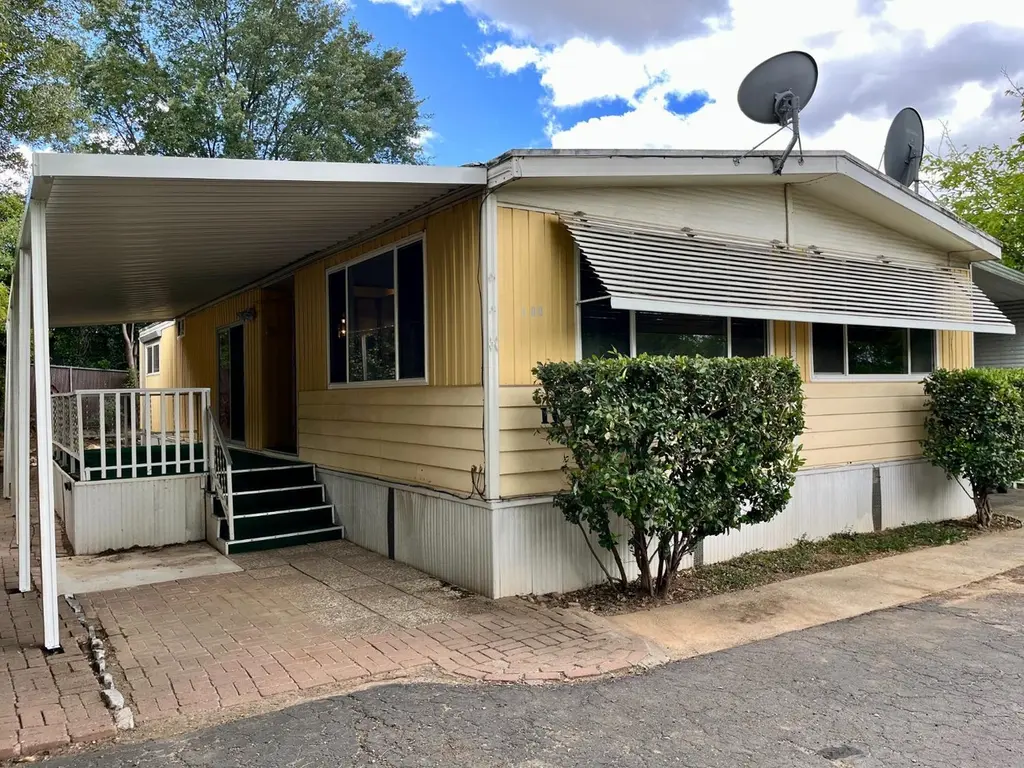
Listing remarks
Priced to sell, this super-clean, well-maintained home offers a spacious open living area with plenty of windows for a bright, cheerful feel. The location in the park is perfect, being on the back side on a quiet street providing a peaceful setting. Features include new carpet in the bedrooms, a new awning over the porch, a small but thoughtfully landscaped yard with a brick patio, rock delineations, roses, and attractive plantings. Appliances include a new refrigerator (2025), gas range, dishwasher, washer and dryer, and a storage shed.
Key facts
- New carpet
- Brick patio
- Open living area
Tags
Property features AI
Finance
- Other: Located in a manufactured-home park (directions available to main park entrance)
- HOA & community: No association
Exterior
- Parking: Guest parking available
- Utilities: Propane; Public water; Public sewer; 220 volts in laundry
- Home design: Manufactured in park (double wide); Original condition; Built in 1971
- Construction: Aluminum skirting; Other roof type
- Exterior features: Shed(s); Landscaping details; Porch awning; Covered patio
Interior
- Kitchen: Free standing gas range; Free standing electric range; Dishwasher; Microwave
- Bedrooms: 2 bedrooms (includes master bedroom)
- Flooring: Carpet; Laminate; Linoleum
- Bathrooms: 2 full bathrooms with shower stalls
- Heating & cooling: Central heating; Central cooling; Ceiling fans
- Interior features: Great room living area; Pantry cabinet; Laminate counters; Covered patio with porch steps and railings; Porch awning; Pets allowed (cats and dogs, size and number limits apply)
- Laundry & utility: Washer and dryer included; Laundry closet; 220V outlet in laundry
Neighborhood map
What this means for you Summary
Snapshot
- This is a 2-bed/2.0-bath manufactured listed at $66k.
Deal economics
- At list price, monthly cash flow is $512 ($6k/yr) — positive.
- The deal already cash-flows at list — no discount required.
- Meets the 1% rule at list price ($1k rent vs $66k).
- Recommended offer: $65k (1.5% below list) — sets the bar for market timing.
- Cap rate 15.6% vs local median 4.5% in Angels — top-decile yield for the area; either an underpriced asset or a hidden risk that comps aren't pricing in. Stress-test before assuming the spread holds.
Location & tenants
- Location reads 69/100 on livability (#265 in CA) — a middle-class / working-renter tenant base. Strengths: health & safety A+, crime B+, schools B; Watch: amenities F, commute F, cost of living F.
- Bret Harte Union High (town): math 35% / reading 65% proficiency, ranked #429 of 1,400 in CA (top 31%) — acceptable for families but not a draw, mixed tenant base, ~2y average lease.
- Market conditions: 1 active listings in the ZIP; 77 units permitted in Calaveras County in 2024 (0 in 5+ unit buildings).
Forward outlook
- In year one you build about $2k of equity ($456 loan paydown + $2k appreciation (3.0% local appreciation)).
- Calaveras County population projected at -18% by 2050 — secular population decline; favor cash flow + early exit over multi-decade hold.
- At projected returns (3.0% appreciation + 3.0% rent growth), your $18k cash investment doubles in ~3 years — after that, you're playing with house money.
Negotiation context
- It's been on market 21 days — a 2% lower offer ($65k) is reasonable based on typical stale-listing flexibility.
Risks & watch-outs
- Climate carrying-cost: severe wildfire risk; extreme-heat days projected 6→13/yr by 2055 (HVAC capex compounding) — expect insurance premiums to compound above CPI over the hold.
Questions for the listing agent
- Built in 1971 — when were the roof, HVAC, electrical panel, plumbing, and water heater last replaced?
- Is there a deadline driving the sale (1031 exchange, divorce, estate, relocation)? That informs how much negotiation room exists.
- Schools are B-rated — typically a magnet for longer-tenancy family renters. What's the average tenant stay here, and is there a school-zone premium baked into asking?
- What's the average days-on-market for RENTAL listings here right now (not sales)? A rising rental-DOM trend means longer vacancies and softer asking-rent achievability than the comps imply.
- What's the recent tenant-quality profile in this submarket — average credit score on applications, eviction rate, late-payment / NSF rate, and stable-employment percentage? A property-management company in the area should have these aggregated.
- How much new for-sale + rental construction is in the pipeline within 1–3 miles? Heavy new supply typically softens prices + rents 12–24 months out; constrained supply supports both.
Investment metrics
- 1% rule
- 1.73% ✓
- Cap rate
- 15.61%
- Cash-on-cash
- 33.28%
- DSCR
- 2.48
- GRM
- 4.8
CMA / ARV
- ARV (on-the-fly)
- $27,500
- Comps found
- 1
Show comp detail 1 sale within ~0.75 mi
| Address | Dist | Beds/Ba | Sqft | Sold | Price | $/sf | Match |
|---|---|---|---|---|---|---|---|
| 314 S Main St #73 | 0.05mi | 2/1.0 | 1,000 (-9%) | 0mo | $25,000 | $25 | 78 |
Match score weights: distance 35% · size 25% · config 20% · recency 20%. Top-matched comps best support the ARV.
Projected returns pro-forma
3.0% appreciation · 3.0% rent growth · sell at horizon
- IRR
- 39.0%
- Equity multiple
- 3.20×
- Total profit
- $40,506
- Equity at exit
- $29,631
- IRR
- 38.9%
- Equity multiple
- 6.34×
- Total profit
- $98,496
- Equity at exit
- $45,666
Cash invested: $18,452 (down + closing). Projections, not guarantees.
Landlord ↔ Tenant lean methodology
- Overall (STATE)
- 18 Strongly Tenant-Friendly
- State California
- 18 Strongly Tenant-Friendly · D+13
- County
- — inherits STATE
- City
- — inherits STATE
ZIP-level market 95221
- Active inventory
- 1
- Price-to-rent
- 4.8×
Monthly cashflow live
- Estimated rent
- $1,137 medium interval (Pro) →
- Mortgage (P&I)
- −$346
- Tax from tax record
- −$14 /mo · $165/yr
- Insurance
- −$27
- HOA
- −$0
- Vacancy / Maint / Mgmt
- −$239
- Net cashflow
- $512
Break-even live
UW: 25.0% down · 7.5% · 30yr · 1.5% tax · 5.0% vac · 8.0% maint · 8.0% mgmt
Financing live
Cash to close
- Down payment
- $16,475
- Closing costs
- $1,977
- Reserves months
- —
- Total cash needed
- —
Loan-product check · same deal, 3 products live
Conventional
25% down · 7.5% · 30yr
- Down + closing
- —
- Monthly P&I
- —
- Monthly cashflow
- —
- DSCR
- —
- Eligible?
- —
Personal DTI + credit; lowest rate.
DSCR
20% down · 8.5% · 30yr
- Down + closing
- —
- Monthly P&I
- —
- Monthly cashflow
- —
- DSCR
- —
- Eligible?
- —
No personal income docs; deal must DSCR.
Hard money
10% down · 12.0% · 12mo
- Down + closing
- —
- Monthly P&I
- —
- Monthly cashflow
- —
- DSCR
- —
- Eligible?
- —
Short-term bridge; refi at stabilization.
Listing history 11 events
-
2026-06-18days on market $65,900 Active 21 DOM
-
2026-06-17days on market $65,900 Active 20 DOM
-
2026-06-16days on market $65,900 Active 19 DOM
-
2026-06-15days on market $65,900 Active 18 DOM
-
2026-06-14days on market $65,900 Active 16 DOM
-
2026-06-10days on market $65,900 Active 13 DOM
-
2026-06-09days on market $65,900 Active 12 DOM
-
2026-06-08days on market $65,900 Active 11 DOM
-
2026-06-07days on market $65,900 Active 10 DOM
-
2026-06-05remarks 544-char remark
-
2026-06-05$65,900 Active 7 DOM
ⓘ Source: listings_history table (triggers on properties + properties_extension) + one-shot
backfill from property_details.listing_events for pre-trigger history.
Tax reassessment forecast CA · Resets to sale price
- Current annual tax
- $165 · $14/mo
- Projected year-2 tax
- $501 · $42/mo
- Expected delta
- +$335/yr (+$28/mo · 202.7%)
ⓘ Screening estimate from a state-policy table — verify with the county assessor before closing.
Climate risk First Street
- Flood 1/10 Low FEMA zone X (unshaded) · 0% chance over 30 yrs
- Wildfire 8/10 Severe
- Heat 6/10 Major 6 d/yr ≥102°F today · 13 d/yr by 30 yrs out
- Wind 1/10 Low
- Air quality 10/10 Extreme 27 unhealthy d/yr today · 31 by 30 yrs out
Nearby sold comps map
Loading sold comps map…
Walkable amenities ~0.75 mi
Loading nearby amenities…
Taxation est. · year 1
- Rental income
- $13,649
- − Mortgage interest
- −$3,691
- − Property taxes
- −$165
- − Insurance
- −$330
- − Repairs & maintenance
- −$1,092
- − Management
- −$1,092
- − Depreciation
- −$1,917
- Taxable income
- $5,362
- Est. tax owed @ 24.0%
- −$1,287
- After-tax cash flow
- $4,854/yr
For passive investors: Depreciation is non-cash, so a rental often shows a tax loss while cash-flowing — sheltering income. Rental losses are passive: they offset passive income freely, and up to $25,000/yr can offset ordinary (W-2) income if you actively participate and your MAGI is under $100k (phasing out to $0 by $150k); unused losses carry forward. On sale, claimed depreciation is recaptured at up to 25%, and gains may owe capital-gains tax (a 1031 exchange can defer both). Figures are a year-1 estimate at your 24.0% rate — not tax advice; consult a CPA.
Schools (NCES district)
- District
- Bret Harte Union High
- NCES district ID
- 0605940
- Math proficiency
- 35% ▲ 5.00%
- Reading proficiency
- 65% ▲ 5.00%
- Median HH income
- $56,974
- Composite
- 45.41/100
- National rank
- #5708
- State rank
- #429 of 1400 in CA
Livability — Angels
- Score
- 69/100
- State rank
- #265
- US rank
- #8772
Category grades
Schools grade is shown separately in the Schools card above.
Census & demographics
- Census place
- Angels, CA
- City population
- 164
- Population (ZIP)
- 164
Population outlook (Calaveras County) Hauer SSP2
- Today (2025)
- 43,163 people
- By 2030
- 41,703 · -3.4%
- By 2040
- 38,202 · -11.5%
- By 2050
- 35,385 · -18.0%
- By 2075
- 30,807 · -28.6%
- By 2100
- 25,755 · -40.3%
Race, ethnicity, and origin ACS 2023
- Neighborhood character
- Predominantly White (73%)
- Race & ethnicity
- White 73% Two or more races 18% Native American 10%
- Common ancestry
- Slovak 16%
Political lean MEDSL · Calaveras
- 2024 margin
- Strong R (+28.1) · D 34.7% · R 62.8% · Other 2.5%
- 2008→2024 swing
- -15.2pp toward R · 2008: -13.0pp · 2024: -28.1pp
- All cycles
- 2024: R+28.1 2020: R+23.8 2016: R+23.9 2012: R+17.0 2008: R+13.0
Not yet ingested
- Civics
- —
Market trends
- HPI YoY
- —
- Current HPI
- —
- Rent YoY
- —
- Metro
- —
- State GDP YoY
- ▲ 3.21%
- F500 in state
- 116
Industry mix (Fortune 500 HQ in CA)
| Industry | F500 HQs | Revenue |
|---|---|---|
| Technology | 27 | $1,492B |
|
||
| Financial Services | 3 | $174B |
|
||
| Retail | 3 | $44B |
|
||
| Insurance | 3 | $26B |
|
||
| Media / Entertainment | 2 | $115B |
|
||
| Pharmaceuticals / Biotech | 2 | $62B |
|
||
Property tax history
-0.8%/yrLatest (2019): $165 · +0.5% YoY. Source: county tax records.
Cash-flow waterfall
monthlySold comps — $/sqft
last 12 mo · ≤1 miLoading sold comps…