374 Manor Ave · Carneys Point, NJ
Flood risk 6/10 · Moderate
- FEMA flood zone
- X (unshaded)
- Chance of flooding over 30 yrs
- 0.57%
- Est. flood insurance / yr
- $507 – $1,088
Fire risk 1/10 · Minimal
- Est. fire insurance / yr
- $526 – $976
Heat risk 7/10 · Major
- Hot days now (above 104°F)
- 7 days/yr
- Hot days in 30 yrs
- 15 days/yr
Wind risk 6/10 · Moderate
- Chance of severe wind over 30 yrs
- 27.0%
Air-quality risk 3/10 · Minor
- Unhealthy air days now
- 3 days/yr
- Unhealthy air days in 30 yrs
- 5 days/yr
Risk factors via First Street. Map © Google.
Why this score? — see what drove the C+ grade
The composite is a weighted blend of 9 inputs, each scored 0–100. Each bar is that input's sub-score; the figure is the points it added to the 100-point composite (weight × sub-score).
- Cash flow +25.0/30.0
- ARV discount +15.0/15.0
- DSCR +8.2/10.0
- 1% rule +7.2/10.0
- Livability +2.9/5.0
- Rent growth +2.5/5.0
- Condition / age +2.5/5.0
- Schools +1.2/10.0
- Appreciation +0.0/10.0
$190,000
🖨 Deal sheet 📄 Offer letter ✓ Due diligence
Listing remarks MLS
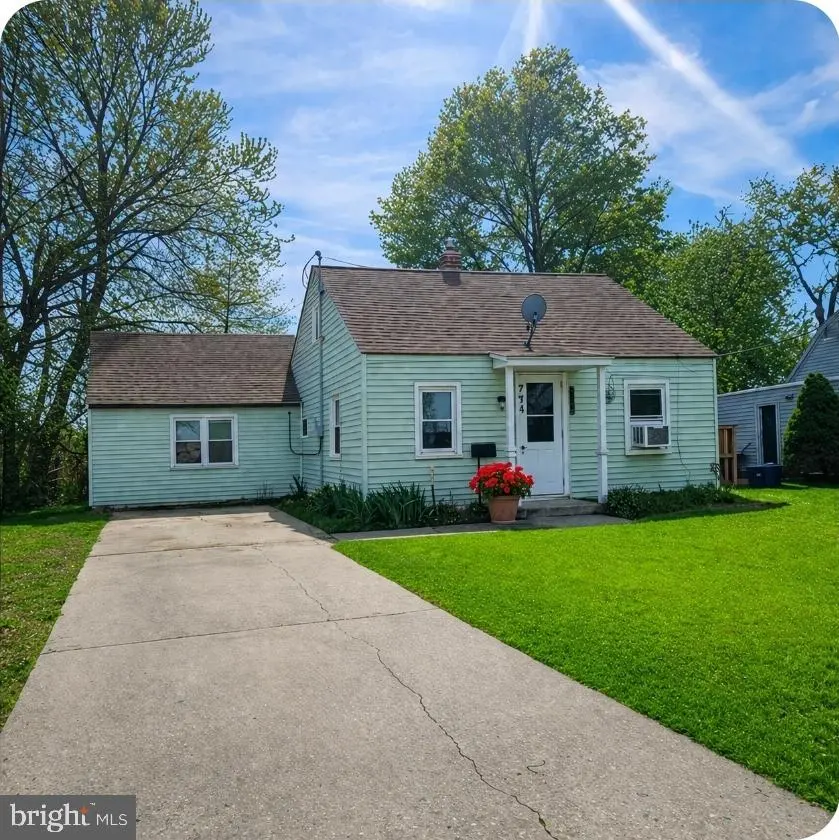
INVESTER ALERT or First time home buyer. Nestled in the charming Golf Manor community, this 1945 Cape Cod home offers a blend of character and some modern updates, leaving room for you to add your own special touches. The property features a recently updated bathroom with a walk-in shower and newer vinyl plank flooring in the primary bedroom. The cozy living space includes plank flooring and an eat-in kitchen equipped with an electric oven/range, refrigerator, and microwave. Newer roofing shingles and updated windows. This three-bedroom home includes ceiling fans for year-round comfort and a versatile storage area off the main bedroom that could be converted into a laundry room. Additional storage is available in the basement and an outdoor shed. Heating and hotwater 2014 and serviced yearly. Last service Sept 2025. The 0.14-acre lot provides a manageable outdoor space within a friendly community close to parks, Sakima Golf Club, and Salem Community College. The location offers easy access to the NJ Turnpike and I-295, as well as tax-free shopping in nearby Delaware. Please note that the property is being sold in "as-is, where-is" condition. All inspections are for the buyer's information only, and the Certificate of Occupancy will be the buyer's responsibility prior to closing.
Key facts
- 6,299 sq ft lot
- 2 parking spots
- Built 1945
Neighborhood map
What this means for you Summary
Snapshot
- This is a 3-bed/1.0-bath single-family listed at $190k.
Deal economics
- At list price, monthly cash flow is $416 ($5k/yr) — positive.
- The deal already cash-flows at list — no discount required.
- Meets the 1% rule at list price ($2k rent vs $190k).
- Recommended offer: $184k (3.0% below list) — sets the bar for market timing.
- Cap rate 8.9% vs local median 5.1% in Carneys Point — top-decile yield for the area; either an underpriced asset or a hidden risk that comps aren't pricing in. Stress-test before assuming the spread holds.
Location & tenants
- Location reads 57/100 on livability (#515 in NJ) — a working-class tenant base; expect higher turnover. Strengths: cost of living A, housing B+; Watch: employment C-, schools D-, amenities F.
- Penns Grove-Carneys Point Regional School District (suburban): math 6% / reading 21% proficiency, ranked #462 of 472 in NJ (top 98%) — low school quality limits family demand, transient renter base, plan for 1-2y turnover; 65% free/reduced lunch — lower-income household profile, screen leases tightly.
- Market conditions: 101 active listings in the ZIP; 1 comparable units currently listed for rent nearby; 95 units permitted in Salem County in 2024 (0 in 5+ unit buildings).
- This rent runs 39% of the median local income ($72k/yr) — at the standard rent-burdened threshold; future hikes will face affordability resistance.
Forward outlook
- Local home prices are declining (-3.0%/yr); year-one equity from $1k of loan paydown is wiped out by about $6k of value loss. Plan a longer hold.
- Salem County population projected at -23% by 2050 — secular population decline; favor cash flow + early exit over multi-decade hold.
Negotiation context
- It's been on market 60 days — a 3% lower offer ($184k) is reasonable based on typical stale-listing flexibility.
Risks & watch-outs
- Watch-outs: built in 1945 — expect roof / HVAC / electrical / plumbing capex.
- Climate carrying-cost: major flood risk; major wind risk, 27% chance of damaging wind over 30y; extreme-heat days projected 7→15/yr by 2055 (HVAC capex compounding) — expect insurance premiums to compound above CPI over the hold.
Questions for the listing agent
- It's been on market 60 days. Have you received any prior offers? Is the seller open to a 3% concession, seller financing, or rate buy-down credit?
- Built in 1945 — when were the roof, HVAC, electrical panel, plumbing, and water heater last replaced?
- Is there a deadline driving the sale (1031 exchange, divorce, estate, relocation)? That informs how much negotiation room exists.
- Schools are D-rated, which usually means shorter tenancies and higher turnover. Who's the typical renter profile here, and what's been the actual vacancy rate?
- What's the average days-on-market for RENTAL listings here right now (not sales)? A rising rental-DOM trend means longer vacancies and softer asking-rent achievability than the comps imply.
- What's the recent tenant-quality profile in this submarket — average credit score on applications, eviction rate, late-payment / NSF rate, and stable-employment percentage? A property-management company in the area should have these aggregated.
- How much new for-sale + rental construction is in the pipeline within 1–3 miles? Heavy new supply typically softens prices + rents 12–24 months out; constrained supply supports both.
Investment metrics
- 1% rule
- 1.22% ✓
- Cap rate
- 8.92%
- Cash-on-cash
- 9.39%
- DSCR
- 1.42
- GRM
- 6.8
CMA / ARV
- ARV (median comp)
- $229,621
- List price
- $190,000
- Delta
- -17.25%
- Verdict
- UNDERPRICED
- Comps
- 20 within 1.0 mi
Show comp detail 10 sales within ~0.75 mi
| Address | Dist | Beds/Ba | Sqft | Sold | Price | $/sf | Match |
|---|---|---|---|---|---|---|---|
| 386 Manor Ave | 0.07mi | 3/1.0 | 1,416 (+6%) | 9mo | $200,000 | $141 | 79 |
| 384 Springfield Ave | 0.08mi | 4/2.0 (+1) | 1,334 (+0%) | 16mo | $273,000 | $205 | 74 |
| 17 Maplewood Ave | 0.38mi | 3/1.5 | 1,384 (+4%) | 2mo | $280,800 | $203 | 72 |
| 18 Oakwood Ave | 0.33mi | 3/1.0 | 1,356 (+2%) | 23mo | $235,000 | $173 | 63 |
| 396 Manor Ave | 0.12mi | 3/2.0 | 1,510 (+13%) | 10mo | $286,000 | $189 | 59 |
| 462 Fairway Ct | 0.31mi | 3/1.0 | 1,409 (+6%) | 22mo | $215,000 | $153 | 58 |
| 31 Pinewood Ave | 0.37mi | 2/1.0 (-1) | 1,244 (-7%) | 15mo | $130,000 | $105 | 54 |
| 341 Jefferson St | 0.59mi | 3/2.0 | 1,432 (+8%) | 4mo | $200,000 | $140 | 52 |
| 260 S Golfwood Ave | 0.65mi | 3/1.5 | 1,410 (+6%) | 10mo | $310,000 | $220 | 50 |
| 91 Fenton Dr | 0.58mi | 3/2.0 | 1,184 (-11%) | 13mo | $320,000 | $270 | 39 |
Match score weights: distance 35% · size 25% · config 20% · recency 20%. Top-matched comps best support the ARV.
Projected returns pro-forma
-3.0% appreciation · 3.0% rent growth · sell at horizon
- IRR
- -2.1%
- Equity multiple
- 0.92×
- Total profit
- $-4,167
- Equity at exit
- $28,330
- IRR
- 7.7%
- Equity multiple
- 1.58×
- Total profit
- $30,924
- Equity at exit
- $16,428
Cash invested: $53,200 (down + closing). Projections, not guarantees.
Landlord ↔ Tenant lean methodology
- Overall (STATE)
- 21 Tenant-Leaning
- State New Jersey
- 21 Tenant-Leaning · D+6
- County
- — inherits STATE
- City
- — inherits STATE
ZIP-level market 08069
- Home prices YoY
- -18.8%
- Active inventory
- 101
- Price-to-rent
- 6.8×
Monthly cashflow live
- Estimated rent
- $2,320 medium interval (Pro) →
- Mortgage (P&I)
- −$996
- Tax from tax record
- −$341 /mo · $4,093/yr
- Insurance
- −$79
- HOA
- −$0
- Vacancy / Maint / Mgmt
- −$487
- Net cashflow
- $416
Break-even live
UW: 25.0% down · 7.5% · 30yr · 1.5% tax · 5.0% vac · 8.0% maint · 8.0% mgmt
Financing live
Cash to close
- Down payment
- $47,500
- Closing costs
- $5,700
- Reserves months
- —
- Total cash needed
- —
Loan-product check · same deal, 3 products live
Conventional
25% down · 7.5% · 30yr
- Down + closing
- —
- Monthly P&I
- —
- Monthly cashflow
- —
- DSCR
- —
- Eligible?
- —
Personal DTI + credit; lowest rate.
DSCR
20% down · 8.5% · 30yr
- Down + closing
- —
- Monthly P&I
- —
- Monthly cashflow
- —
- DSCR
- —
- Eligible?
- —
No personal income docs; deal must DSCR.
Hard money
10% down · 12.0% · 12mo
- Down + closing
- —
- Monthly P&I
- —
- Monthly cashflow
- —
- DSCR
- —
- Eligible?
- —
Short-term bridge; refi at stabilization.
Rent comps 1 comps
| Address | Beds | Baths | Sqft | Rent | $/sqft | DOM | Units | Dist |
|---|---|---|---|---|---|---|---|---|
| 258 Birch St Penns Grove, NJ | 3.0 | 1.0 | 1114 | $2,100 | $1.89 | 10d | 1 | 0.98mi |
Listing history 14 events
-
2026-06-18days on market $190,000 Active 60 DOM
-
2026-06-17days on market $190,000 Active 59 DOM
-
2026-06-16days on market $190,000 Active 58 DOM
-
2026-06-15days on market $190,000 Active 57 DOM
-
2026-06-13days on market $190,000 Active 55 DOM
-
2026-06-09days on market $190,000 Active 51 DOM
-
2026-06-08days on market $190,000 Active 50 DOM
-
2026-06-07days on market $190,000 Active 49 DOM
-
2026-06-04days on market $190,000 Active 46 DOM
-
2026-06-03days on market $190,000 Active 45 DOM
-
2026-06-02days on market $190,000 Active 44 DOM
-
2026-06-01days on market $190,000 Active 43 DOM
-
2026-05-31days on market $190,000 Active 42 DOM
-
2026-04-20$190,000 Active 1310-char remark
Show marketing remark (1310 chars)
INVESTER ALERT or First time home buyer. Nestled in the charming Golf Manor community, this 1945 Cape Cod home offers a blend of character and some modern updates, leaving room for you to add your own special touches. The property features a recently updated bathroom with a walk-in shower and newer vinyl plank flooring in the primary bedroom. The cozy living space includes plank flooring and an eat-in kitchen equipped with an electric oven/range, refrigerator, and microwave. Newer roofing shingles and updated windows. This three-bedroom home includes ceiling fans for year-round comfort and a versatile storage area off the main bedroom that could be converted into a laundry room. Additional storage is available in the basement and an outdoor shed. Heating and hotwater 2014 and serviced yearly. Last service Sept 2025. The 0.14-acre lot provides a manageable outdoor space within a friendly community close to parks, Sakima Golf Club, and Salem Community College. The location offers easy access to the NJ Turnpike and I-295, as well as tax-free shopping in nearby Delaware. Please note that the property is being sold in "as-is, where-is" condition. All inspections are for the buyer's information only, and the Certificate of Occupancy will be the buyer's responsibility prior to closing.
ⓘ Source: listings_history table (triggers on properties + properties_extension) + one-shot
backfill from property_details.listing_events for pre-trigger history.
Tax reassessment forecast NJ · Partial reset (capped growth)
- Current annual tax
- $4,093 · $341/mo
- Projected year-2 tax
- $4,412 · $368/mo
- Expected delta
- +$319/yr (+$27/mo · 7.8%)
ⓘ Screening estimate from a state-policy table — verify with the county assessor before closing.
Climate risk First Street
- Flood 6/10 Major FEMA zone X (unshaded) · 57% chance over 30 yrs
- Wildfire 1/10 Low
- Heat 7/10 Severe 7 d/yr ≥104°F today · 15 d/yr by 30 yrs out
- Wind 6/10 Major 27% chance of damaging wind over 30 yrs
- Air quality 3/10 Moderate 3 unhealthy d/yr today · 5 by 30 yrs out
Nearby sold comps map
Loading sold comps map…
Walkable amenities ~0.75 mi
Loading nearby amenities…
Taxation est. · year 1
- Rental income
- $27,844
- − Mortgage interest
- −$10,643
- − Property taxes
- −$4,093
- − Insurance
- −$950
- − Repairs & maintenance
- −$2,227
- − Management
- −$2,227
- − Depreciation
- −$5,527
- Taxable income
- $2,176
- Est. tax owed @ 24.0%
- −$522
- After-tax cash flow
- $4,475/yr
For passive investors: Depreciation is non-cash, so a rental often shows a tax loss while cash-flowing — sheltering income. Rental losses are passive: they offset passive income freely, and up to $25,000/yr can offset ordinary (W-2) income if you actively participate and your MAGI is under $100k (phasing out to $0 by $150k); unused losses carry forward. On sale, claimed depreciation is recaptured at up to 25%, and gains may owe capital-gains tax (a 1031 exchange can defer both). Figures are a year-1 estimate at your 24.0% rate — not tax advice; consult a CPA.
Schools (NCES district)
- District
- Penns Grove-Carneys Point Regional School District
- NCES district ID
- 3412840
- Math proficiency
- 6% ▼ -16.00%
- Reading proficiency
- 21% ▼ -7.00%
- Median HH income
- $44,930
- Composite
- 11.98/100
- National rank
- #9665
- State rank
- #462 of 472 in NJ
Livability — Carneys Point
- Score
- 57/100
- State rank
- #515
- US rank
- #21958
Category grades
Schools grade is shown separately in the Schools card above.
Census & demographics
- Census place
- Carneys Point, NJ
- County
- Salem County · 24,175 people
- City population
- 13,413
- Metro
- Philadelphia-Camden-Wilmington, PA-NJ-DE-MD
- Population (ZIP)
- 13,413
- Household income
- $71,942
- Rent vs Own
- Severe rent burden
- 696.0
Population outlook (Salem County) Hauer SSP2
- Today (2025)
- 59,905 people
- By 2030
- 57,351 · -4.3%
- By 2040
- 51,837 · -13.5%
- By 2050
- 46,356 · -22.6%
- By 2075
- 36,452 · -39.2%
- By 2100
- 28,907 · -51.7%
Race, ethnicity, and origin ACS 2023
- Neighborhood character
- Diverse neighborhood (Simpson 0.65)
- Race & ethnicity
- White 50% Hispanic / Latino 22% Black 22% Two or more races 8% Asian 2%
- Hispanic origin (detail)
- Mexican 5% Puerto Rican 14%
- Common ancestry
- Romanian 3% Slovak 2% Lithuanian 1%
- Foreign-born
- 5% · Canada
- Languages at home
- 85% English-only · Spanish 13% Tagalog/Filipino 1%
Political lean MEDSL · Salem
- 2024 margin
- R (+19.2) · D 39.6% · R 58.8% · Other 1.6%
- 2008→2024 swing
- -23.1pp toward R · 2008: 3.9pp · 2024: -19.2pp
- All cycles
- 2024: R+19.2 2020: R+12.8 2016: R+15.4 2012: D+0.8 2008: D+3.9
Not yet ingested
- Civics
- —
Market trends
- HPI YoY
- ▼ -67.07%
- Current HPI
- 290.3853
- Rent YoY
- —
- Metro
- Philadelphia-Camden-Wilmington, PA-NJ-DE-MD
- State GDP YoY
- ▲ 2.05%
- F500 in state
- 34
Industry mix (Fortune 500 HQ in NJ)
| Industry | F500 HQs | Revenue |
|---|---|---|
| Consumer Goods | 3 | $31B |
|
||
| Pharmaceuticals | 2 | $153B |
|
||
| Technology | 2 | $21B |
|
||
| Insurance | 2 | $20B |
|
||
| Healthcare | 2 | $19B |
|
||
| Financial Services | 1 | $70B |
|
||
Price history
1 event — show timeline
- 2026-04-20 Listed $190,000 BRIGHT MLS
Property tax history
+1.8%/yrLatest (2025): $4,093 · +6.2% YoY. Source: county tax records.
Cash-flow waterfall
monthlySold comps — $/sqft
last 12 mo · ≤1 miLoading sold comps…