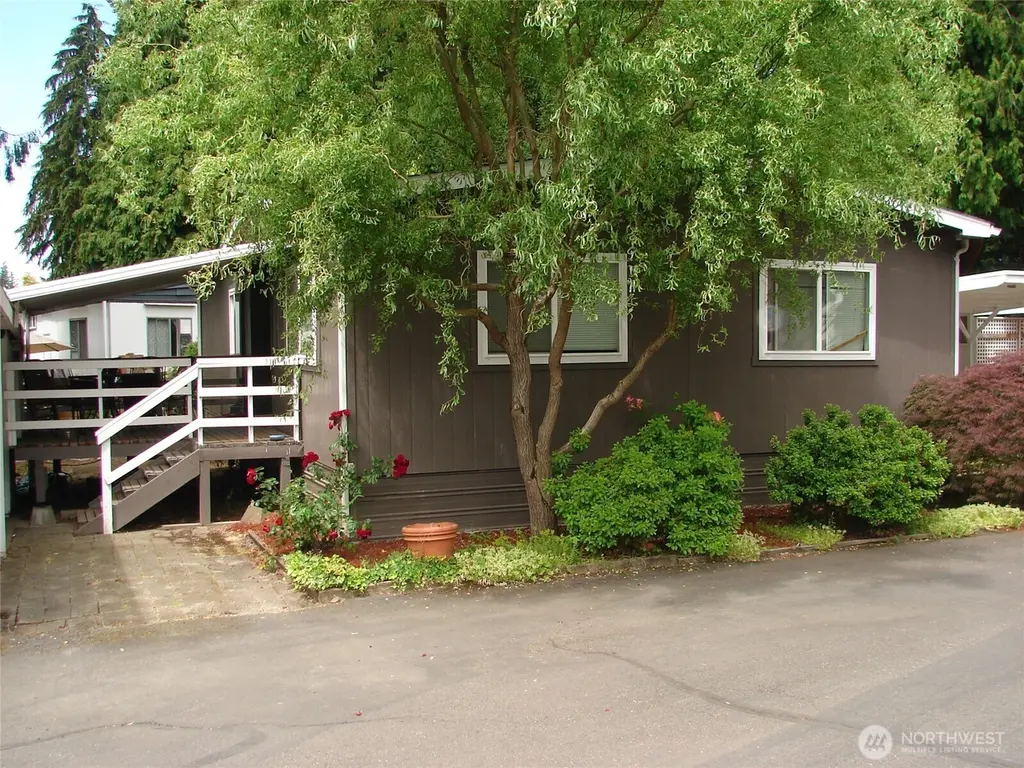
900 29th Ave S Unit C-8 · Auburn, WA
Flood risk 1/10 · Minimal
- FEMA flood zone
- X (unshaded)
- Chance of flooding over 30 yrs
- 0.0%
- Est. flood insurance / yr
- $507 – $1,088
Fire risk 1/10 · Minimal
- Est. fire insurance / yr
- $604 – $1,122
Heat risk 3/10 · Minor
- Hot days now (above 87°F)
- 7 days/yr
- Hot days in 30 yrs
- 14 days/yr
Wind risk 1/10 · Minimal
- Chance of severe wind over 30 yrs
- —
Air-quality risk 7/10 · Major
- Unhealthy air days now
- 10 days/yr
- Unhealthy air days in 30 yrs
- 11 days/yr
Risk factors via First Street. Map © Google.
Why this score? — see what drove the B grade
The composite is a weighted blend of 9 inputs, each scored 0–100. Each bar is that input's sub-score; the figure is the points it added to the 100-point composite (weight × sub-score).
- Cash flow +30.0/30.0
- DSCR +10.0/10.0
- 1% rule +8.7/10.0
- ARV discount +8.2/15.0
- Schools +4.7/10.0
- Livability +4.0/5.0
- Rent growth +2.9/5.0
- Condition / age +2.2/5.0
- Appreciation +0.0/10.0
$127,950
🖨 Deal sheet 📄 Offer letter ✓ Due diligence
Listing remarks
Honey, Stop the car—this is the one we’ve been waiting for! It's a charming 2-bedroom, 2-bath home in the desirable 55+ Community of Skylark Village. This one checks all the boxes, comfort, space, and convenience in a peaceful setting. There are two covered carports, extra parking for guests or additional vehicles, and a separate outbuilding perfect for a workshop, hobbies, storage, or projects. Built in 1982 and ready for your personal touch, this home offers an affordable opportunity to enjoy quiet community living while still having room to spread out. Homes like this don’t come along every day—come see it before it’s gone!
Key facts
- Covered carports
- 2 parking spots
- Built 1982
Tags
Property features AI
Finance
- Financial info: Listing terms: Cash, Conventional, FHA
- HOA & community: Skylark Village park (approximately 137 homes); Land lease: $1,130
Exterior
- Parking: Carport; Uncovered parking
- Utilities: Electric energy; Community water; Power by PSE
- Home design: Manufactured double-wide home; One story; Faces east; Manufactured after 06/15/1976; Mobile home remains
- Construction: Wood construction; Composition roof; Tie-down foundation
- Exterior features: Wood products exterior
Interior
- Kitchen: Dishwasher; Garbage disposal; Microwave; Refrigerator; Stove/Range
- Bedrooms: 2 bedrooms
- Flooring: Laminate
- Bathrooms: 2 full bathrooms; 2 bathtubs
- Interior features: Fireplace (wood burning)
- Laundry & utility: Washer; Dryer
Neighborhood map
What this means for you Summary
Snapshot
- This is a 2-bed/2.0-bath manufactured listed at $128k. Condition is rated fair.
Deal economics
- At list price, monthly cash flow is $504 ($6k/yr) — positive.
- The deal already cash-flows at list — no discount required.
- Meets the 1% rule at list price ($2k rent vs $128k).
- Recommended offer: $124k (3.0% below list) — sets the bar for market timing.
- Cap rate 11.0% vs local median 2.7% in Auburn — top-decile yield for the area; either an underpriced asset or a hidden risk that comps aren't pricing in. Stress-test before assuming the spread holds.
Location & tenants
- Location reads 81/100 on livability (#75 in WA, #1,371 nationally) — a professional / high-income tenant draw. Strengths: amenities A+, commute A+, employment A+; Watch: crime F, cost of living F.
- Auburn School District (urban): math 47% / reading 56% proficiency, ranked #125 of 291 in WA (top 43%) — acceptable for families but not a draw, mixed tenant base, ~2y average lease.
- Market conditions: Rents rising (+1.5%/yr); 171 active listings in the ZIP; 15 comparable units currently listed for rent nearby; rentals leasing fast (median 5d on market — plan ~1-2 weeks tenant-placement turnaround); solid renter incomes; 10,555 units permitted in King County in 2024 (7,119 in 5+ unit buildings).
Forward outlook
- Local home prices are declining (-3.0%/yr); year-one equity from $884 of loan paydown is wiped out by about $4k of value loss. Plan a longer hold.
- King County population projected at +44% by 2050 — long-run rental-demand tailwind backs the buy-and-hold thesis.
- At projected returns (-3.0% appreciation + 1.5% rent growth), your $36k cash investment doubles in ~9 years — after that, you're playing with house money.
Negotiation context
- It's been on market 59 days — a 3% lower offer ($124k) is reasonable based on typical stale-listing flexibility.
Questions for the listing agent
- It's been on market 59 days. Have you received any prior offers? Is the seller open to a 3% concession, seller financing, or rate buy-down credit?
- Have any recent inspections been done? Can we get a copy of the seller's disclosures and any deferred-maintenance estimates?
- Is there a deadline driving the sale (1031 exchange, divorce, estate, relocation)? That informs how much negotiation room exists.
- Crime grade is F in this area — have there been break-ins, vandalism, or insurance claims at this property in the last 3 years? What carrier currently insures it and at what premium?
- What's the average days-on-market for RENTAL listings here right now (not sales)? A rising rental-DOM trend means longer vacancies and softer asking-rent achievability than the comps imply.
- What's the recent tenant-quality profile in this submarket — average credit score on applications, eviction rate, late-payment / NSF rate, and stable-employment percentage? A property-management company in the area should have these aggregated.
- How much new for-sale + rental construction is in the pipeline within 1–3 miles? Heavy new supply typically softens prices + rents 12–24 months out; constrained supply supports both.
Investment metrics
- 1% rule
- 1.37% ✓
- Cap rate
- 11.02%
- Cash-on-cash
- 16.89%
- DSCR
- 1.75
- GRM
- 6.1
CMA / ARV
- ARV (on-the-fly)
- $129,888
- Comps found
- 12
Show comp detail 12 sales within ~0.75 mi
| Address | Dist | Beds/Ba | Sqft | Sold | Price | $/sf | Match |
|---|---|---|---|---|---|---|---|
| 800 29 TH St SE Unit G-12 | 0.11mi | 2/1.0 | 980 (-7%) | 0mo | $86,000 | $88 | 79 |
| 900 29th St SE Unit D-11 | 0.06mi | 3/2.0 (+1) | 960 (-9%) | 3mo | $71,750 | $75 | 75 |
| 607 37th St SE #77 | 0.42mi | 3/2.0 (+1) | 1,120 (+6%) | 4mo | $135,000 | $121 | 62 |
| 3225 M St SE #131 | 0.19mi | 2/2.0 | 900 (-15%) | 8mo | $105,000 | $117 | 60 |
| 707 37th St SE #73 | 0.43mi | 2/2.0 | 1,152 (+9%) | 9mo | $130,000 | $113 | 58 |
| 401 37th St SE #110 | 0.41mi | 3/1.0 (+1) | 980 (-7%) | 3mo | $127,000 | $130 | 58 |
| 2902 B St SE | 0.46mi | 3/2.0 (+1) | 1,152 (+9%) | 4mo | $312,500 | $271 | 55 |
| 401 37th St SE #112 | 0.49mi | 3/2.0 (+1) | 980 (-7%) | 11mo | $134,000 | $137 | 51 |
| 707 37 St SE #62 | 0.43mi | 3/2.0 (+1) | 1,152 (+9%) | 11mo | $169,000 | $147 | 51 |
| 210 37th St SE #64 | 0.68mi | 2/2.0 | 960 (-9%) | 7mo | $72,000 | $75 | 47 |
| 607 37th St SE #92 | 0.41mi | 3/2.0 (+1) | 1,200 (+14%) | 11mo | $147,250 | $123 | 44 |
| 418 37th St SE | 0.53mi | 3/2.0 (+1) | 924 (-12%) | 8mo | $225,000 | $244 | 43 |
Match score weights: distance 35% · size 25% · config 20% · recency 20%. Top-matched comps best support the ARV.
Projected returns pro-forma
-3.0% appreciation · 1.51% rent growth · sell at horizon
- IRR
- 6.4%
- Equity multiple
- 1.25×
- Total profit
- $8,816
- Equity at exit
- $19,078
- IRR
- 14.4%
- Equity multiple
- 2.08×
- Total profit
- $38,803
- Equity at exit
- $11,063
Cash invested: $35,826 (down + closing). Projections, not guarantees.
Landlord ↔ Tenant lean methodology
- Overall (STATE)
- 28 Tenant-Leaning
- State Washington
- 28 Tenant-Leaning · D+8
- County
- — inherits STATE
- City
- — inherits STATE
ZIP-level market 98002
- Rents YoY
- 1.5%
- Active inventory
- 171
- Price-to-rent
- 6.1×
Monthly cashflow live
- Estimated rent
- $1,758 high interval (Pro) →
- Mortgage (P&I)
- −$671
- Tax est. 1.5%
- −$160 /mo · $1,919/yr
- Insurance
- −$53
- HOA
- −$0
- Vacancy / Maint / Mgmt
- −$369
- Net cashflow
- $504
Break-even live
UW: 25.0% down · 7.5% · 30yr · 1.5% tax · 5.0% vac · 8.0% maint · 8.0% mgmt
Financing live
Cash to close
- Down payment
- $31,988
- Closing costs
- $3,838
- Reserves months
- —
- Total cash needed
- —
Loan-product check · same deal, 3 products live
Conventional
25% down · 7.5% · 30yr
- Down + closing
- —
- Monthly P&I
- —
- Monthly cashflow
- —
- DSCR
- —
- Eligible?
- —
Personal DTI + credit; lowest rate.
DSCR
20% down · 8.5% · 30yr
- Down + closing
- —
- Monthly P&I
- —
- Monthly cashflow
- —
- DSCR
- —
- Eligible?
- —
No personal income docs; deal must DSCR.
Hard money
10% down · 12.0% · 12mo
- Down + closing
- —
- Monthly P&I
- —
- Monthly cashflow
- —
- DSCR
- —
- Eligible?
- —
Short-term bridge; refi at stabilization.
Rent comps 15 comps
| Address | Beds | Baths | Sqft | Rent | $/sqft | DOM | Units | Dist |
|---|---|---|---|---|---|---|---|---|
| 2952 O St SE Unit F Auburn, WA | 2.0 | 1.0 | 1051 | $1,495 | $1.42 | 1d | 1 | 0.31mi |
| 2952 O St SE Unit D Auburn, WA | 2.0 | 1.0 | 795 | $1,375 | $1.73 | 1d | 1 | 0.31mi |
| 404 27th St SE Unit 19-1 Auburn, WA | 2.0 | 1.0 | 1000 | $1,750 | $1.75 | 12d | 1 | 0.35mi |
| 1526 29th St SE Auburn, WA | 2.0 | 1.0 | 912 | $1,595 | $1.75 | 24d | 1 | 0.38mi |
| 1120 37th St SE Auburn, WA | 2.0 | 1.0 | 788 | $1,695 | $2.15 | 12d | 1 | 0.43mi |
| 2455 F St SE Auburn, WA | 1.0–3.0 | 1.0–2.0 | 757 | $1,678 | $2.21 | 2d | 6 | 0.43mi |
| 1014 37th St SE Apt 4 Auburn, WA | 2.0 | 2.0 | 1005 | $1,780 | $1.77 | 4d | 1 | 0.44mi |
| 402 21st St SE Auburn, WA | 1.0–2.0 | 1.0–1.5 | 747 | $1,695 | $2.27 | 14d | 4 | 0.60mi |
| 2020 F St SE Auburn, WA | 1.0–2.0 | 1.0 | 725 | $1,599 | $2.21 | 24d | 1 | 0.63mi |
| 418 17th St SE Unit 6C Auburn, WA | 2.0 | 2.0 | 1219 | $2,200 | $1.80 | 24d | 1 | 0.77mi |
| 1420 17th St SE Auburn, WA | 1.0–2.0 | 1.0 | 725 | $1,695 | $2.34 | 2d | 4 | 0.87mi |
| 4704 Mill Pond Dr SE #213 Auburn, WA | 2.0 | 2.0 | 1142 | $2,750 | $2.41 | 2d | 1 | 0.97mi |
| 732 4th Ave NE Pacific, WA | 2.0 | 1.0 | 850 | $1,805 | $2.12 | 4d | 2 | 1.02mi |
| 703 47th St SE Auburn, WA | 2.0 | 1.0–2.0 | 781 | $1,970 | $2.52 | 1d | 7 | 1.10mi |
| 2901 Auburn Way S Auburn, WA | 1.0–2.0 | 1.0 | 667 | $2,175 | $3.26 | 1d | 20 | 1.28mi |
Listing history 15 events
-
2026-06-18days on market $127,950 Active 59 DOM
-
2026-06-17days on market $127,950 Active 58 DOM
-
2026-06-16days on market $127,950 Active 57 DOM
-
2026-06-15days on market $127,950 Active 56 DOM
-
2026-06-13days on market $127,950 Active 54 DOM
-
2026-06-13days on market $127,950 Active 53 DOM
-
2026-06-09days on market $127,950 Active 50 DOM
-
2026-06-08days on market $127,950 Active 49 DOM
-
2026-06-07days on market $127,950 Active 48 DOM
-
2026-06-04days on market $127,950 Active 45 DOM
-
2026-06-03days on market $127,950 Active 44 DOM
-
2026-06-02days on market $127,950 Active 43 DOM
-
2026-06-01days on market $127,950 Active 42 DOM
-
2026-05-31days on market $127,950 Active 41 DOM
-
2026-04-20$134,950 Active
ⓘ Source: listings_history table (triggers on properties + properties_extension) + one-shot
backfill from property_details.listing_events for pre-trigger history.
Climate risk First Street
- Flood 1/10 Low FEMA zone X (unshaded) · 0% chance over 30 yrs
- Wildfire 1/10 Low
- Heat 3/10 Moderate 7 d/yr ≥87°F today · 14 d/yr by 30 yrs out
- Wind 1/10 Low
- Air quality 7/10 Severe 10 unhealthy d/yr today · 11 by 30 yrs out
Nearby sold comps map
Loading sold comps map…
Walkable amenities ~0.75 mi
Loading nearby amenities…
Taxation est. · year 1
- Rental income
- $21,092
- − Mortgage interest
- −$7,167
- − Property taxes
- −$1,919
- − Insurance
- −$640
- − Repairs & maintenance
- −$1,687
- − Management
- −$1,687
- − Depreciation
- −$3,722
- Taxable income
- $4,269
- Est. tax owed @ 24.0%
- −$1,024
- After-tax cash flow
- $5,027/yr
For passive investors: Depreciation is non-cash, so a rental often shows a tax loss while cash-flowing — sheltering income. Rental losses are passive: they offset passive income freely, and up to $25,000/yr can offset ordinary (W-2) income if you actively participate and your MAGI is under $100k (phasing out to $0 by $150k); unused losses carry forward. On sale, claimed depreciation is recaptured at up to 25%, and gains may owe capital-gains tax (a 1031 exchange can defer both). Figures are a year-1 estimate at your 24.0% rate — not tax advice; consult a CPA.
Condition & rehab AI · 12 photos
This 2-bedroom, 2-bath home in Skylark Village requires moderate renovations to improve its curb appeal and interior aesthetics, increasing its resale and rental value.
Repairs flagged
- Moderate Kitchen cabinets — Dated appearance
- Moderate Bathroom fixtures — Basic and dated
- Major Flooring — Worn and in need of refinishing or replacement
- Moderate Paint — Faded in some areas
Value-add opportunities
- Both Painting and updating kitchen cabinets — Enhances curb appeal and interior aesthetics
- Both Updating bathroom fixtures — Improves functionality and aesthetics
- Both Floor refinishing or replacement — Enhances overall appearance and value
- Both Landscaping improvements — Enhances curb appeal and property value
Renovation cost estimate screening
| Repair item | Severity | Est. cost |
|---|---|---|
| Kitchen cabinets · Dated appearance | Moderate | $3,000–15,000 |
| Bathroom fixtures · Basic and dated | Moderate | $3,000–15,000 |
| Flooring · Worn and in need of refinishing or replacement | Major | $15,000–50,000 |
| Paint · Faded in some areas | Moderate | $3,000–15,000 |
| Total estimated repair cost · 4 items | $24,000–95,000 |
Value-add ROI direction
- Both Painting and updating kitchen cabinets — Enhances curb appeal and interior aesthetics ↑
- Both Updating bathroom fixtures — Improves functionality and aesthetics ↑
- Both Floor refinishing or replacement — Enhances overall appearance and value ↑
- Both Landscaping improvements — Enhances curb appeal and property value ↑
ⓘ Cost ranges are severity-bucket heuristics (US national rule-of-thumb). Get contractor quotes + a written scope before underwriting a rehab budget.
Schools (NCES district)
- District
- Auburn School District
- NCES district ID
- 5300300
- Math proficiency
- 47% ▼ -3.00%
- Reading proficiency
- 56% ▼ -1.00%
- Median HH income
- $58,048
- Composite
- 46.73/100
- National rank
- #5240
- State rank
- #125 of 291 in WA
Livability — Auburn
- Score
- 81/100
- State rank
- #75
- US rank
- #1371
Category grades
Schools grade is shown separately in the Schools card above.
Census & demographics
- Census place
- Auburn, WA
- County
- King County · 2,251,916 people
- City population
- 74,969
- Metro
- Seattle-Tacoma-Bellevue, WA
- Population (ZIP)
- 37,509
- Household income
- $78,684
- Rent vs Own
- Severe rent burden
- 2202.0
Population outlook (King County) Hauer SSP2
- Today (2025)
- 2,576,485 people
- By 2030
- 2,803,316 · +8.8%
- By 2040
- 3,255,921 · +26.4%
- By 2050
- 3,706,444 · +43.9%
- By 2075
- 4,746,063 · +84.2%
- By 2100
- 5,407,730 · +109.9%
Race, ethnicity, and origin ACS 2023
- Neighborhood character
- Highly diverse neighborhood (Simpson 0.72)
- Race & ethnicity
- White 46% Hispanic / Latino 24% Two or more races 13% Black 12% Asian 6% Pacific Islander 4% Native American 2%
- Hispanic origin (detail)
- Mexican 20%
- Common ancestry
- Portuguese 4% Subsaharan African 4% Lithuanian 3%
- Foreign-born
- 24% · Canada, Vietnam
- Languages at home
- 63% English-only · Spanish 19% Russian/Polish/Slavic 6% Other Asian/Pacific 3%
Political lean MEDSL · King
- 2024 margin
- Solid D (+51.7) · D 74.2% · R 22.5% · Other 3.4%
- 2008→2024 swing
- +9.6pp toward D · 2008: 42.1pp · 2024: 51.7pp
- All cycles
- 2024: D+51.7 2020: D+52.7 2016: D+50.4 2012: D+39.9 2008: D+42.1
Not yet ingested
- Civics
- —
Market trends
- HPI YoY
- ▼ -677.96%
- Current HPI
- 298.0849
- Rent YoY
- ▲ 1.51%
- Metro
- Seattle-Tacoma-Bellevue, WA
- State GDP YoY
- ▲ 4.65%
- F500 in state
- 22
Industry mix (Fortune 500 HQ in WA)
| Industry | F500 HQs | Revenue |
|---|---|---|
| Retail | 2 | $269B |
|
||
| Technology / Retail | 1 | $638B |
|
||
| Technology | 1 | $245B |
|
||
| Telecommunications | 1 | $38B |
|
||
| Food / Beverage | 1 | $36B |
|
||
| Automotive / Trucks | 1 | $34B |
|
||
Price history
1 event — show timeline
- 2026-04-20 Listed $134,950 NWMLS as Distributed by MLS Grid
Cash-flow waterfall
monthlySold comps — $/sqft
last 12 mo · ≤1 miLoading sold comps…