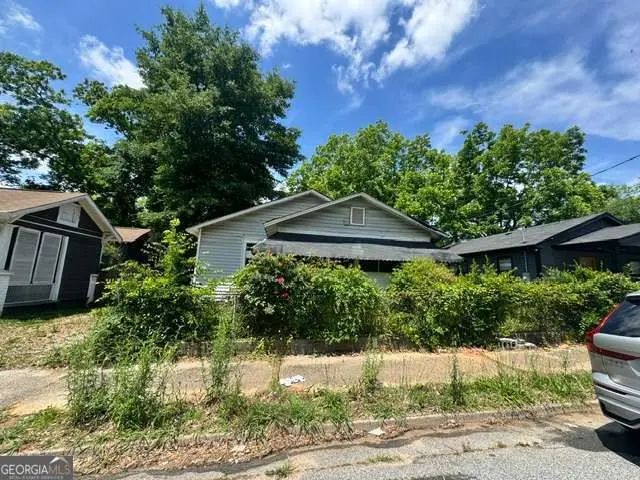
1049 Smith St SW · Atlanta, GA
Flood risk 3/10 · Minor
- FEMA flood zone
- X (unshaded)
- Chance of flooding over 30 yrs
- 0.1%
- Est. flood insurance / yr
- $473 – $860
Fire risk 1/10 · Minimal
- Est. fire insurance / yr
- $963 – $1,789
Heat risk 5/10 · Moderate
- Hot days now (above 104°F)
- 7 days/yr
- Hot days in 30 yrs
- 18 days/yr
Wind risk 4/10 · Minor
- Chance of severe wind over 30 yrs
- 24.0%
Air-quality risk 4/10 · Minor
- Unhealthy air days now
- 4 days/yr
- Unhealthy air days in 30 yrs
- 6 days/yr
Risk factors via First Street. Map © Google.
Why this score? — see what drove the B grade
The composite is a weighted blend of 9 inputs, each scored 0–100. Each bar is that input's sub-score; the figure is the points it added to the 100-point composite (weight × sub-score).
- Cash flow +30.0/30.0
- 1% rule +10.0/10.0
- DSCR +10.0/10.0
- ARV discount +7.5/15.0
- Livability +4.2/5.0
- Rent growth +3.2/5.0
- Schools +2.7/10.0
- Condition / age +2.5/5.0
- Appreciation +0.0/10.0
$100,000
🖨 Deal sheet 📄 Offer letter ✓ Due diligence
Listing remarks MLS
A solid opportunity in a growing neighborhood. This 1930s home needs renovation but has strong bones and plenty of upside. Ideal for investors, builders, or buyers looking for a project with long-term potential. Conveniently located near the BeltLine, parks, and transit, it's an excellent opportunity to bring your vision to life.
Key facts
- Growing neighborhood
- Near the beltline
- Near transit
Tags
Property features AI
Exterior
- Parking: Driveway parking; Open parking available
- Utilities: Public water; Public sewer; Electric listed as other/unspecified; Other utilities
- Home design: One-level home; Resale property
- Construction: Construction materials listed as other/unspecified; Roof listed as other/unspecified
- Exterior features: Front porch; Other exterior structures
Interior
- Kitchen: Kitchen with other/unspecified features; Appliances listed as other/unspecified
- Bedrooms: Three main-level bedrooms
- Flooring: Flooring listed as other/unspecified
- Bathrooms: One full bathroom on the main level; Master bath with other/unspecified features
- Heating & cooling: Heating listed as other/unspecified; Cooling listed as other/unspecified
- Interior features: No common walls; Crawl space
- Laundry & utility: Laundry with other/unspecified features
Neighborhood map
What this means for you Summary
Snapshot
- This is a 3-bed/1.0-bath single-family listed at $100k.
Deal economics
- At list price, monthly cash flow is $820 ($10k/yr) — positive.
- The deal already cash-flows at list — no discount required.
- Meets the 1% rule at list price ($2k rent vs $100k).
- Recommended offer: $98k (1.5% below list) — sets the bar for market timing.
Location & tenants
- Location reads 83/100 on livability (#6 in GA, #919 nationally) — a professional / high-income tenant draw. Strengths: amenities A+, commute A+, housing A+; Watch: cost of living C-.
- Atlanta Public Schools (urban): math 28% / reading 35% proficiency, ranked #80 of 174 in GA (top 46%) — families likely to look elsewhere, expect single-tenant / working-renter base with shorter leases; 71% free/reduced lunch — lower-income household profile, screen leases tightly.
- Zoned schools: Herman J. Russell West End Academy (math 12% / reading 12%, grade F, #417 of 470 statewide, top 90%, 399 students, 100% FRL); Booker T. Washington High School (math 24% / reading 24%, grade F, #184 of 424 statewide, top 48%, 831 students, 100% FRL) — zoned schools average 100% FRL vs 71% district-wide (29 pts higher); higher-poverty schools than district average — tighter screening recommended.
- Zoned-school proficiency averages 18% at this address vs 32% district-wide (-13 pts) — the specific schools serving this property underperform the Atlanta Public Schools average; the district grade overstates school quality for this exact location.
- Market conditions: Rents rising (+2.8%/yr); 452 active listings in the ZIP; 40 comparable units currently listed for rent nearby; rentals at typical pace (median 24d on market — plan ~3-4 weeks tenant-placement turnaround); 11,565 units permitted in Fulton County in 2024 (8,159 in 5+ unit buildings).
Forward outlook
- Local home prices are declining (-3.0%/yr); year-one equity from $691 of loan paydown is wiped out by about $3k of value loss. Plan a longer hold.
- Fulton County population projected at +38% by 2050 — long-run rental-demand tailwind backs the buy-and-hold thesis.
- At projected returns (-3.0% appreciation + 2.8% rent growth), your $28k cash investment doubles in ~4 years — after that, you're playing with house money.
Negotiation context
- It's been on market 29 days — a 2% lower offer ($98k) is reasonable based on typical stale-listing flexibility.
- 2 sale attempts; this cycle's ask has dropped $19k (16%) from the opening price — seller is motivated, your offer sets the floor, not the list.
- Current owner paid $20k; list at $100k implies a 413% gain — meaningful room to come down on a strong offer.
Risks & watch-outs
- Watch-outs: built in 1930 — expect roof / HVAC / electrical / plumbing capex.
- Climate carrying-cost: extreme-heat days projected 7→18/yr by 2055 (HVAC capex compounding) — expect insurance premiums to compound above CPI over the hold.
Questions for the listing agent
- Built in 1930 — when were the roof, HVAC, electrical panel, plumbing, and water heater last replaced?
- Is there a deadline driving the sale (1031 exchange, divorce, estate, relocation)? That informs how much negotiation room exists.
- What's the average days-on-market for RENTAL listings here right now (not sales)? A rising rental-DOM trend means longer vacancies and softer asking-rent achievability than the comps imply.
- What's the recent tenant-quality profile in this submarket — average credit score on applications, eviction rate, late-payment / NSF rate, and stable-employment percentage? A property-management company in the area should have these aggregated.
- How much new for-sale + rental construction is in the pipeline within 1–3 miles? Heavy new supply typically softens prices + rents 12–24 months out; constrained supply supports both.
Investment metrics
- 1% rule
- 1.91% ✓
- Cap rate
- 16.13%
- Cash-on-cash
- 35.13%
- DSCR
- 2.56
- GRM
- 4.4
CMA / ARV
- ARV (on-the-fly)
- $236,544
- Comps found
- 12
Show comp detail 12 sales within ~0.75 mi
| Address | Dist | Beds/Ba | Sqft | Sold | Price | $/sf | Match |
|---|---|---|---|---|---|---|---|
| 1143 Windsor St SW | 0.21mi | 3/1.0 | 1,008 (+12%) | 2mo | $99,000 | $98 | 68 |
| 997 Ira St SW | 0.11mi | 3/2.0 | 1,014 (+13%) | 4mo | $109,000 | $107 | 66 |
| 490 Rockwell St SW | 0.41mi | 2/2.0 (-1) | 936 (+4%) | 2mo | $179,900 | $192 | 63 |
| 1090 Ira St SW | 0.10mi | 2/1.0 (-1) | 1,008 (+12%) | 8mo | $99,999 | $99 | 63 |
| 913 Smith St SW | 0.26mi | 2/2.5 (-1) | 806 (-10%) | 0mo | $75,000 | $93 | 60 |
| 953 Garibaldi St SW | 0.21mi | 3/2.0 | 1,003 (+12%) | 8mo | $265,000 | $264 | 60 |
| 935 Smith St SW | 0.22mi | 2/2.0 (-1) | 835 (-7%) | 14mo | $285,000 | $341 | 58 |
| 1002 Ira St SW | 0.11mi | 2/1.0 (-1) | 768 (-14%) | 11mo | $163,000 | $212 | 56 |
| 1065 Mcdaniel St SW | 0.06mi | 3/2.0 | 1,026 (+14%) | 18mo | $285,000 | $278 | 54 |
| 531 Roy St SW | 0.28mi | 3/2.0 | 1,003 (+12%) | 12mo | $275,000 | $274 | 53 |
| 453 Mary St SW | 0.25mi | 2/2.0 (-1) | 1,000 (+12%) | 13mo | $295,000 | $295 | 50 |
| 530 Erin Ave SW | 0.52mi | 3/2.0 | 1,010 (+13%) | 7mo | $299,900 | $297 | 45 |
Match score weights: distance 35% · size 25% · config 20% · recency 20%. Top-matched comps best support the ARV.
Projected returns pro-forma
-3.0% appreciation · 2.77% rent growth · sell at horizon
- IRR
- 30.4%
- Equity multiple
- 2.27×
- Total profit
- $35,587
- Equity at exit
- $14,910
- IRR
- 37.6%
- Equity multiple
- 4.45×
- Total profit
- $96,524
- Equity at exit
- $8,646
Cash invested: $28,000 (down + closing). Projections, not guarantees.
Landlord ↔ Tenant lean methodology
- Overall (STATE)
- 90 Strongly Landlord-Friendly
- State Georgia
- 90 Strongly Landlord-Friendly · R+3
- County
- — inherits STATE
- City
- — inherits STATE
ZIP-level market 30310
- Home prices YoY
- -32.8%
- Rents YoY
- 2.8%
- Active inventory
- 452
- Price-to-rent
- 4.4×
Monthly cashflow live
- Estimated rent
- $1,912 high interval (Pro) →
- Mortgage (P&I)
- −$524
- Tax est. 1.5%
- −$125 /mo · $1,500/yr
- Insurance
- −$42
- HOA
- −$0
- Vacancy / Maint / Mgmt
- −$402
- Net cashflow
- $820
Break-even live
UW: 25.0% down · 7.5% · 30yr · 1.5% tax · 5.0% vac · 8.0% maint · 8.0% mgmt
Financing live
Cash to close
- Down payment
- $25,000
- Closing costs
- $3,000
- Reserves months
- —
- Total cash needed
- —
Loan-product check · same deal, 3 products live
Conventional
25% down · 7.5% · 30yr
- Down + closing
- —
- Monthly P&I
- —
- Monthly cashflow
- —
- DSCR
- —
- Eligible?
- —
Personal DTI + credit; lowest rate.
DSCR
20% down · 8.5% · 30yr
- Down + closing
- —
- Monthly P&I
- —
- Monthly cashflow
- —
- DSCR
- —
- Eligible?
- —
No personal income docs; deal must DSCR.
Hard money
10% down · 12.0% · 12mo
- Down + closing
- —
- Monthly P&I
- —
- Monthly cashflow
- —
- DSCR
- —
- Eligible?
- —
Short-term bridge; refi at stabilization.
Rent comps 40 comps
| Address | Beds | Baths | Sqft | Rent | $/sqft | DOM | Units | Dist |
|---|---|---|---|---|---|---|---|---|
| 1187 McDaniel St SW Unit B Atlanta, GA | 2.0 | 1.0 | 1038 | $1,025 | $0.99 | 12d | 1 | 0.25mi |
| 1180 Sims St SW Atlanta, GA | 2.0 | 1.0 | 772 | $1,100 | $1.42 | 24d | 1 | 0.26mi |
| 1133 Mayland Cir SW Atlanta, GA | 3.0 | 2.0 | 1120 | $3,600 | $3.21 | 24d | 1 | 0.32mi |
| 600 Mayland Ave SW Atlanta, GA | 3.0 | 2.0 | 1100 | $2,300 | $2.09 | 24d | 1 | 0.37mi |
| 840 Smith St SW Unit A Atlanta, GA | 2.0 | 1.5 | 910 | $1,550 | $1.70 | 16d | 1 | 0.42mi |
| 518 Erin Ave SW Atlanta, GA | 2.0 | 1.0 | 1075 | $2,500 | $2.33 | 18d | 1 | 0.49mi |
| 776 Metropolitan Pkwy SW Atlanta, GA | 2.0–3.0 | 2.0–3.0 | 1212 | $2,410 | $1.99 | 1d | 6 | 0.64mi |
| 404 Bass St SW Atlanta, GA | 3.0 | 2.0 | 1080 | $1,850 | $1.71 | 16d | 1 | 0.66mi |
| 1246 Allene Ave SW Atlanta, GA | 2.0 | 1.0–2.0 | 896 | $2,110 | $2.35 | 1d | 23 | 0.68mi |
| 1056 Hank Aaron Dr SW Atlanta, GA | 1.0–2.0 | 1.0 | 753 | $1,139 | $1.51 | 7d | 6 | 0.77mi |
| 865 Hank Aaron Dr SE Unit 103 Atlanta, GA | 2.0 | 1.0 | 650 | $1,250 | $1.92 | 24d | 1 | 0.81mi |
| 875 Hank Aaron Dr SW Atlanta, GA | 1.0–3.0 | 1.0–2.0 | 916 | $1,688 | $1.84 | 24d | 1 | 0.81mi |
| 806 Murphy Ave SW Atlanta, GA | 1.0–2.0 | 1.0 | 825 | $1,254 | $1.52 | 24d | 8 | 0.82mi |
| 1483 Arthur Langford Jr Pl SW Atlanta, GA | 1.0–2.0 | 1.0 | 825 | $900 | $1.09 | 24d | 7 | 0.85mi |
| 72 Milton Ave SE Atlanta, GA | 2.0 | 1.0–2.0 | 818 | $2,107 | $2.57 | 1d | 24 | 0.88mi |
| 174 Moury Ave SW Atlanta, GA | 1.0–3.0 | 1.0–2.0 | 926 | $1,728 | $1.87 | 2d | 6 | 0.90mi |
| 825 Hank Aaron Dr SW Atlanta, GA | 2.0 | 2.0 | 861 | $1,470 | $1.71 | 24d | 1 | 0.92mi |
| 825 Erin Ave SW Atlanta, GA | 2.0 | 1.0 | 776 | $3,000 | $3.87 | 24d | 1 | 0.92mi |
| 561 Formwalt St SW Atlanta, GA | 2.0 | 2.0 | 1000 | $1,600 | $1.60 | 24d | 1 | 0.97mi |
| 125 Milton Ave SE Atlanta, GA | 2.0 | 1.0–2.0 | 965 | $2,494 | $2.58 | 1d | 29 | 0.97mi |
| 720 Hank Aaron Dr SE Atlanta, GA | 2.0 | 1.0–2.0 | 847 | $2,219 | $2.62 | 2d | 24 | 1.00mi |
| 717 Lee St SW Atlanta, GA | 1.0–2.0 | 1.0 | 768 | $1,416 | $1.84 | 2d | 5 | 1.02mi |
| 1534 Beatie Ave SW Atlanta, GA | 3.0 | 2.0 | 1050 | $2,050 | $1.95 | 24d | 1 | 1.03mi |
| 565 Hank Aaron Dr SW Atlanta, GA | 1.0–3.0 | 1.0–2.0 | 1139 | $3,070 | $2.70 | 2d | 23 | 1.12mi |
| 396 Rawson St SW Unit 12 Atlanta, GA | 2.0 | 1.0 | 675 | $2,100 | $3.11 | 4d | 1 | 1.16mi |
| 818 Peeples St SW Atlanta, GA | 2.0 | 1.0 | 936 | $1,500 | $1.60 | 24d | 1 | 1.20mi |
| 222 Tuskegee St SE Atlanta, GA | 2.0–3.0 | 1.0–2.0 | 1202 | $1,525 | $1.27 | 24d | 6 | 1.20mi |
| 91 Thirkield Ave SE Atlanta, GA | 2.0 | 1.0 | 1092 | $1,995 | $1.83 | 24d | 1 | 1.21mi |
| 95 Thirkield Ave SE Atlanta, GA | 3.0 | 2.0 | 1096 | $1,850 | $1.69 | 16d | 1 | 1.21mi |
| 207 South Ave SE Atlanta, GA | 2.0 | 1.0 | 750 | $1,977 | $2.64 | 24d | 1 | 1.22mi |
| 1777 Bond Dr SW Atlanta, GA | 4.0 | 1.5 | 1043 | $1,999 | $1.92 | 24d | 1 | 1.25mi |
| 1455 Jonesboro Rd SE Atlanta, GA | 2.0 | 1.0 | 700 | $2,000 | $2.86 | 24d | 1 | 1.27mi |
| 973 Lawton St SW Atlanta, GA | 3.0 | 1.0 | 912 | $1,575 | $1.73 | 7d | 1 | 1.31mi |
| 1734 Cahoon St SW Atlanta, GA | 3.0 | 1.0 | 950 | $1,800 | $1.89 | 24d | 1 | 1.33mi |
| 346 Peters St SW #102 Atlanta, GA | 2.0 | 1.0 | 1080 | $3,150 | $2.92 | 18d | 1 | 1.33mi |
| 200 Guerin Rd Holly Springs, NC | 2.0–3.0 | 1.0–1.5 | 947 | $1,349 | $1.42 | 22d | 1 | 1.36mi |
| 1084 Cordova St SW Atlanta, GA | 2.0 | 1.0 | 750 | $1,295 | $1.73 | 18d | 1 | 1.43mi |
| 1780 Cahoon St SW Atlanta, GA | 2.0 | 1.0 | 700 | $1,100 | $1.57 | 24d | 1 | 1.43mi |
| 1782 Cahoon St SW Atlanta, GA | 2.0 | 1.0 | 700 | $1,100 | $1.57 | 24d | 1 | 1.44mi |
| 600 Greensferry Ave SW Atlanta, GA | 1.0–3.0 | 1.0–2.0 | 949 | $1,590 | $1.68 | 7d | 16 | 1.44mi |
Listing history 18 events
-
2026-06-18days on market $100,000 Active 29 DOM
-
2026-06-17days on market $100,000 Active 28 DOM
-
2026-06-16days on market $100,000 Active 27 DOM
-
2026-06-15days on market $100,000 Active 26 DOM
-
2026-06-13days on market $100,000 Active 24 DOM
-
2026-06-13pricedays on market $100,000 Active 23 DOM
-
2026-06-09days on market $119,000 Active 20 DOM
-
2026-06-08days on market $119,000 Active 19 DOM
-
2026-06-07days on market $119,000 Active 18 DOM
-
2026-06-04days on market $119,000 Active 15 DOM
-
2026-06-03days on market $119,000 Active 14 DOM
-
2026-06-02days on market $119,000 Active 13 DOM
-
2026-06-01days on market $119,000 Active 12 DOM
-
2026-05-31days on market $119,000 Active 11 DOM
-
2026-05-19$119,000 Active
Show marketing remark (331 chars)
A solid opportunity in a growing neighborhood. This 1930s home needs renovation but has strong bones and plenty of upside. Ideal for investors, builders, or buyers looking for a project with long-term potential. Conveniently located near the BeltLine, parks, and transit, it's an excellent opportunity to bring your vision to life.
-
2026-05-19$119,000 New 331-char remark
Show marketing remark (331 chars)
A solid opportunity in a growing neighborhood. This 1930s home needs renovation but has strong bones and plenty of upside. Ideal for investors, builders, or buyers looking for a project with long-term potential. Conveniently located near the BeltLine, parks, and transit, it's an excellent opportunity to bring your vision to life.
-
1991-03-13soldstatus $19,500
-
1980-07-18soldstatus $9,500
ⓘ Source: listings_history table (triggers on properties + properties_extension) + one-shot
backfill from property_details.listing_events for pre-trigger history.
Climate risk First Street
- Flood 3/10 Moderate FEMA zone X (unshaded) · 10% chance over 30 yrs
- Wildfire 1/10 Low
- Heat 5/10 Major 7 d/yr ≥104°F today · 18 d/yr by 30 yrs out
- Wind 4/10 Moderate 24% chance of damaging wind over 30 yrs
- Air quality 4/10 Moderate 4 unhealthy d/yr today · 6 by 30 yrs out
Nearby sold comps map
Loading sold comps map…
Walkable amenities ~0.75 mi
Loading nearby amenities…
Taxation est. · year 1
- Rental income
- $22,948
- − Mortgage interest
- −$5,602
- − Property taxes
- −$1,500
- − Insurance
- −$500
- − Repairs & maintenance
- −$1,836
- − Management
- −$1,836
- − Depreciation
- −$2,909
- Taxable income
- $8,766
- Est. tax owed @ 24.0%
- −$2,104
- After-tax cash flow
- $7,732/yr
For passive investors: Depreciation is non-cash, so a rental often shows a tax loss while cash-flowing — sheltering income. Rental losses are passive: they offset passive income freely, and up to $25,000/yr can offset ordinary (W-2) income if you actively participate and your MAGI is under $100k (phasing out to $0 by $150k); unused losses carry forward. On sale, claimed depreciation is recaptured at up to 25%, and gains may owe capital-gains tax (a 1031 exchange can defer both). Figures are a year-1 estimate at your 24.0% rate — not tax advice; consult a CPA.
Schools (NCES district)
- District
- Atlanta Public Schools
- NCES district ID
- 1300120
- Math proficiency
- 28% ▼ -6.00%
- Reading proficiency
- 35% ▼ -2.00%
- Median HH income
- $48,306
- Composite
- 27.27/100
- National rank
- #7006
- State rank
- #80 of 174 in GA
Livability — Atlanta
- Score
- 83/100
- State rank
- #6
- US rank
- #919
Category grades
Schools grade is shown separately in the Schools card above.
Census & demographics
- Census place
- Atlanta, GA
- County
- Fulton County · 1,094,430 people
- City population
- 629,525
- Metro
- Atlanta-Sandy Springs-Alpharetta, GA
- Population (ZIP)
- 27,186
- Household income
- $53,037
- Rent vs Own
- Severe rent burden
- 1676.0
Population outlook (Fulton County) Hauer SSP2
- Today (2025)
- 1,203,707 people
- By 2030
- 1,299,706 · +8.0%
- By 2040
- 1,488,256 · +23.6%
- By 2050
- 1,664,580 · +38.3%
- By 2075
- 2,036,072 · +69.2%
- By 2100
- 2,222,402 · +84.6%
Race, ethnicity, and origin ACS 2023
- Neighborhood character
- Predominantly Black (76%)
- Race & ethnicity
- Black 76% White 14% Two or more races 4% Hispanic / Latino 4% Asian 2%
- Common ancestry
- Lithuanian 1% Slovak 1% Serbian 0%
- Foreign-born
- 5% · Canada, South Korea, Vietnam
- Languages at home
- 92% English-only · Spanish 4% French/Haitian/Cajun 1% Other Indo-European 1%
Political lean MEDSL · Fulton
- 2024 margin
- Solid D (+44.9) · D 71.9% · R 27.0% · Other 1.1%
- 2008→2024 swing
- +9.8pp toward D · 2008: 35.0pp · 2024: 44.9pp
- All cycles
- 2024: D+44.9 2020: D+46.4 2016: D+42.1 2012: D+29.6 2008: D+35.0
Not yet ingested
- Civics
- —
Market trends
- HPI YoY
- ▼ -204.00%
- Current HPI
- 418.7297
- Rent YoY
- ▲ 2.77%
- Metro
- Atlanta-Sandy Springs-Alpharetta, GA
- State GDP YoY
- ▲ 2.66%
- F500 in state
- 28
Industry mix (Fortune 500 HQ in GA)
| Industry | F500 HQs | Revenue |
|---|---|---|
| Paper / Packaging | 2 | $29B |
|
||
| Retail | 1 | $160B |
|
||
| Transportation / Logistics | 1 | $91B |
|
||
| Airlines | 1 | $62B |
|
||
| Consumer Goods | 1 | $47B |
|
||
| Utilities | 1 | $25B |
|
||
Price history
+1152.6% since first listed4 events — show timeline
- 2026-05-19 Listed $119,000 GAMLS
- 2026-05-19 Listed $119,000 FMLS
- 1991-03-13 Sold (Public Records) $19,500 Public Records
- 1980-07-18 Sold (Public Records) $9,500 Public Records
Property tax history
-1.6%/yrLatest (2025): $15 · -52.9% YoY. Source: county tax records.
Cash-flow waterfall
monthlySold comps — $/sqft
last 12 mo · ≤1 miLoading sold comps…