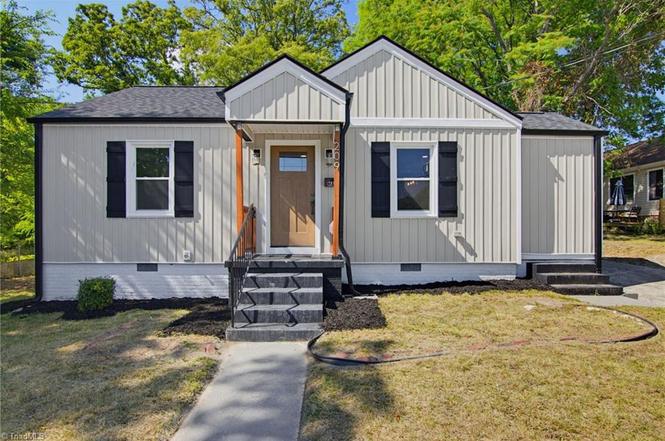
209 Mcculloch St · Greensboro, NC
Flood risk 1/10 · Minimal
- FEMA flood zone
- X (unshaded)
- Chance of flooding over 30 yrs
- 0.0%
- Est. flood insurance / yr
- $507 – $1,088
Fire risk 1/10 · Minimal
- Est. fire insurance / yr
- $906 – $1,684
Heat risk 5/10 · Moderate
- Hot days now (above 103°F)
- 7 days/yr
- Hot days in 30 yrs
- 16 days/yr
Wind risk 4/10 · Minor
- Chance of severe wind over 30 yrs
- 14.0%
Air-quality risk 2/10 · Minimal
- Unhealthy air days now
- 1 days/yr
- Unhealthy air days in 30 yrs
- 2 days/yr
Risk factors via First Street. Map © Google.
Why this score? — see what drove the F grade
The composite is a weighted blend of 9 inputs, each scored 0–100. Each bar is that input's sub-score; the figure is the points it added to the 100-point composite (weight × sub-score).
- Cash flow +13.5/30.0
- DSCR +4.1/10.0
- Livability +4.0/5.0
- Schools +3.6/10.0
- Rent growth +3.0/5.0
- 1% rule +2.7/10.0
- Condition / age +2.5/5.0
- ARV discount +0.0/15.0
- Appreciation +0.0/10.0
$153,000
🖨 Deal sheet 📄 Offer letter ✓ Due diligence
Listing remarks
Cute as button! Fully renovated in late 2024, this beautifully updated 2-bedroom, 1-bath home blends modern style with low-maintenance living. Featuring fresh interior paint and contemporary finishes throughout, major upgrades include new roof, windows, siding, HVAC, flooring, and a fully updated kitchen. With a well-designed layout and thoughtfully updated spaces, this move-in ready home offers both comfort and style in a convenient Greensboro location.
Key facts
- Fully renovated
- New siding
- New hvac
Tags
Property features AI
Finance
- HOA & community: No homeowners association
Exterior
- Parking: Driveway
- Utilities: Public sewer; Electric water heater; Tankless water heater; Electric power
- Home design: Residential stick/site-built house; One story; Built in 1951; Existing structure
- Construction: Vinyl siding; Crawl space foundation; No fireplaces
- Exterior features: No fencing; Public maintained road access; Public water source
Interior
- Kitchen: Free-standing range; Tankless water heater; Electric water heater
- Bedrooms: Primary on main
- Flooring: Vinyl
- Bathrooms: 1 full bathroom
- Heating & cooling: Heat pump heating (electric); Central air conditioning
- Interior features: Primary bedroom located on the main level; Vinyl flooring
- Laundry & utility: Main level laundry
Neighborhood map
What this means for you Summary
Snapshot
- This is a 2-bed/1.0-bath single-family listed at $153k.
Deal economics
- At list price, monthly cash flow is $5 ($54/yr) — positive.
- The deal already cash-flows at list — no discount required.
- To meet the 1% rule (rent ≥ 1% of price), the offer needs to be $117k (23.5% below list).
- Recommended offer: $117k (23.5% below list) — sets the bar for 1% rule.
- Cap rate 6.3% vs local median 3.8% in Greensboro — top-decile yield for the area; either an underpriced asset or a hidden risk that comps aren't pricing in. Stress-test before assuming the spread holds.
Location & tenants
- Location reads 81/100 on livability (#12 in NC, #1,335 nationally) — a professional / high-income tenant draw. Strengths: amenities A+, commute A+, cost of living A+; Watch: employment D, crime F.
- Guilford County Schools (urban): math 39% / reading 45% proficiency, ranked #99 of 178 in NC (top 56%) — families likely to look elsewhere, expect single-tenant / working-renter base with shorter leases.
- Market conditions: Rents rising (+2.2%/yr); 261 active listings in the ZIP; 10 comparable units currently listed for rent nearby; rentals at typical pace (median 19d on market — plan ~3-4 weeks tenant-placement turnaround); 3,843 units permitted in Guilford County in 2024 (2,397 in 5+ unit buildings).
Forward outlook
- Local home prices are declining (-3.0%/yr); year-one equity from $1k of loan paydown is wiped out by about $5k of value loss. Plan a longer hold.
- Guilford County population projected at +26% by 2050 — long-run rental-demand tailwind backs the buy-and-hold thesis.
Negotiation context
- It's been on market 28 days — a 2% lower offer ($151k) is reasonable based on typical stale-listing flexibility.
- 3 sale attempts with the ask held roughly flat each time — persistent listings suggest the price (not the market) is what's stuck; bring a comps-based counter.
Risks & watch-outs
- Watch-outs: built in 1951 — expect roof / HVAC / electrical / plumbing capex.
- Climate carrying-cost: extreme-heat days projected 7→16/yr by 2055 (HVAC capex compounding) — expect insurance premiums to compound above CPI over the hold.
Questions for the listing agent
- Built in 1951 — when were the roof, HVAC, electrical panel, plumbing, and water heater last replaced?
- Is there a deadline driving the sale (1031 exchange, divorce, estate, relocation)? That informs how much negotiation room exists.
- Crime grade is F in this area — have there been break-ins, vandalism, or insurance claims at this property in the last 3 years? What carrier currently insures it and at what premium?
- The area grade is low — what's the realistic commute time and amenity access for the typical tenant pool here? Any planned neighborhood developments (good or bad) we should know about?
- What's the average days-on-market for RENTAL listings here right now (not sales)? A rising rental-DOM trend means longer vacancies and softer asking-rent achievability than the comps imply.
- What's the recent tenant-quality profile in this submarket — average credit score on applications, eviction rate, late-payment / NSF rate, and stable-employment percentage? A property-management company in the area should have these aggregated.
- How much new for-sale + rental construction is in the pipeline within 1–3 miles? Heavy new supply typically softens prices + rents 12–24 months out; constrained supply supports both.
Investment metrics
- 1% rule
- 0.77% ✗
- Cap rate
- 6.33%
- Cash-on-cash
- 0.13%
- DSCR
- 1.01
- GRM
- 10.9
CMA / ARV
- ARV (on-the-fly)
- $128,712
- Comps found
- 9
Show comp detail 9 sales within ~0.75 mi
| Address | Dist | Beds/Ba | Sqft | Sold | Price | $/sf | Match |
|---|---|---|---|---|---|---|---|
| 1011 S Pearson St | 0.29mi | 2/1.0 | 768 (+3%) | 17mo | $110,000 | $143 | 67 |
| 817 Tuscaloosa St | 0.57mi | 2/1.0 | 720 (-3%) | 4mo | $160,000 | $222 | 64 |
| 1510 Bellevue St | 0.65mi | 2/2.0 | 751 (+1%) | 8mo | $203,000 | $270 | 58 |
| 620 Julian St | 0.44mi | 3/1.0 (+1) | 784 (+5%) | 9mo | $138,500 | $177 | 58 |
| 717 Dale St | 0.50mi | 2/1.0 | 670 (-10%) | 10mo | $67,875 | $101 | 52 |
| 1112 Caldwell St | 0.38mi | 2/1.0 | 832 (+12%) | 14mo | $85,000 | $102 | 51 |
| 521 Martin St | 0.57mi | 2/1.0 | 840 (+13%) | 1mo | $65,000 | $77 | 51 |
| 1400 Randolph Ave | 0.53mi | 2/1.0 | 804 (+8%) | 18mo | $150,000 | $187 | 47 |
| 610 Doak St | 0.62mi | 2/1.0 | 637 (-14%) | 19mo | $110,000 | $173 | 31 |
Match score weights: distance 35% · size 25% · config 20% · recency 20%. Top-matched comps best support the ARV.
Projected returns pro-forma
-3.0% appreciation · 2.18% rent growth · sell at horizon
- IRR
- -17.0%
- Equity multiple
- 0.40×
- Total profit
- $-25,529
- Equity at exit
- $22,813
- IRR
- -10.3%
- Equity multiple
- 0.39×
- Total profit
- $-25,997
- Equity at exit
- $13,229
Cash invested: $42,840 (down + closing). Projections, not guarantees.
Landlord ↔ Tenant lean methodology
- Overall (STATE)
- 85 Strongly Landlord-Friendly
- State North Carolina
- 85 Strongly Landlord-Friendly · R+3
- County
- — inherits STATE
- City
- — inherits STATE
ZIP-level market 27406
- Rents YoY
- 2.2%
- Active inventory
- 261
- Price-to-rent
- 10.9×
Monthly cashflow live
- Estimated rent
- $1,171 high interval (Pro) →
- Mortgage (P&I)
- −$802
- Tax from tax record
- −$54 /mo · $650/yr
- Insurance
- −$64
- HOA
- −$0
- Vacancy / Maint / Mgmt
- −$246
- Net cashflow
- $5
Break-even live
UW: 25.0% down · 7.5% · 30yr · 1.5% tax · 5.0% vac · 8.0% maint · 8.0% mgmt
Financing live
Cash to close
- Down payment
- $38,250
- Closing costs
- $4,590
- Reserves months
- —
- Total cash needed
- —
Loan-product check · same deal, 3 products live
Conventional
25% down · 7.5% · 30yr
- Down + closing
- —
- Monthly P&I
- —
- Monthly cashflow
- —
- DSCR
- —
- Eligible?
- —
Personal DTI + credit; lowest rate.
DSCR
20% down · 8.5% · 30yr
- Down + closing
- —
- Monthly P&I
- —
- Monthly cashflow
- —
- DSCR
- —
- Eligible?
- —
No personal income docs; deal must DSCR.
Hard money
10% down · 12.0% · 12mo
- Down + closing
- —
- Monthly P&I
- —
- Monthly cashflow
- —
- DSCR
- —
- Eligible?
- —
Short-term bridge; refi at stabilization.
Rent comps 10 comps
| Address | Beds | Baths | Sqft | Rent | $/sqft | DOM | Units | Dist |
|---|---|---|---|---|---|---|---|---|
| 800 Arlington St Unit A Greensboro, NC | 2.0 | 1.0 | 650 | $1,250 | $1.92 | 14d | 1 | 0.06mi |
| 405 E Whittington St Greensboro, NC | 2.0 | 1.0 | 700 | $995 | $1.42 | 23d | 1 | 0.18mi |
| 1003 Martin Luther King Junior Dr Unit B Greensboro, NC | 1.0 | 1.0 | 580 | $595 | $1.03 | 23d | 1 | 0.34mi |
| 702 Ross Ave Greensboro, NC | 2.0 | 1.0 | 672 | $1,200 | $1.79 | 23d | 1 | 0.50mi |
| 321 S Elm St Greensboro, NC | 1.0–2.0 | 1.0–2.0 | 950 | $1,787 | $1.88 | 14d | 8 | 0.58mi |
| 1001 E Bragg St Apt B Greensboro, NC | 2.0 | 1.0 | 700 | $925 | $1.32 | 14d | 1 | 0.68mi |
| 1112 Stephens St Greensboro, NC | 2.0 | 1.0 | 744 | $1,250 | $1.68 | 18d | 1 | 1.09mi |
| 404 W Smith St Greensboro, NC | 1.0–2.0 | 1.0–2.0 | 803 | $1,719 | $2.14 | 14d | 8 | 1.28mi |
| 500 Savannah St Greensboro, NC | 2.0 | 1.0–1.5 | 769 | $1,295 | $1.68 | 18d | 8 | 1.33mi |
| 1401 Oak St Greensboro, NC | 2.0 | 1.0 | 690 | $1,300 | $1.88 | 23d | 1 | 1.47mi |
Listing history 26 events
-
2026-06-18status $153,000 Pending 28 DOM
-
2026-06-17days on market $153,000 Due Diligence Period 28 DOM
-
2026-06-16days on market $153,000 Due Diligence Period 27 DOM
-
2026-06-15days on market $153,000 Due Diligence Period 26 DOM
-
2026-06-14days on market $153,000 Due Diligence Period 24 DOM
-
2026-06-10days on market $153,000 Due Diligence Period 21 DOM
-
2026-06-09days on market $153,000 Due Diligence Period 20 DOM
-
2026-06-08days on market $153,000 Due Diligence Period 19 DOM
-
2026-06-07days on market $153,000 Due Diligence Period 18 DOM
-
2026-06-03days on market $153,000 Due Diligence Period 14 DOM
-
2026-06-02days on market $153,000 Due Diligence Period 13 DOM
-
2026-06-01days on market $153,000 Due Diligence Period 12 DOM
-
2026-05-31days on market $153,000 Due Diligence Period 11 DOM
-
2026-05-31days on market $153,000 Due Diligence Period 10 DOM
-
2026-05-20$153,000 Active
-
2025-05-23historical $1,300
-
2025-05-14price $1,300
-
2025-03-28$1,500
-
2025-03-27historical
-
2025-03-25price $185,000
-
2025-02-26price $194,900
-
2025-02-07price $199,900
-
2025-01-30price $209,900
-
2025-01-24price $214,900
-
2025-01-18$225,000 Active
-
2025-01-16historical
ⓘ Source: listings_history table (triggers on properties + properties_extension) + one-shot
backfill from property_details.listing_events for pre-trigger history.
Tax reassessment forecast NC · Resets to sale price
- Current annual tax
- $650 · $54/mo
- Projected year-2 tax
- $1,255 · $105/mo
- Expected delta
- +$605/yr (+$50/mo · 93.0%)
ⓘ Screening estimate from a state-policy table — verify with the county assessor before closing.
Climate risk First Street
- Flood 1/10 Low FEMA zone X (unshaded) · 0% chance over 30 yrs
- Wildfire 1/10 Low
- Heat 5/10 Major 7 d/yr ≥103°F today · 16 d/yr by 30 yrs out
- Wind 4/10 Moderate 14% chance of damaging wind over 30 yrs
- Air quality 2/10 Low 1 unhealthy d/yr today · 2 by 30 yrs out
Nearby sold comps map
Loading sold comps map…
Walkable amenities ~0.75 mi
Loading nearby amenities…
Taxation est. · year 1
- Rental income
- $14,047
- − Mortgage interest
- −$8,570
- − Property taxes
- −$650
- − Insurance
- −$765
- − Repairs & maintenance
- −$1,124
- − Management
- −$1,124
- − Depreciation
- −$4,451
- Taxable loss
- −$2,636
- Est. tax savings @ 24.0%
- +$633
- After-tax cash flow
- $687/yr
For passive investors: Depreciation is non-cash, so a rental often shows a tax loss while cash-flowing — sheltering income. Rental losses are passive: they offset passive income freely, and up to $25,000/yr can offset ordinary (W-2) income if you actively participate and your MAGI is under $100k (phasing out to $0 by $150k); unused losses carry forward. On sale, claimed depreciation is recaptured at up to 25%, and gains may owe capital-gains tax (a 1031 exchange can defer both). Figures are a year-1 estimate at your 24.0% rate — not tax advice; consult a CPA.
Schools (NCES district)
- District
- Guilford County Schools
- NCES district ID
- 3701920
- Math proficiency
- 39% ▲ 1.00%
- Reading proficiency
- 45% ▲ 1.00%
- Median HH income
- $46,315
- Composite
- 35.78/100
- National rank
- #4842
- State rank
- #99 of 178 in NC
Livability — Greensboro
- Score
- 81/100
- State rank
- #12
- US rank
- #1335
Category grades
Schools grade is shown separately in the Schools card above.
Census & demographics
- Census place
- Greensboro, NC
- County
- Guilford County · 487,190 people
- City population
- 329,421
- Metro
- Greensboro-High Point, NC
- Population (ZIP)
- 60,651
- Household income
- $59,563
- Rent vs Own
- Severe rent burden
- 2462.0
Population outlook (Guilford County) Hauer SSP2
- Today (2025)
- 584,596 people
- By 2030
- 616,851 · +5.5%
- By 2040
- 678,451 · +16.1%
- By 2050
- 734,788 · +25.7%
- By 2075
- 862,985 · +47.6%
- By 2100
- 948,704 · +62.3%
Race, ethnicity, and origin ACS 2023
- Neighborhood character
- Diverse neighborhood (Simpson 0.64)
- Race & ethnicity
- Black 52% White 26% Hispanic / Latino 13% Two or more races 10% Asian 2%
- Hispanic origin (detail)
- Mexican 7% Puerto Rican 2%
- Common ancestry
- Italian 1% Serbian 1% Lithuanian 1%
- Foreign-born
- 10% · Canada, Vietnam, United Kingdom
- Languages at home
- 83% English-only · Spanish 11% Vietnamese 1% Other Asian/Pacific 1%
Political lean MEDSL · Guilford
- 2024 margin
- Strong D (+21.8) · D 60.2% · R 38.4% · Other 1.4%
- 2008→2024 swing
- +3.5pp toward D · 2008: 18.4pp · 2024: 21.8pp
- All cycles
- 2024: D+21.8 2020: D+23.1 2016: D+20.0 2012: D+16.5 2008: D+18.4
Not yet ingested
- Civics
- —
Market trends
- HPI YoY
- ▼ -146.70%
- Current HPI
- 243.2612
- Rent YoY
- ▲ 2.18%
- Metro
- Greensboro-High Point, NC
- State GDP YoY
- ▲ 3.28%
- F500 in state
- 26
Industry mix (Fortune 500 HQ in NC)
| Industry | F500 HQs | Revenue |
|---|---|---|
| Financial Services | 2 | $213B |
|
||
| Retail | 2 | $95B |
|
||
| Industrial Conglomerate | 1 | $38B |
|
||
| Metals / Steel | 1 | $35B |
|
||
| Utilities | 1 | $30B |
|
||
| Industrial Machinery | 1 | $19B |
|
||
Price history
-32.0% since first listed12 events — show timeline
- 2026-05-20 Listed $153,000 Triad MLS
- 2025-05-23 Rental Removed $1,300 TMLS
- 2025-05-14 Price Changed $1,300 TMLS
- 2025-03-28 Listed for Rent $1,500 TMLS
- 2025-03-27 Listing Removed — TMLS
- 2025-03-25 Price Changed $185,000 TMLS
- 2025-02-26 Price Changed $194,900 TMLS
- 2025-02-07 Price Changed $199,900 TMLS
- 2025-01-30 Price Changed $209,900 TMLS
- 2025-01-24 Price Changed $214,900 TMLS
- 2025-01-18 Listed $225,000 TMLS
- 2025-01-16 Coming Soon — TMLS
Property tax history
-0.1%/yrLatest (2025): $650 · -1.0% YoY. Source: county tax records.
Cash-flow waterfall
monthlySold comps — $/sqft
last 12 mo · ≤1 miLoading sold comps…