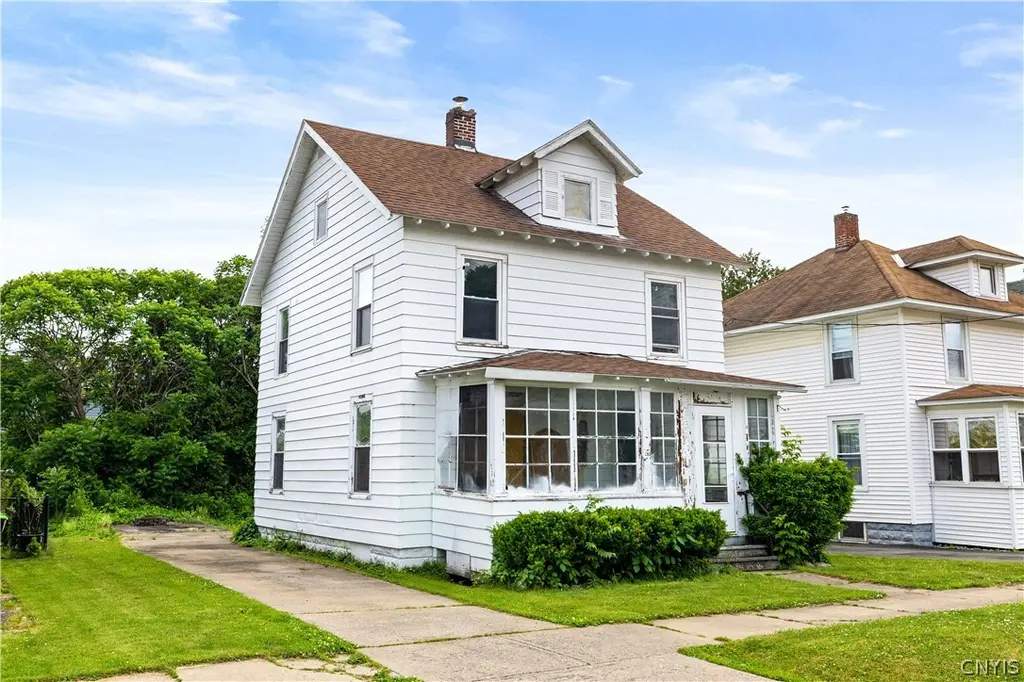
316 Steuben St · Herkimer, NY
Flood risk 4/10 · Minor
- FEMA flood zone
- X (unshaded)
- Chance of flooding over 30 yrs
- 0.24%
- Est. flood insurance / yr
- $473 – $860
Fire risk 1/10 · Minimal
- Est. fire insurance / yr
- $691 – $1,283
Heat risk 3/10 · Minor
- Hot days now (above 98°F)
- 7 days/yr
- Hot days in 30 yrs
- 17 days/yr
Wind risk 2/10 · Minimal
- Chance of severe wind over 30 yrs
- 1.0%
Air-quality risk 1/10 · Minimal
- Unhealthy air days now
- 0 days/yr
- Unhealthy air days in 30 yrs
- 0 days/yr
Risk factors via First Street. Map © Google.
Why this score? — see what drove the A grade
The composite is a weighted blend of 9 inputs, each scored 0–100. Each bar is that input's sub-score; the figure is the points it added to the 100-point composite (weight × sub-score).
- Cash flow +30.0/30.0
- ARV discount +15.0/15.0
- DSCR +10.0/10.0
- Appreciation +10.0/10.0
- 1% rule +9.2/10.0
- Schools +3.9/10.0
- Livability +3.6/5.0
- Rent growth +2.5/5.0
- Condition / age +2.5/5.0
$120,000
🖨 Deal sheet 📄 Offer letter ✓ Due diligence
Listing remarks MLS
HUD Home, being sold as-is. Much potential for this 3 bedroom home with nice back yard. Local amenities nearby. LBP. IE-insurable escrow, financing available: cash, conventional, fha 203k.
Key facts
- White kitchen
- Functional layout
- Updated cabinetry
Tags
Property features AI
Exterior
- Parking: No garage
- Utilities: Electricity connected; Public water connected; Sewer connected
- Home design: Two-story property; Existing construction; Aluminum siding
- Construction: Block foundation
- Exterior features: Blacktop driveway; Concrete driveway; Near public transit; Rectangular residential lot; City street frontage
Interior
- Kitchen: Dishwasher; Gas oven; Gas range; Refrigerator
- Bedrooms: 7 total rooms (includes bedroom and living spaces)
- Flooring: Laminate flooring; Varied flooring
- Bathrooms: 1 full bathroom
- Heating & cooling: Gas heating; Hot water heating
- Interior features: Separate/formal dining room; Full basement
- Laundry & utility: Laundry located in basement; Gas water heater
Neighborhood map
What this means for you Summary
Snapshot
- This is a 3-bed/1.0-bath single-family listed at $120k.
Deal economics
- At list price, monthly cash flow is $453 ($5k/yr) — positive.
- The deal already cash-flows at list — no discount required.
- Meets the 1% rule at list price ($2k rent vs $120k).
- Cap rate 10.8% vs local median 5.5% in Herkimer — top-decile yield for the area; either an underpriced asset or a hidden risk that comps aren't pricing in. Stress-test before assuming the spread holds.
Location & tenants
- Location reads 71/100 on livability (#392 in NY) — a middle-class / working-renter tenant base. Strengths: cost of living A+, housing A+, health & safety A+; Watch: schools D+, amenities D+, crime D.
- Herkimer Central School District (town): math 46% / reading 47% proficiency, ranked #455 of 590 in NY (top 77%) — families likely to look elsewhere, expect single-tenant / working-renter base with shorter leases.
- Market conditions: 56 active listings in the ZIP; 1 comparable units currently listed for rent nearby; 54 units permitted in Herkimer County in 2024 (0 in 5+ unit buildings).
Forward outlook
- In year one you build about $13k of equity ($830 loan paydown + $12k appreciation (10.0% local appreciation)).
- Herkimer County population projected at -24% by 2050 — secular population decline; favor cash flow + early exit over multi-decade hold.
- At projected returns (10.0% appreciation + 3.0% rent growth), your $34k cash investment doubles in ~2 years — after that, you're playing with house money.
- By year 3, paydown + projected appreciation supports a ~$32k cash-out refi (75% LTV) — recoverable capital for the next deal without selling this one.
Negotiation context
- Only 2 days on market — expect competitive offers; lowballing is unlikely to land.
- 2 sale attempts since 9y ago with the ask held roughly flat each time — persistent listings suggest the price (not the market) is what's stuck; bring a comps-based counter.
- Current owner paid $20k; list at $120k implies a 497% gain — meaningful room to come down on a strong offer.
Risks & watch-outs
- Watch-outs: built in 1900 — expect roof / HVAC / electrical / plumbing capex.
Questions for the listing agent
- Built in 1900 — when were the roof, HVAC, electrical panel, plumbing, and water heater last replaced?
- Is there a deadline driving the sale (1031 exchange, divorce, estate, relocation)? That informs how much negotiation room exists.
- Schools are D-rated, which usually means shorter tenancies and higher turnover. Who's the typical renter profile here, and what's been the actual vacancy rate?
- Crime grade is D in this area — have there been break-ins, vandalism, or insurance claims at this property in the last 3 years? What carrier currently insures it and at what premium?
- What's the average days-on-market for RENTAL listings here right now (not sales)? A rising rental-DOM trend means longer vacancies and softer asking-rent achievability than the comps imply.
- What's the recent tenant-quality profile in this submarket — average credit score on applications, eviction rate, late-payment / NSF rate, and stable-employment percentage? A property-management company in the area should have these aggregated.
- How much new for-sale + rental construction is in the pipeline within 1–3 miles? Heavy new supply typically softens prices + rents 12–24 months out; constrained supply supports both.
Investment metrics
- 1% rule
- 1.42% ✓
- Cap rate
- 10.82%
- Cash-on-cash
- 16.17%
- DSCR
- 1.72
- GRM
- 5.9
CMA / ARV
- ARV (on-the-fly)
- $166,320
- Comps found
- 12
Show comp detail 12 sales within ~0.75 mi
| Address | Dist | Beds/Ba | Sqft | Sold | Price | $/sf | Match |
|---|---|---|---|---|---|---|---|
| 310 Steuben St | 0.02mi | 3/1.0 | 1,196 (+1%) | 9mo | $148,000 | $124 | 91 |
| 318 Gray St | 0.05mi | 3/1.0 | 1,316 (+11%) | 11mo | $145,500 | $111 | 70 |
| 609 Malcolm St | 0.41mi | 3/1.0 | 1,137 (-4%) | 7mo | $110,000 | $97 | 68 |
| 519 Steuben Rd | 0.34mi | 2/1.5 (-1) | 1,115 (-6%) | 5mo | $159,500 | $143 | 63 |
| 150 Folts Rd | 0.59mi | 3/1.5 | 1,188 (0%) | 10mo | $184,000 | $155 | 62 |
| 309 Eureka Ave | 0.45mi | 2/1.0 (-1) | 1,183 (-0%) | 15mo | $105,000 | $89 | 61 |
| 317 S Bellinger St | 0.67mi | 3/1.5 | 1,216 (+2%) | 5mo | $171,720 | $141 | 59 |
| 349 Gray St | 0.09mi | 2/1.0 (-1) | 1,344 (+13%) | 13mo | $155,000 | $115 | 58 |
| 302 W German St | 0.46mi | 3/1.5 | 1,318 (+11%) | 2mo | $195,000 | $148 | 57 |
| 209 Pullman St | 0.36mi | 2/1.0 (-1) | 1,092 (-8%) | 13mo | $152,000 | $139 | 54 |
| 115 Hillside Ave | 0.41mi | 2/1.0 (-1) | 1,036 (-13%) | 16mo | $145,000 | $140 | 42 |
| 602 Pine Ave | 0.71mi | 2/1.0 (-1) | 1,014 (-15%) | 10mo | $154,900 | $153 | 29 |
Match score weights: distance 35% · size 25% · config 20% · recency 20%. Top-matched comps best support the ARV.
Projected returns pro-forma
10.0% appreciation · 3.0% rent growth · sell at horizon
- IRR
- 36.3%
- Equity multiple
- 3.81×
- Total profit
- $94,255
- Equity at exit
- $108,106
- IRR
- 31.2%
- Equity multiple
- 8.59×
- Total profit
- $255,013
- Equity at exit
- $233,134
Cash invested: $33,600 (down + closing). Projections, not guarantees.
Landlord ↔ Tenant lean methodology
- Overall (STATE)
- 15 Strongly Tenant-Friendly
- State New York
- 15 Strongly Tenant-Friendly · D+10
- County
- — inherits STATE
- City
- — inherits STATE
ZIP-level market 13350
- Home prices YoY
- 8.9%
- Active inventory
- 56
- Price-to-rent
- 5.9×
Monthly cashflow live
- Estimated rent
- $1,700 medium interval (Pro) →
- Mortgage (P&I)
- −$629
- Tax from tax record
- −$211 /mo · $2,531/yr
- Insurance
- −$50
- HOA
- −$0
- Vacancy / Maint / Mgmt
- −$357
- Net cashflow
- $453
Break-even live
UW: 25.0% down · 7.5% · 30yr · 1.5% tax · 5.0% vac · 8.0% maint · 8.0% mgmt
Financing live
Cash to close
- Down payment
- $30,000
- Closing costs
- $3,600
- Reserves months
- —
- Total cash needed
- —
Loan-product check · same deal, 3 products live
Conventional
25% down · 7.5% · 30yr
- Down + closing
- —
- Monthly P&I
- —
- Monthly cashflow
- —
- DSCR
- —
- Eligible?
- —
Personal DTI + credit; lowest rate.
DSCR
20% down · 8.5% · 30yr
- Down + closing
- —
- Monthly P&I
- —
- Monthly cashflow
- —
- DSCR
- —
- Eligible?
- —
No personal income docs; deal must DSCR.
Hard money
10% down · 12.0% · 12mo
- Down + closing
- —
- Monthly P&I
- —
- Monthly cashflow
- —
- DSCR
- —
- Eligible?
- —
Short-term bridge; refi at stabilization.
Rent comps 1 comps
| Address | Beds | Baths | Sqft | Rent | $/sqft | DOM | Units | Dist |
|---|---|---|---|---|---|---|---|---|
| 502 Lake St Herkimer, NY | 3.0 | 1.0 | 1125 | $1,700 | $1.51 | 43d | 1 | 0.42mi |
Listing history 3 events
-
2026-06-18days on market $120,000 Active 2 DOM
-
2026-06-17remarks 517-char remark
-
2026-06-17$120,000 Active 1 DOM
ⓘ Source: listings_history table (triggers on properties + properties_extension) + one-shot
backfill from property_details.listing_events for pre-trigger history.
Tax reassessment forecast NY · Partial reset (capped growth)
- Current annual tax
- $2,531 · $211/mo
- Projected year-2 tax
- $2,531 · $211/mo
- Expected delta
- $0/yr ($0/mo · 0.0%)
ⓘ Screening estimate from a state-policy table — verify with the county assessor before closing.
Climate risk First Street
- Flood 4/10 Moderate FEMA zone X (unshaded) · 24% chance over 30 yrs
- Wildfire 1/10 Low
- Heat 3/10 Moderate 7 d/yr ≥98°F today · 17 d/yr by 30 yrs out
- Wind 2/10 Low 100% chance of damaging wind over 30 yrs
- Air quality 1/10 Low 0 unhealthy d/yr today · 0 by 30 yrs out
Nearby sold comps map
Loading sold comps map…
Walkable amenities ~0.75 mi
Loading nearby amenities…
Taxation est. · year 1
- Rental income
- $20,400
- − Mortgage interest
- −$6,722
- − Property taxes
- −$2,531
- − Insurance
- −$600
- − Repairs & maintenance
- −$1,632
- − Management
- −$1,632
- − Depreciation
- −$3,491
- Taxable income
- $3,792
- Est. tax owed @ 24.0%
- −$910
- After-tax cash flow
- $4,523/yr
For passive investors: Depreciation is non-cash, so a rental often shows a tax loss while cash-flowing — sheltering income. Rental losses are passive: they offset passive income freely, and up to $25,000/yr can offset ordinary (W-2) income if you actively participate and your MAGI is under $100k (phasing out to $0 by $150k); unused losses carry forward. On sale, claimed depreciation is recaptured at up to 25%, and gains may owe capital-gains tax (a 1031 exchange can defer both). Figures are a year-1 estimate at your 24.0% rate — not tax advice; consult a CPA.
Schools (NCES district)
- District
- Herkimer Central School District
- NCES district ID
- 3614220
- Math proficiency
- 46% ▲ 6.00%
- Reading proficiency
- 47% ▲ 9.00%
- Median HH income
- $39,447
- Composite
- 38.87/100
- National rank
- #4100
- State rank
- #455 of 590 in NY
Livability — Herkimer
- Score
- 71/100
- State rank
- #392
- US rank
- #6787
Category grades
Schools grade is shown separately in the Schools card above.
Census & demographics
- Census place
- Herkimer, NY
- Population (ZIP)
- 9,641
Population outlook (Herkimer County) Hauer SSP2
- Today (2025)
- 59,340 people
- By 2030
- 56,838 · -4.2%
- By 2040
- 51,098 · -13.9%
- By 2050
- 45,080 · -24.0%
- By 2075
- 32,648 · -45.0%
- By 2100
- 22,266 · -62.5%
Race, ethnicity, and origin ACS 2023
- Neighborhood character
- Predominantly White (90%)
- Race & ethnicity
- White 90% Two or more races 5% Black 2% Asian 2% Hispanic / Latino 1%
- Common ancestry
- Romanian 9% Lithuanian 4% Italian 3%
- Foreign-born
- 4% · Canada, China
- Languages at home
- 92% English-only · French/Haitian/Cajun 2% Other Asian/Pacific 1% Spanish 1%
Political lean MEDSL · Herkimer
- 2024 margin
- Solid R (+36.4) · D 31.8% · R 68.2%
- 2008→2024 swing
- -27.1pp toward R · 2008: -9.3pp · 2024: -36.4pp
- All cycles
- 2024: R+36.4 2020: R+30.5 2016: R+34.5 2012: R+8.4 2008: R+9.3
Not yet ingested
- Civics
- —
Market trends
- HPI YoY
- ▲ 26.43%
- Current HPI
- 324.4601
- Rent YoY
- —
- Metro
- —
- State GDP YoY
- ▲ 2.60%
- F500 in state
- 92
Industry mix (Fortune 500 HQ in NY)
| Industry | F500 HQs | Revenue |
|---|---|---|
| Financial Services | 10 | $950B |
|
||
| Consumer Goods | 9 | $162B |
|
||
| Insurance | 4 | $225B |
|
||
| Telecommunications | 2 | $144B |
|
||
| Pharmaceuticals | 2 | $112B |
|
||
| Media / Entertainment | 2 | $69B |
|
||
Price history
+196.3% since first listed7 events — show timeline
- 2026-06-16 Listed $120,000 CNYIS
- 2018-01-25 Sold (MLS) $20,100 CNYIS
- 2017-11-17 Listed $20,000 CNYIS
- 2008-09-24 Sold (Public Records) $59,000 Public Records
- 2001-04-02 Sold (Public Records) $42,000 Public Records
- 2000-04-19 Sold (Public Records) $42,000 Public Records
- 1996-07-02 Sold (Public Records) $40,500 Public Records
Property tax history
+0.2%/yrLatest (2025): $2,531 · +3.4% YoY. Source: county tax records.
Cash-flow waterfall
monthlySold comps — $/sqft
last 12 mo · ≤1 miLoading sold comps…