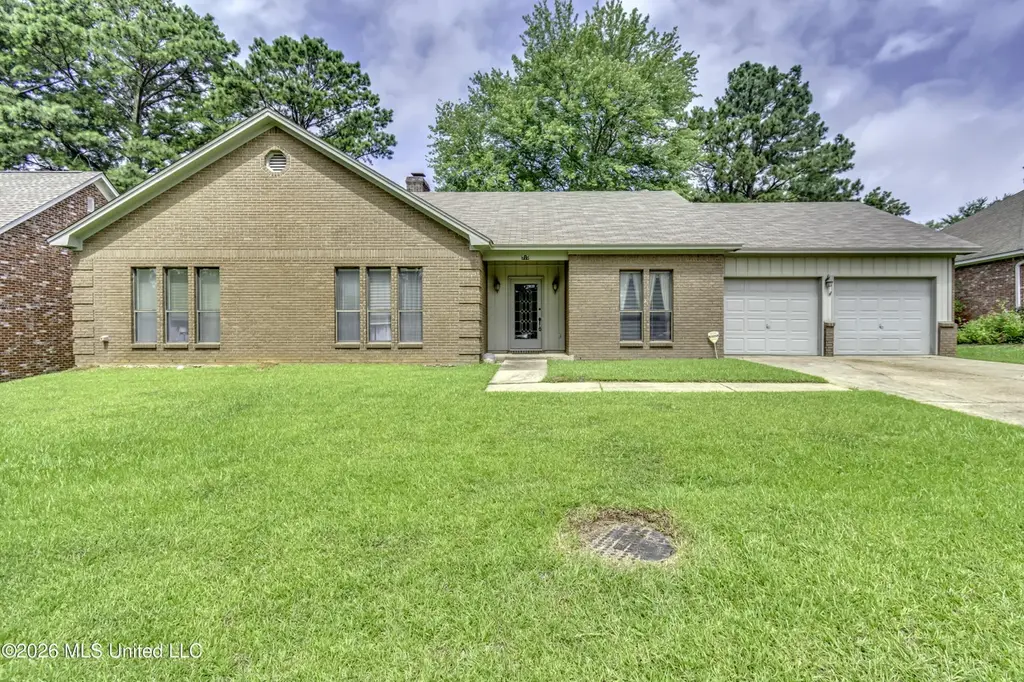
510 Bay Pointe Cir · Flowood, MS
Flood risk 1/10 · Minimal
- FEMA flood zone
- X (unshaded)
- Chance of flooding over 30 yrs
- 0.0%
- Est. flood insurance / yr
- $507 – $1,088
Fire risk 3/10 · Minor
- Est. fire insurance / yr
- $1,241 – $2,305
Heat risk 7/10 · Major
- Hot days now (above 108°F)
- 7 days/yr
- Hot days in 30 yrs
- 20 days/yr
Wind risk 8/10 · Major
- Chance of severe wind over 30 yrs
- 80.0%
Air-quality risk 2/10 · Minimal
- Unhealthy air days now
- 1 days/yr
- Unhealthy air days in 30 yrs
- 1 days/yr
Risk factors via First Street. Map © Google.
Why this score? — see what drove the C grade
The composite is a weighted blend of 9 inputs, each scored 0–100. Each bar is that input's sub-score; the figure is the points it added to the 100-point composite (weight × sub-score).
- Cash flow +20.2/30.0
- ARV discount +14.0/15.0
- DSCR +6.4/10.0
- Schools +4.6/10.0
- 1% rule +4.2/10.0
- Livability +3.9/5.0
- Rent growth +3.2/5.0
- Condition / age +2.5/5.0
- Appreciation +0.0/10.0
$259,900
🖨 Deal sheet 📄 Offer letter ✓ Due diligence
Listing remarks
Quality, space, and pride of ownership shine throughout this well-maintained Bay Pointe home! This 3-bedroom, 2-bath residence offers a thoughtful floor plan with a spacious sitting area just off the living room, providing the perfect spot for a home office, reading nook, or second living space. You'll appreciate the abundance of custom built-ins and storage throughout the home. The updated kitchen features granite countertops, stainless steel appliances, and plenty of workspace for everyday living and entertaining. Spacious bedrooms, a large formal dining room, and solid construction reflect the care this one-owner home has received over the years. Step outside to find a large storage buil
Key facts
- Golf cart garage
- Custom built-ins
- Updated kitchen
Tags
Property features AI
Finance
- HOA & community: Annual association fee of $150 (management included); Community clubhouse; Golf; Hiking/walking trails; Sidewalks; Street lights
Exterior
- Parking: 2-car garage with direct access and concrete flooring
- Utilities: Public water; Public sewer; Electricity connected; Cable connected
- Home design: Single-family house; One level; Move-in ready
- Construction: Brick exterior; Asphalt shingle roof; Slab foundation; Built (year source: assessor)
- Exterior features: Porch; Private yard; Outdoor lighting; Wood fencing; Shed(s); Workshop
Interior
- Kitchen: Built-in electric range; Built-in range; Built-in refrigerator; Dishwasher; Disposal; Microwave
- Flooring: Carpet; Hardwood
- Bathrooms: 2 full bathrooms and 1 half bathroom (3 total)
- Heating & cooling: Central heating (electric); Central air (electric); Ceiling fans
- Interior features: Granite counters; Dead bolt locks; Living room wood-burning fireplace
- Laundry & utility: Main-level laundry room; Electric water heater
Neighborhood map
What this means for you Summary
Snapshot
- This is a 4-bed/2.0-bath single-family listed at $260k.
Deal economics
- At list price, monthly cash flow is $327 ($4k/yr) — positive.
- The deal already cash-flows at list — no discount required.
- To meet the 1% rule (rent ≥ 1% of price), the offer needs to be $239k (8.0% below list).
- Recommended offer: $239k (8.0% below list) — sets the bar for 1% rule.
- Cap rate 7.8% vs local median 4.3% in Flowood — top-decile yield for the area; either an underpriced asset or a hidden risk that comps aren't pricing in. Stress-test before assuming the spread holds.
Location & tenants
- Location reads 77/100 on livability (#10 in MS, #3,075 nationally) — a middle-class / working-renter tenant base. Strengths: crime A+, cost of living A+, housing A+; Watch: amenities F, commute F.
- Rankin County School District (rural): math 56% / reading 48% proficiency, ranked #6 of 130 in MS (top 5%) — acceptable for families but not a draw, mixed tenant base, ~2y average lease.
- Zoned schools: Northshore Elementary (math 82% / reading 68%, grade A, #5 of 375 statewide, top 1%, 551 students, 100% FRL); Northwest Rankin Middle School (math 63% / reading 51%, grade B, #13 of 179 statewide, top 7%, 1,374 students, 100% FRL); Northwest Rankin High School (math 48% / reading 42%, grade D-, #34 of 197 statewide, top 17%, 1,898 students, 100% FRL) — zoned schools average 100% FRL vs 35% district-wide (65 pts higher); higher-poverty schools than district average — tighter screening recommended.
- Market conditions: Rents rising (+2.9%/yr); 433 active listings in the ZIP; 1 comparable units currently listed for rent nearby; solid renter incomes; 343 units permitted in Rankin County in 2024 (0 in 5+ unit buildings).
Forward outlook
- Local home prices are declining (-3.0%/yr); year-one equity from $2k of loan paydown is wiped out by about $8k of value loss. Plan a longer hold.
- Rankin County population projected at +17% by 2050 — long-run rental-demand tailwind backs the buy-and-hold thesis.
Negotiation context
- Only 1 days on market — expect competitive offers; lowballing is unlikely to land.
Risks & watch-outs
- Climate carrying-cost: severe wind risk, 80% chance of damaging wind over 30y; extreme-heat days projected 7→20/yr by 2055 (HVAC capex compounding) — expect insurance premiums to compound above CPI over the hold.
Questions for the listing agent
- What does the HOA fee cover, when was the last increase, and are there any pending special assessments or reserve-fund shortfalls?
- Is there a deadline driving the sale (1031 exchange, divorce, estate, relocation)? That informs how much negotiation room exists.
- Schools are B-rated — typically a magnet for longer-tenancy family renters. What's the average tenant stay here, and is there a school-zone premium baked into asking?
- What's the average days-on-market for RENTAL listings here right now (not sales)? A rising rental-DOM trend means longer vacancies and softer asking-rent achievability than the comps imply.
- What's the recent tenant-quality profile in this submarket — average credit score on applications, eviction rate, late-payment / NSF rate, and stable-employment percentage? A property-management company in the area should have these aggregated.
- How much new for-sale + rental construction is in the pipeline within 1–3 miles? Heavy new supply typically softens prices + rents 12–24 months out; constrained supply supports both.
Investment metrics
- 1% rule
- 0.92% ✗
- Cap rate
- 7.80%
- Cash-on-cash
- 5.40%
- DSCR
- 1.24
- GRM
- 9.1
CMA / ARV
- ARV (on-the-fly)
- $303,660
- Comps found
- 12
Show comp detail 12 sales within ~0.75 mi
| Address | Dist | Beds/Ba | Sqft | Sold | Price | $/sf | Match |
|---|---|---|---|---|---|---|---|
| 106 Bay Pointe Pl | 0.08mi | 3/2.0 (-1) | 2,188 (+1%) | 5mo | $299,777 | $137 | 85 |
| 600 Bay Pointe Ln | 0.04mi | 4/2.0 | 2,314 (+7%) | 3mo | $328,500 | $142 | 85 |
| 744 Bearing Way | 0.27mi | 4/2.5 | 2,101 (-3%) | 1mo | $418,900 | $199 | 79 |
| 2165 W Fairway Dr | 0.26mi | 3/2.0 (-1) | 2,168 (-0%) | 8mo | $299,000 | $138 | 76 |
| 102 Honeybee Cv | 0.37mi | 3/2.0 (-1) | 2,215 (+2%) | 13mo | $327,500 | $148 | 63 |
| 527 Ridge Cir | 0.43mi | 4/3.0 | 2,315 (+7%) | 2mo | $319,900 | $138 | 63 |
| 2150 W Fairway Dr | 0.23mi | 4/2.5 | 2,422 (+12%) | 6mo | $255,000 | $105 | 63 |
| 3083 E Fairway Dr | 0.31mi | 3/2.5 (-1) | 2,063 (-5%) | 10mo | $349,900 | $170 | 62 |
| 141 Vineyard Blvd | 0.26mi | 3/2.5 (-1) | 2,022 (-7%) | 14mo | $279,900 | $138 | 58 |
| 105 Pine Ridge Cir | 0.60mi | 3/2.0 (-1) | 2,220 (+2%) | 13mo | $310,000 | $140 | 52 |
| 118 Pine Ridge Cir | 0.54mi | 4/3.5 | 2,378 (+10%) | 2mo | $315,000 | $132 | 51 |
| 106 Pine Ridge Cir | 0.57mi | 3/2.0 (-1) | 2,082 (-4%) | 13mo | $309,900 | $149 | 51 |
Match score weights: distance 35% · size 25% · config 20% · recency 20%. Top-matched comps best support the ARV.
Projected returns pro-forma
-3.0% appreciation · 2.9% rent growth · sell at horizon
- IRR
- -8.1%
- Equity multiple
- 0.70×
- Total profit
- $-21,620
- Equity at exit
- $38,752
- IRR
- 1.3%
- Equity multiple
- 1.09×
- Total profit
- $6,589
- Equity at exit
- $22,471
Cash invested: $72,772 (down + closing). Projections, not guarantees.
Landlord ↔ Tenant lean methodology
- Overall (STATE)
- 90 Strongly Landlord-Friendly
- State Mississippi
- 90 Strongly Landlord-Friendly · R+11
- County
- — inherits STATE
- City
- — inherits STATE
ZIP-level market 39047
- Home prices YoY
- -32.6%
- Rents YoY
- 2.9%
- Active inventory
- 433
- Price-to-rent
- 9.1×
Monthly cashflow live
- Estimated rent
- $2,390 medium interval (Pro) →
- Mortgage (P&I)
- −$1,363
- Tax from tax record
- −$76 /mo · $918/yr
- Insurance
- −$108
- HOA
- −$13
- Vacancy / Maint / Mgmt
- −$502
- Net cashflow
- $327
Break-even live
UW: 25.0% down · 7.5% · 30yr · 1.5% tax · 5.0% vac · 8.0% maint · 8.0% mgmt
Financing live
Cash to close
- Down payment
- $64,975
- Closing costs
- $7,797
- Reserves months
- —
- Total cash needed
- —
Loan-product check · same deal, 3 products live
Conventional
25% down · 7.5% · 30yr
- Down + closing
- —
- Monthly P&I
- —
- Monthly cashflow
- —
- DSCR
- —
- Eligible?
- —
Personal DTI + credit; lowest rate.
DSCR
20% down · 8.5% · 30yr
- Down + closing
- —
- Monthly P&I
- —
- Monthly cashflow
- —
- DSCR
- —
- Eligible?
- —
No personal income docs; deal must DSCR.
Hard money
10% down · 12.0% · 12mo
- Down + closing
- —
- Monthly P&I
- —
- Monthly cashflow
- —
- DSCR
- —
- Eligible?
- —
Short-term bridge; refi at stabilization.
Rent comps 1 comps
| Address | Beds | Baths | Sqft | Rent | $/sqft | DOM | Units | Dist |
|---|---|---|---|---|---|---|---|---|
| 913 Caitlin Cv Brandon, MS | 3.0 | 2.0 | 1636 | $2,100 | $1.28 | 13d | 1 | 1.45mi |
HOA detail
- Monthly dues
- $13 · $156/yr
Listing history 2 events
-
2026-06-18remarks 699-char remark
-
2026-06-18$259,900 Active 1 DOM
ⓘ Source: listings_history table (triggers on properties + properties_extension) + one-shot
backfill from property_details.listing_events for pre-trigger history.
Tax reassessment forecast MS · Resets to sale price
- Current annual tax
- $918 · $76/mo
- Projected year-2 tax
- $2,053 · $171/mo
- Expected delta
- +$1,135/yr (+$95/mo · 123.7%)
ⓘ Screening estimate from a state-policy table — verify with the county assessor before closing.
Climate risk First Street
- Flood 1/10 Low FEMA zone X (unshaded) · 0% chance over 30 yrs
- Wildfire 3/10 Moderate
- Heat 7/10 Severe 7 d/yr ≥108°F today · 20 d/yr by 30 yrs out
- Wind 8/10 Severe 80% chance of damaging wind over 30 yrs
- Air quality 2/10 Low 1 unhealthy d/yr today · 1 by 30 yrs out
Nearby sold comps map
Loading sold comps map…
Walkable amenities ~0.75 mi
Loading nearby amenities…
Taxation est. · year 1
- Rental income
- $28,678
- − Mortgage interest
- −$14,558
- − Property taxes
- −$918
- − Insurance
- −$1,300
- − Repairs & maintenance
- −$2,294
- − Management
- −$2,294
- − HOA
- −$156
- − Depreciation
- −$7,561
- Taxable loss
- −$403
- Est. tax savings @ 24.0%
- +$97
- After-tax cash flow
- $4,024/yr
For passive investors: Depreciation is non-cash, so a rental often shows a tax loss while cash-flowing — sheltering income. Rental losses are passive: they offset passive income freely, and up to $25,000/yr can offset ordinary (W-2) income if you actively participate and your MAGI is under $100k (phasing out to $0 by $150k); unused losses carry forward. On sale, claimed depreciation is recaptured at up to 25%, and gains may owe capital-gains tax (a 1031 exchange can defer both). Figures are a year-1 estimate at your 24.0% rate — not tax advice; consult a CPA.
Schools (NCES district)
- District
- Rankin County School District
- NCES district ID
- 2803830
- Math proficiency
- 56% ▼ -4.00%
- Reading proficiency
- 48% ▼ -6.00%
- Median HH income
- $61,867
- Composite
- 45.62/100
- National rank
- #2587
- State rank
- #6 of 130 in MS
Livability — Flowood
- Score
- 77/100
- State rank
- #10
- US rank
- #3075
Category grades
Schools grade is shown separately in the Schools card above.
Census & demographics
- County
- Rankin County · 123,614 people
- City population
- 9,222
- Metro
- Jackson, MS
- Population (ZIP)
- 40,808
- Household income
- $100,347
- Rent vs Own
- Severe rent burden
- 551.0
Population outlook (Rankin County) Hauer SSP2
- Today (2025)
- 164,317 people
- By 2030
- 171,013 · +4.1%
- By 2040
- 182,723 · +11.2%
- By 2050
- 192,376 · +17.1%
- By 2075
- 209,535 · +27.5%
- By 2100
- 209,534 · +27.5%
Race, ethnicity, and origin ACS 2023
- Neighborhood character
- Predominantly White (77%)
- Race & ethnicity
- White 77% Black 16% Two or more races 4% Hispanic / Latino 2% Asian 1%
- Common ancestry
- Italian 4% Slovak 3% Serbian 3%
- Foreign-born
- 3% · Canada
- Languages at home
- 95% English-only · Spanish 3% Other Indo-European 1% Other Asian/Pacific 1%
Political lean MEDSL · Rankin
- 2024 margin
- Solid R (+47.1) · D 25.9% · R 73.0% · Other 1.0%
- 2008→2024 swing
- +6.4pp toward D · 2008: -53.5pp · 2024: -47.1pp
- All cycles
- 2024: R+47.1 2020: R+45.4 2016: R+52.9 2012: R+51.9 2008: R+53.5
Not yet ingested
- Civics
- —
Market trends
- HPI YoY
- ▼ -79.01%
- Current HPI
- 162.9709
- Rent YoY
- ▲ 2.90%
- Metro
- Jackson, MS
- State GDP YoY
- —
- F500 in state
- 0
Price history
1 event — show timeline
- 2026-06-18 Listed $259,900 MLSU
Property tax history
+1.7%/yrLatest (2025): $918 · +5.4% YoY. Source: county tax records.
Cash-flow waterfall
monthlySold comps — $/sqft
last 12 mo · ≤1 miLoading sold comps…