3104 Woodland Ridge Dr · Forest Heights, TX
Flood risk 5/10 · Moderate
- FEMA flood zone
- A
- Chance of flooding over 30 yrs
- 0.67%
- Est. flood insurance / yr
- $1,009 – $1,996
Fire risk 4/10 · Minor
- Est. fire insurance / yr
- $1,222 – $2,270
Heat risk 9/10 · Severe
- Hot days now (above 108°F)
- 7 days/yr
- Hot days in 30 yrs
- 23 days/yr
Wind risk 9/10 · Severe
- Chance of severe wind over 30 yrs
- 99.0%
Air-quality risk 2/10 · Minimal
- Unhealthy air days now
- 1 days/yr
- Unhealthy air days in 30 yrs
- 2 days/yr
Risk factors via First Street. Map © Google.
Why this score? — see what drove the B- grade
The composite is a weighted blend of 9 inputs, each scored 0–100. Each bar is that input's sub-score; the figure is the points it added to the 100-point composite (weight × sub-score).
- Cash flow +30.0/30.0
- 1% rule +10.0/10.0
- DSCR +10.0/10.0
- ARV discount +7.5/15.0
- Schools +3.3/10.0
- Rent growth +2.5/5.0
- Livability +2.5/5.0
- Condition / age +2.5/5.0
- Appreciation +0.0/10.0
$55,000
🖨 Deal sheet 📄 Offer letter ✓ Due diligence
Listing remarks MLS
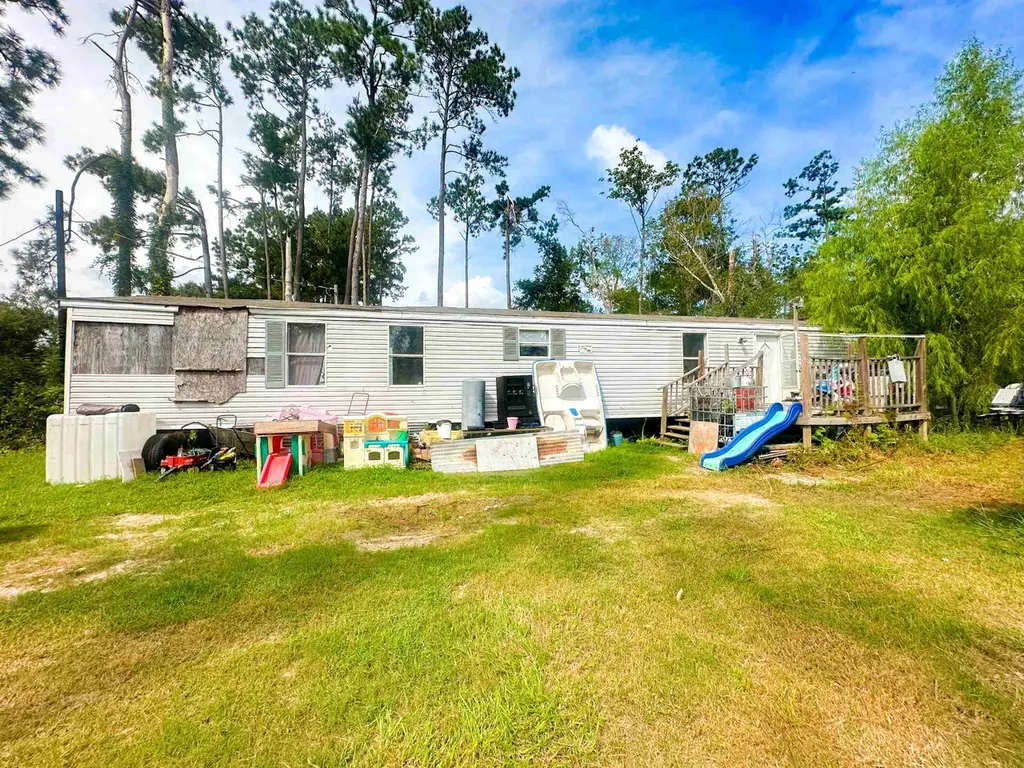
LCM acreage, nearly 2 acres of mostly cleared land. Property does need to be brush hogged again, but most of the thick trees have been removed. 80% of the land is high and dry, there is some clear cutting where you are able to ride to the back of the property. Utilities are present and the seller does currently live in the mobile home. Mobile home is given little to no value, it is livable currently and will be sold with the land. Primary bedroom took on a tree during a storm in 2022, seller capped electrical in that room and fixed the plywood on roof, nothing more was repaired. Primary bedroom needs work, all plumbing is still operable. Damage was to the roof and siding. Seller will take all personal belongings from home and the land prior to closing.
Key facts
- 1.88 acre lot
- Listed 84 days
Neighborhood map
What this means for you Summary
Snapshot
- This is a 3-bed/2.0-bath manufactured listed at $55k.
Deal economics
- At list price, monthly cash flow is $585 ($7k/yr) — positive.
- The deal already cash-flows at list — no discount required.
- Meets the 1% rule at list price ($1k rent vs $55k).
- Recommended offer: $52k (6.0% below list) — sets the bar for market timing.
Location & tenants
- Location reads: area grade B — affects rentability + tenant quality, not the cash-flow math above.
- Little Cypress-Mauriceville CISD (rural): math 35% / reading 40% proficiency, ranked #435 of 826 in TX (top 53%) — families likely to look elsewhere, expect single-tenant / working-renter base with shorter leases.
- Market conditions: 294 active listings in the ZIP; 235 units permitted in Orange County in 2024 (50 in 5+ unit buildings).
Forward outlook
- Local home prices are declining (-3.0%/yr); year-one equity from $380 of loan paydown is wiped out by about $2k of value loss. Plan a longer hold.
- Orange County population projected at +6% by 2050 — modest demand growth; plan on rents tracking national, not racing it.
- At projected returns (-3.0% appreciation + 3.0% rent growth), your $15k cash investment doubles in ~3 years — after that, you're playing with house money.
Negotiation context
- It's been on market 84 days — a 6% lower offer ($52k) is reasonable based on typical stale-listing flexibility.
Risks & watch-outs
- Watch-outs: flood insurance adds $125/mo.
- Climate carrying-cost: in FEMA flood zone A (mandatory federal flood insurance); severe wind risk, 99% chance of damaging wind over 30y; extreme-heat days projected 7→23/yr by 2055 (HVAC capex compounding) — expect insurance premiums to compound above CPI over the hold.
Questions for the listing agent
- It's been on market 84 days. Have you received any prior offers? Is the seller open to a 6% concession, seller financing, or rate buy-down credit?
- What's the actual annual flood-insurance premium (NFIP or private), and is the property in a SFHA with mandatory coverage?
- Why hasn't it sold? Are there any deal-killer items the seller is aware of (foundation, flood, title, zoning, code violations)?
- Is there a deadline driving the sale (1031 exchange, divorce, estate, relocation)? That informs how much negotiation room exists.
- What's the average days-on-market for RENTAL listings here right now (not sales)? A rising rental-DOM trend means longer vacancies and softer asking-rent achievability than the comps imply.
- What's the recent tenant-quality profile in this submarket — average credit score on applications, eviction rate, late-payment / NSF rate, and stable-employment percentage? A property-management company in the area should have these aggregated.
- How much new for-sale + rental construction is in the pipeline within 1–3 miles? Heavy new supply typically softens prices + rents 12–24 months out; constrained supply supports both.
Investment metrics
- 1% rule
- 2.56% ✓
- Cap rate
- 21.79%
- Cash-on-cash
- 55.33%
- DSCR
- 3.46
- GRM
- 3.3
CMA / ARV
No comps found within radius.
Projected returns pro-forma
-3.0% appreciation · 3.0% rent growth · sell at horizon
- IRR
- 42.8%
- Equity multiple
- 2.85×
- Total profit
- $28,450
- Equity at exit
- $8,201
- IRR
- 48.9%
- Equity multiple
- 5.75×
- Total profit
- $73,196
- Equity at exit
- $4,755
Cash invested: $15,400 (down + closing). Projections, not guarantees.
Landlord ↔ Tenant lean methodology
- Overall (STATE)
- 87 Strongly Landlord-Friendly
- State Texas
- 87 Strongly Landlord-Friendly · R+5
- County
- — inherits STATE
- City
- — inherits STATE
ZIP-level market 77632
- Home prices YoY
- -31.6%
- Active inventory
- 294
- Price-to-rent
- 3.3×
Monthly cashflow live
- Estimated rent
- $1,410 medium interval (Pro) →
- Mortgage (P&I)
- −$288
- Tax from tax record
- −$92 /mo · $1,106/yr
- Insurance
- −$23
- Flood insurance flood zone
- −$125 /mo · $1,502/yr
- HOA
- −$0
- Vacancy / Maint / Mgmt
- −$296
- Net cashflow
- $585
Break-even live
UW: 25.0% down · 7.5% · 30yr · 1.5% tax · 5.0% vac · 8.0% maint · 8.0% mgmt
Financing live
Cash to close
- Down payment
- $13,750
- Closing costs
- $1,650
- Reserves months
- —
- Total cash needed
- —
Loan-product check · same deal, 3 products live
Conventional
25% down · 7.5% · 30yr
- Down + closing
- —
- Monthly P&I
- —
- Monthly cashflow
- —
- DSCR
- —
- Eligible?
- —
Personal DTI + credit; lowest rate.
DSCR
20% down · 8.5% · 30yr
- Down + closing
- —
- Monthly P&I
- —
- Monthly cashflow
- —
- DSCR
- —
- Eligible?
- —
No personal income docs; deal must DSCR.
Hard money
10% down · 12.0% · 12mo
- Down + closing
- —
- Monthly P&I
- —
- Monthly cashflow
- —
- DSCR
- —
- Eligible?
- —
Short-term bridge; refi at stabilization.
Listing history 17 events
-
2026-06-18days on market $55,000 Active 84 DOM
-
2026-06-17days on market $55,000 Active 83 DOM
-
2026-06-16days on market $55,000 Active 82 DOM
-
2026-06-15days on market $55,000 Active 81 DOM
-
2026-06-14days on market $55,000 Active 79 DOM
-
2026-06-13days on market $55,000 Active 78 DOM
-
2026-06-10days on market $55,000 Active 76 DOM
-
2026-06-09days on market $55,000 Active 75 DOM
-
2026-06-08days on market $55,000 Active 74 DOM
-
2026-06-07days on market $55,000 Active 73 DOM
-
2026-06-03days on market $55,000 Active 69 DOM
-
2026-06-02days on market $55,000 Active 68 DOM
-
2026-06-01days on market $55,000 Active 67 DOM
-
2026-05-31days on market $55,000 Active 66 DOM
-
2026-05-30days on market $55,000 Active 65 DOM
-
2026-03-26$55,000 Active 762-char remark
Show marketing remark (762 chars)
LCM acreage, nearly 2 acres of mostly cleared land. Property does need to be brush hogged again, but most of the thick trees have been removed. 80% of the land is high and dry, there is some clear cutting where you are able to ride to the back of the property. Utilities are present and the seller does currently live in the mobile home. Mobile home is given little to no value, it is livable currently and will be sold with the land. Primary bedroom took on a tree during a storm in 2022, seller capped electrical in that room and fixed the plywood on roof, nothing more was repaired. Primary bedroom needs work, all plumbing is still operable. Damage was to the roof and siding. Seller will take all personal belongings from home and the land prior to closing.
-
2024-04-05soldstatus
ⓘ Source: listings_history table (triggers on properties + properties_extension) + one-shot
backfill from property_details.listing_events for pre-trigger history.
Tax reassessment forecast TX · Resets to sale price
- Current annual tax
- $1,106 · $92/mo
- Projected year-2 tax
- $1,106 · $92/mo
- Expected delta
- $0/yr ($0/mo · 0.0%)
ⓘ Screening estimate from a state-policy table — verify with the county assessor before closing.
Climate risk First Street
- Flood 5/10 Major FEMA zone A · 67% chance over 30 yrs
- Wildfire 4/10 Moderate
- Heat 9/10 Extreme 7 d/yr ≥108°F today · 23 d/yr by 30 yrs out
- Wind 9/10 Extreme 99% chance of damaging wind over 30 yrs
- Air quality 2/10 Low 1 unhealthy d/yr today · 2 by 30 yrs out
Nearby sold comps map
Loading sold comps map…
Walkable amenities ~0.75 mi
Loading nearby amenities…
Taxation est. · year 1
- Rental income
- $16,915
- − Mortgage interest
- −$3,081
- − Property taxes
- −$1,106
- − Insurance
- −$1,778
- − Repairs & maintenance
- −$1,353
- − Management
- −$1,353
- − Depreciation
- −$1,600
- Taxable income
- $6,644
- Est. tax owed @ 24.0%
- −$1,595
- After-tax cash flow
- $5,424/yr
For passive investors: Depreciation is non-cash, so a rental often shows a tax loss while cash-flowing — sheltering income. Rental losses are passive: they offset passive income freely, and up to $25,000/yr can offset ordinary (W-2) income if you actively participate and your MAGI is under $100k (phasing out to $0 by $150k); unused losses carry forward. On sale, claimed depreciation is recaptured at up to 25%, and gains may owe capital-gains tax (a 1031 exchange can defer both). Figures are a year-1 estimate at your 24.0% rate — not tax advice; consult a CPA.
Schools (NCES district)
- District
- Little Cypress-Mauriceville CISD
- NCES district ID
- 4827690
- Math proficiency
- 35% ▼ -5.00%
- Reading proficiency
- 40% ▲ 1.00%
- Median HH income
- $60,483
- Composite
- 33.41/100
- National rank
- #5473
- State rank
- #435 of 826 in TX
Livability — Forest Heights
No livability data for this city. (Only ~50 U.S. cities are tracked.)
Census & demographics
- Census place
- Forest Heights, TX
- County
- Orange County · 87,112 people
- Metro
- Beaumont-Port Arthur, TX
- Population (ZIP)
- 22,976
- Household income
- $74,418
- Rent vs Own
- Severe rent burden
- 431.0
Population outlook (Orange County) Hauer SSP2
- Today (2025)
- 88,065 people
- By 2030
- 89,591 · +1.7%
- By 2040
- 91,982 · +4.4%
- By 2050
- 93,023 · +5.6%
- By 2075
- 94,871 · +7.7%
- By 2100
- 88,155 · +0.1%
Race, ethnicity, and origin ACS 2023
- Neighborhood character
- Predominantly White (85%)
- Race & ethnicity
- White 85% Hispanic / Latino 8% Two or more races 6% Black 4%
- Hispanic origin (detail)
- Mexican 6%
- Common ancestry
- Lithuanian 8% Slovak 2% Italian 2%
- Foreign-born
- 2% · Canada
- Languages at home
- 95% English-only · Spanish 4%
Political lean MEDSL · Orange
- 2024 margin
- Solid R (+66.8) · D 16.4% · R 83.1%
- 2008→2024 swing
- -19.6pp toward R · 2008: -47.1pp · 2024: -66.8pp
- All cycles
- 2024: R+66.8 2020: R+63.4 2016: R+61.9 2012: R+54.3 2008: R+47.1
Not yet ingested
- Civics
- —
Market trends
- HPI YoY
- ▼ -68.96%
- Current HPI
- 149.354
- Rent YoY
- —
- Metro
- Beaumont-Port Arthur, TX
- State GDP YoY
- ▲ 3.95%
- F500 in state
- 110
Industry mix (Fortune 500 HQ in TX)
| Industry | F500 HQs | Revenue |
|---|---|---|
| Energy | 16 | $1,198B |
|
||
| Technology | 5 | $198B |
|
||
| Engineering / Construction | 4 | $72B |
|
||
| Energy Services | 3 | $60B |
|
||
| Utilities | 3 | $41B |
|
||
| Healthcare | 2 | $330B |
|
||
Price history
2 events — show timeline
- 2026-03-26 Listed $55,000 BBOR
- 2024-04-05 Sold (Public Records) — Public Records
Property tax history
+15.5%/yrLatest (2025): $1,106 · -20.0% YoY. Source: county tax records.
Cash-flow waterfall
monthlySold comps — $/sqft
last 12 mo · ≤1 miLoading sold comps…