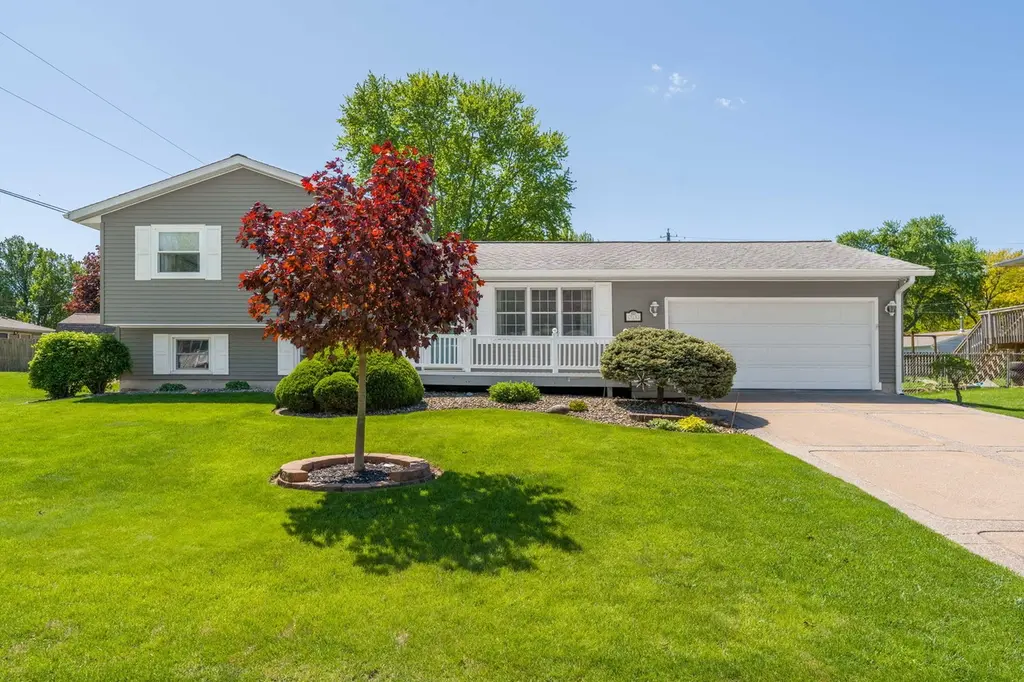
918 6th St · Hampton, IL
Flood risk 1/10 · Minimal
- FEMA flood zone
- X (unshaded)
- Chance of flooding over 30 yrs
- 0.0%
- Est. flood insurance / yr
- $507 – $1,088
Fire risk 1/10 · Minimal
- Est. fire insurance / yr
- $804 – $1,492
Heat risk 3/10 · Minor
- Hot days now (above 103°F)
- 7 days/yr
- Hot days in 30 yrs
- 16 days/yr
Wind risk 2/10 · Minimal
- Chance of severe wind over 30 yrs
- —
Air-quality risk 2/10 · Minimal
- Unhealthy air days now
- 1 days/yr
- Unhealthy air days in 30 yrs
- 2 days/yr
Risk factors via First Street. Map © Google.
Why this score? — see what drove the C+ grade
The composite is a weighted blend of 9 inputs, each scored 0–100. Each bar is that input's sub-score; the figure is the points it added to the 100-point composite (weight × sub-score).
- Cash flow +27.5/30.0
- DSCR +9.7/10.0
- 1% rule +7.7/10.0
- Appreciation +6.3/10.0
- Livability +3.4/5.0
- Rent growth +2.5/5.0
- Condition / age +2.5/5.0
- Schools +1.2/10.0
- ARV discount +0.0/15.0
$260,000
🖨 Deal sheet 📄 Offer letter ✓ Due diligence
Listing remarks
This lovely home in the quaint Village of Hampton, IL is neat as a pin, with years of pride of ownership shining through at every turn. The three-bedroom, two full bathroom side split offers a spacious layout, highlighted by a huge great room addition (with a second full bath) with expansive windows overlooking the backyard-perfect for gathering, entertaining, and everyday living. The main level also features an updated kitchen with granite counters, stylish backsplash, stainless steel appliances, full pantry, dedicated dining space, a dry bar, and a formal living room. Upstairs you will find all three bedrooms and a full bath, while the finished basement with updated fireplace provides ad
Key facts
- 9,583 sq ft lot
- Built 1970
- Listed 4 days
Property features AI
Finance
- Other: Living area and square footage sources reported by assessor; Below-grade finished area and additional finished/unfinished area information available
- Financial info: Tax exemptions: Homeowner and Senior
- HOA & community: No master association fee required
Exterior
- Parking: Parking details not provided
- Security: No security features listed
- Utilities: Public water; Public sewer
- Home design: Detached single-family split-level home; Fee simple ownership; Approximately 51-60 years old; Asphalt roof; Facing direction not specified
- Construction: Vinyl siding; Block foundation; Built before 1978
- Exterior features: Level lot; Screened porch (approximately 14 x 14); Family room and living spaces include exterior-accessible areas
Interior
- Kitchen: Island; Walk-in pantry; Granite counters; Range; Microwave; Dishwasher; Refrigerator; Kitchen/dining combo
- Bedrooms: 3 bedrooms total; Master bedroom on the second level (approximately 15 x 14); Two additional second-level bedrooms (each approximately 10 x 9)
- Flooring: Laminate flooring in main living areas; Carpet in bedrooms
- Bathrooms: 2 full bathrooms
- Heating & cooling: Natural gas heating with baseboard; Electric cooling
- Interior features: First-floor full bathroom; Skylights; Finished basement with egress window and partial crawl space; 1 fireplace in the family room; 8 total rooms
- Laundry & utility: Basement laundry (approximately 10 x 6)
Neighborhood map
What this means for you Summary
Snapshot
- This is a 3-bed/2.0-bath single-family listed at $260k.
Deal economics
- At list price, monthly cash flow is $771 ($9k/yr) — positive.
- The deal already cash-flows at list — no discount required.
- Meets the 1% rule at list price ($3k rent vs $260k).
Location & tenants
- Location reads 67/100 on livability (#508 in IL) — a middle-class / working-renter tenant base. Strengths: crime A+, cost of living A+, housing A+; Watch: amenities F, commute F, health & safety F.
- United Twp Hsd 30 (suburban): math 12% / reading 15% proficiency, ranked #536 of 620 in IL (top 86%) — low school quality limits family demand, transient renter base, plan for 1-2y turnover.
- Market conditions: 16 active listings in the ZIP; 1 comparable units currently listed for rent nearby; 116 units permitted in Rock Island County in 2024 (50 in 5+ unit buildings).
Forward outlook
- In year one you build about $9k of equity ($2k loan paydown + $7k appreciation (2.7% local appreciation)).
- Rock Island County population projected at -12% by 2050 — secular population decline; favor cash flow + early exit over multi-decade hold.
- At projected returns (2.7% appreciation + 3.0% rent growth), your $73k cash investment doubles in ~4 years — after that, you're playing with house money.
- By year 5, paydown + projected appreciation supports a ~$38k cash-out refi (75% LTV) — recoverable capital for the next deal without selling this one.
Negotiation context
- Only 4 days on market — expect competitive offers; lowballing is unlikely to land.
Questions for the listing agent
- Built in 1970 — when were the roof, HVAC, electrical panel, plumbing, and water heater last replaced?
- Is there a deadline driving the sale (1031 exchange, divorce, estate, relocation)? That informs how much negotiation room exists.
- What's the average days-on-market for RENTAL listings here right now (not sales)? A rising rental-DOM trend means longer vacancies and softer asking-rent achievability than the comps imply.
- What's the recent tenant-quality profile in this submarket — average credit score on applications, eviction rate, late-payment / NSF rate, and stable-employment percentage? A property-management company in the area should have these aggregated.
- How much new for-sale + rental construction is in the pipeline within 1–3 miles? Heavy new supply typically softens prices + rents 12–24 months out; constrained supply supports both.
Investment metrics
- 1% rule
- 1.27% ✓
- Cap rate
- 9.85%
- Cash-on-cash
- 12.71%
- DSCR
- 1.57
- GRM
- 6.6
CMA / ARV
- ARV (on-the-fly)
- $190,000
- Comps found
- 4
Show comp detail 4 sales within ~0.75 mi
| Address | Dist | Beds/Ba | Sqft | Sold | Price | $/sf | Match |
|---|---|---|---|---|---|---|---|
| 1005 5th Street A | 0.08mi | 3/1.0 | 1,320 (-13%) | 2mo | $239,900 | $182 | 68 |
| 626 14th Ave | 0.31mi | 3/1.5 | 1,398 (-8%) | 5mo | $155,400 | $111 | 66 |
| 623 12th Ave | 0.24mi | 4/2.0 (+1) | 1,600 (+5%) | 15mo | $185,000 | $116 | 62 |
| 304 7th St | 0.46mi | 3/2.0 | 1,725 (+14%) | 4mo | $215,000 | $125 | 53 |
Match score weights: distance 35% · size 25% · config 20% · recency 20%. Top-matched comps best support the ARV.
Projected returns pro-forma
2.69% appreciation · 3.0% rent growth · sell at horizon
- IRR
- 18.7%
- Equity multiple
- 2.05×
- Total profit
- $76,190
- Equity at exit
- $112,326
- IRR
- 20.3%
- Equity multiple
- 3.86×
- Total profit
- $207,978
- Equity at exit
- $169,628
Cash invested: $72,800 (down + closing). Projections, not guarantees.
Landlord ↔ Tenant lean methodology
- Overall (STATE)
- 43 Moderately Tenant-Leaning
- State Illinois
- 43 Moderately Tenant-Leaning · D+7
- County
- — inherits STATE
- City
- — inherits STATE
ZIP-level market 61256
- Home prices YoY
- 1.6%
- Active inventory
- 16
- Price-to-rent
- 6.6×
Monthly cashflow live
- Estimated rent
- $3,300 medium interval (Pro) →
- Mortgage (P&I)
- −$1,363
- Tax from tax record
- −$364 /mo · $4,371/yr
- Insurance
- −$108
- HOA
- −$0
- Vacancy / Maint / Mgmt
- −$693
- Net cashflow
- $771
Break-even live
UW: 25.0% down · 7.5% · 30yr · 1.5% tax · 5.0% vac · 8.0% maint · 8.0% mgmt
Financing live
Cash to close
- Down payment
- $65,000
- Closing costs
- $7,800
- Reserves months
- —
- Total cash needed
- —
Loan-product check · same deal, 3 products live
Conventional
25% down · 7.5% · 30yr
- Down + closing
- —
- Monthly P&I
- —
- Monthly cashflow
- —
- DSCR
- —
- Eligible?
- —
Personal DTI + credit; lowest rate.
DSCR
20% down · 8.5% · 30yr
- Down + closing
- —
- Monthly P&I
- —
- Monthly cashflow
- —
- DSCR
- —
- Eligible?
- —
No personal income docs; deal must DSCR.
Hard money
10% down · 12.0% · 12mo
- Down + closing
- —
- Monthly P&I
- —
- Monthly cashflow
- —
- DSCR
- —
- Eligible?
- —
Short-term bridge; refi at stabilization.
Rent comps 1 comps
| Address | Beds | Baths | Sqft | Rent | $/sqft | DOM | Units | Dist |
|---|---|---|---|---|---|---|---|---|
| 821 1st Ave Hampton, IL | 3.0 | 2.5 | 1750 | $3,300 | $1.89 | 13d | 1 | 0.63mi |
Listing history 2 events
-
2026-05-04status Pending
-
2026-04-30$260,000 Active
ⓘ Source: listings_history table (triggers on properties + properties_extension) + one-shot
backfill from property_details.listing_events for pre-trigger history.
Tax reassessment forecast IL · Partial reset (capped growth)
- Current annual tax
- $4,371 · $364/mo
- Projected year-2 tax
- $5,137 · $428/mo
- Expected delta
- +$765/yr (+$64/mo · 17.5%)
ⓘ Screening estimate from a state-policy table — verify with the county assessor before closing.
Climate risk First Street
- Flood 1/10 Low FEMA zone X (unshaded) · 0% chance over 30 yrs
- Wildfire 1/10 Low
- Heat 3/10 Moderate 7 d/yr ≥103°F today · 16 d/yr by 30 yrs out
- Wind 2/10 Low
- Air quality 2/10 Low 1 unhealthy d/yr today · 2 by 30 yrs out
Nearby sold comps map
Loading sold comps map…
Walkable amenities ~0.75 mi
Loading nearby amenities…
Taxation est. · year 1
- Rental income
- $39,600
- − Mortgage interest
- −$14,564
- − Property taxes
- −$4,371
- − Insurance
- −$1,300
- − Repairs & maintenance
- −$3,168
- − Management
- −$3,168
- − Depreciation
- −$7,564
- Taxable income
- $5,465
- Est. tax owed @ 24.0%
- −$1,312
- After-tax cash flow
- $7,940/yr
For passive investors: Depreciation is non-cash, so a rental often shows a tax loss while cash-flowing — sheltering income. Rental losses are passive: they offset passive income freely, and up to $25,000/yr can offset ordinary (W-2) income if you actively participate and your MAGI is under $100k (phasing out to $0 by $150k); unused losses carry forward. On sale, claimed depreciation is recaptured at up to 25%, and gains may owe capital-gains tax (a 1031 exchange can defer both). Figures are a year-1 estimate at your 24.0% rate — not tax advice; consult a CPA.
Schools (NCES district)
- District
- United Twp Hsd 30
- NCES district ID
- 1739870
- Math proficiency
- 12% ▼ -5.00%
- Reading proficiency
- 15% ▼ -6.00%
- Median HH income
- $43,647
- Composite
- 11.91/100
- National rank
- #9670
- State rank
- #536 of 620 in IL
Livability — Hampton
- Score
- 67/100
- State rank
- #508
- US rank
- #10505
Category grades
Schools grade is shown separately in the Schools card above.
Census & demographics
- Census place
- Hampton, IL
- City population
- 1,946
- Population (ZIP)
- 1,946
Population outlook (Rock Island County) Hauer SSP2
- Today (2025)
- 140,982 people
- By 2030
- 137,705 · -2.3%
- By 2040
- 130,512 · -7.4%
- By 2050
- 123,841 · -12.2%
- By 2075
- 109,851 · -22.1%
- By 2100
- 90,922 · -35.5%
Race, ethnicity, and origin ACS 2023
- Neighborhood character
- Predominantly White (76%)
- Race & ethnicity
- White 76% Hispanic / Latino 16% Two or more races 9% Black 2% Native American 1%
- Hispanic origin (detail)
- Mexican 16%
- Common ancestry
- Slovak 3% English 3% Italian 1%
- Foreign-born
- 2% · Canada
- Languages at home
- 93% English-only · Spanish 6% German/W. Germanic 1%
Political lean MEDSL · Rock Island
- 2024 margin
- Lean D (+9.6) · D 53.9% · R 44.4% · Other 1.7%
- 2008→2024 swing
- -15.0pp toward R · 2008: 24.6pp · 2024: 9.6pp
- All cycles
- 2024: D+9.6 2020: D+12.1 2016: D+8.4 2012: D+21.9 2008: D+24.6
Not yet ingested
- Civics
- —
Market trends
- HPI YoY
- ▲ 2.69%
- Current HPI
- 165.0514
- Rent YoY
- —
- Metro
- —
- State GDP YoY
- ▲ 1.59%
- F500 in state
- 60
Industry mix (Fortune 500 HQ in IL)
| Industry | F500 HQs | Revenue |
|---|---|---|
| Insurance | 4 | $201B |
|
||
| Consumer Goods | 4 | $87B |
|
||
| Industrial Machinery | 3 | $64B |
|
||
| Healthcare | 2 | $55B |
|
||
| Retail / Pharmacy | 1 | $148B |
|
||
| Agriculture / Food | 1 | $86B |
|
||
Price history
2 events — show timeline
- 2026-05-04 Pending — MRED as Distributed by MLS Grid
- 2026-04-30 Listed $260,000 MRED as Distributed by MLS Grid
Property tax history
+4.1%/yrLatest (2024): $4,371 · +2.0% YoY. Source: county tax records.
Cash-flow waterfall
monthlySold comps — $/sqft
last 12 mo · ≤1 miLoading sold comps…