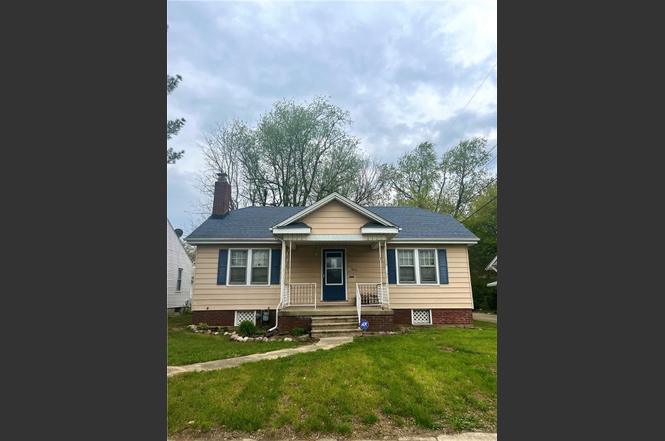
1653 N Maple Ave · Decatur, IL
Flood risk 1/10 · Minimal
- FEMA flood zone
- X (unshaded)
- Chance of flooding over 30 yrs
- 0.0%
- Est. flood insurance / yr
- $473 – $860
Fire risk 1/10 · Minimal
- Est. fire insurance / yr
- $804 – $1,492
Heat risk 3/10 · Minor
- Hot days now (above 105°F)
- 7 days/yr
- Hot days in 30 yrs
- 19 days/yr
Wind risk 2/10 · Minimal
- Chance of severe wind over 30 yrs
- 1.0%
Air-quality risk 2/10 · Minimal
- Unhealthy air days now
- 1 days/yr
- Unhealthy air days in 30 yrs
- 1 days/yr
Risk factors via First Street. Map © Google.
Why this score? — see what drove the B+ grade
The composite is a weighted blend of 9 inputs, each scored 0–100. Each bar is that input's sub-score; the figure is the points it added to the 100-point composite (weight × sub-score).
- Cash flow +30.0/30.0
- ARV discount +14.2/15.0
- 1% rule +10.0/10.0
- DSCR +10.0/10.0
- Appreciation +3.9/10.0
- Livability +3.0/5.0
- Rent growth +2.5/5.0
- Condition / age +2.5/5.0
- Schools +0.4/10.0
$50,000
🖨 Deal sheet 📄 Offer letter ✓ Due diligence
Listing remarks MLS
Very nice bungalow, craftsman style home. Updates includes new furnace & air in '05, carpet & paint. Large back yard could easily be fenced. Nice fireplace for cozy evenings.
Key facts
- New furnace
- Pex plumbing
- New water heater
Tags
Neighborhood map
What this means for you Summary
Snapshot
- This is a 2-bed/1.0-bath single-family listed at $50k.
Deal economics
- At list price, monthly cash flow is $451 ($5k/yr) — positive.
- The deal already cash-flows at list — no discount required.
- Meets the 1% rule at list price ($1k rent vs $50k).
- Recommended offer: $44k (12.0% below list) — sets the bar for market timing.
- Cap rate 17.1% vs local median 7.0% in Decatur — top-decile yield for the area; either an underpriced asset or a hidden risk that comps aren't pricing in. Stress-test before assuming the spread holds.
Location & tenants
- Location reads 59/100 on livability (#1,076 in IL) — a working-class tenant base; expect higher turnover. Strengths: cost of living A+, housing A+; Watch: schools F, crime F, amenities F.
- Decatur SD 61 (urban): math 3% / reading 6% proficiency, ranked #605 of 620 in IL (top 98%) — low school quality limits family demand, transient renter base, plan for 1-2y turnover; 73% free/reduced lunch — lower-income household profile, screen leases tightly.
- Market conditions: 135 active listings in the ZIP; 10 comparable units currently listed for rent nearby; rentals lingering (median 44d on market — plan ~5-8 weeks vacancy on turnover, expect pricing pressure); 90% of comp listings sitting > 30 days — soft ceiling on asking rent; 63 units permitted in Macon County in 2024 (0 in 5+ unit buildings).
Forward outlook
- Local home prices are declining (-2.2%/yr); year-one equity from $346 of loan paydown is wiped out by about $1k of value loss. Plan a longer hold.
- Macon County population projected at -24% by 2050 — secular population decline; favor cash flow + early exit over multi-decade hold.
- At projected returns (-2.2% appreciation + 3.0% rent growth), your $14k cash investment doubles in ~3 years — after that, you're playing with house money.
Negotiation context
- It's been on market 167 days — a 12% lower offer ($44k) is reasonable based on typical stale-listing flexibility.
- 3 sale attempts since 20y ago; this cycle's ask has dropped $10k (17%) from the opening price — seller is motivated, your offer sets the floor, not the list.
Risks & watch-outs
- Watch-outs: built in 1927 — expect roof / HVAC / electrical / plumbing capex.
Questions for the listing agent
- It's been on market 167 days. Have you received any prior offers? Is the seller open to a 12% concession, seller financing, or rate buy-down credit?
- Built in 1927 — when were the roof, HVAC, electrical panel, plumbing, and water heater last replaced?
- Why hasn't it sold? Are there any deal-killer items the seller is aware of (foundation, flood, title, zoning, code violations)?
- Is there a deadline driving the sale (1031 exchange, divorce, estate, relocation)? That informs how much negotiation room exists.
- Schools are F-rated, which usually means shorter tenancies and higher turnover. Who's the typical renter profile here, and what's been the actual vacancy rate?
- Crime grade is F in this area — have there been break-ins, vandalism, or insurance claims at this property in the last 3 years? What carrier currently insures it and at what premium?
- What's the average days-on-market for RENTAL listings here right now (not sales)? A rising rental-DOM trend means longer vacancies and softer asking-rent achievability than the comps imply.
- What's the recent tenant-quality profile in this submarket — average credit score on applications, eviction rate, late-payment / NSF rate, and stable-employment percentage? A property-management company in the area should have these aggregated.
- How much new for-sale + rental construction is in the pipeline within 1–3 miles? Heavy new supply typically softens prices + rents 12–24 months out; constrained supply supports both.
Investment metrics
- 1% rule
- 2.09% ✓
- Cap rate
- 17.12%
- Cash-on-cash
- 38.68%
- DSCR
- 2.72
- GRM
- 4.0
CMA / ARV
- ARV (on-the-fly)
- $58,680
- Comps found
- 12
Show comp detail 12 sales within ~0.75 mi
| Address | Dist | Beds/Ba | Sqft | Sold | Price | $/sf | Match |
|---|---|---|---|---|---|---|---|
| 780 Cushing St | 0.09mi | 2/1.0 | 1,050 (+7%) | 5mo | $25,000 | $24 | 80 |
| 777 W Harper Ave | 0.36mi | 2/1.0 | 1,003 (+3%) | 2mo | $88,000 | $88 | 77 |
| 1429 Walnut Grove Ave | 0.24mi | 2/1.0 | 884 (-10%) | 1mo | $35,000 | $40 | 72 |
| 67 Maple Ct | 0.50mi | 2/1.0 | 952 (-3%) | 1mo | $64,500 | $68 | 72 |
| 1356 Huron St | 0.28mi | 3/1.0 (+1) | 936 (-4%) | 5mo | $31,500 | $34 | 71 |
| 377 Burtschi Ct | 0.43mi | 3/1.0 (+1) | 1,001 (+2%) | 3mo | $25,000 | $25 | 69 |
| 1920 Gebhart Ct | 0.29mi | 2/1.0 | 873 (-11%) | 4mo | $52,000 | $60 | 65 |
| 18 Maple Ct | 0.49mi | 2/1.5 | 1,040 (+6%) | 1mo | $105,000 | $101 | 64 |
| 2148 N Graceland Ave | 0.37mi | 2/1.0 | 864 (-12%) | 3mo | $37,000 | $43 | 61 |
| 2050 College St | 0.37mi | 2/1.0 | 839 (-14%) | 5mo | $36,000 | $43 | 55 |
| 1059 Packard St | 0.55mi | 2/2.0 | 837 (-14%) | 3mo | $76,500 | $91 | 44 |
| 947 N Hill Ave | 0.74mi | 2/1.0 | 832 (-15%) | 3mo | $54,500 | $66 | 38 |
Match score weights: distance 35% · size 25% · config 20% · recency 20%. Top-matched comps best support the ARV.
Projected returns pro-forma
-2.21% appreciation · 3.0% rent growth · sell at horizon
- IRR
- 36.2%
- Equity multiple
- 2.60×
- Total profit
- $22,336
- Equity at exit
- $9,224
- IRR
- 42.0%
- Equity multiple
- 5.15×
- Total profit
- $58,061
- Equity at exit
- $7,423
Cash invested: $14,000 (down + closing). Projections, not guarantees.
Landlord ↔ Tenant lean methodology
- Overall (STATE)
- 43 Moderately Tenant-Leaning
- State Illinois
- 43 Moderately Tenant-Leaning · D+7
- County
- — inherits STATE
- City
- — inherits STATE
ZIP-level market 62526
- Home prices YoY
- -1.2%
- Active inventory
- 135
- Price-to-rent
- 4.0×
Monthly cashflow live
- Estimated rent
- $1,044 high interval (Pro) →
- Mortgage (P&I)
- −$262
- Tax from tax record
- −$90 /mo · $1,083/yr
- Insurance
- −$21
- HOA
- −$0
- Vacancy / Maint / Mgmt
- −$219
- Net cashflow
- $451
Break-even live
UW: 25.0% down · 7.5% · 30yr · 1.5% tax · 5.0% vac · 8.0% maint · 8.0% mgmt
Financing live
Cash to close
- Down payment
- $12,500
- Closing costs
- $1,500
- Reserves months
- —
- Total cash needed
- —
Loan-product check · same deal, 3 products live
Conventional
25% down · 7.5% · 30yr
- Down + closing
- —
- Monthly P&I
- —
- Monthly cashflow
- —
- DSCR
- —
- Eligible?
- —
Personal DTI + credit; lowest rate.
DSCR
20% down · 8.5% · 30yr
- Down + closing
- —
- Monthly P&I
- —
- Monthly cashflow
- —
- DSCR
- —
- Eligible?
- —
No personal income docs; deal must DSCR.
Hard money
10% down · 12.0% · 12mo
- Down + closing
- —
- Monthly P&I
- —
- Monthly cashflow
- —
- DSCR
- —
- Eligible?
- —
Short-term bridge; refi at stabilization.
Rent comps 10 comps
| Address | Beds | Baths | Sqft | Rent | $/sqft | DOM | Units | Dist |
|---|---|---|---|---|---|---|---|---|
| 1311 N Walnut Grove Ave Decatur, IL | 2.0 | 1.0 | 781 | $1,100 | $1.41 | 44d | 1 | 0.33mi |
| 2148 N Graceland Ave Decatur, IL | 2.0 | 1.0 | 864 | $1,195 | $1.38 | 44d | 1 | 0.38mi |
| 1908 N Union St Decatur, IL | 2.0 | 1.0 | 704 | $899 | $1.28 | 44d | 1 | 0.45mi |
| 1245 N Union St Decatur, IL | 3.0 | 2.0 | 1111 | $995 | $0.90 | 44d | 1 | 0.52mi |
| 1045 N Monroe St Decatur, IL | 3.0 | 2.0 | 1094 | $1,000 | $0.91 | 44d | 1 | 0.52mi |
| 1345 N Fairview Ave Decatur, IL | 3.0 | 1.0 | 785 | $985 | $1.25 | 44d | 1 | 0.63mi |
| 853 N College St Decatur, IL | 2.0 | 1.0 | 936 | $925 | $0.99 | 44d | 1 | 0.71mi |
| 510 E Pierson Ave Decatur, IL | 3.0 | 1.0 | 895 | $1,200 | $1.34 | 44d | 1 | 1.01mi |
| 927 E Harrison Ave Decatur, IL | 2.0 | 1.0 | 720 | $675 | $0.94 | 21d | 1 | 1.22mi |
| 1091 N Oakcrest Ave Decatur, IL | 2.0 | 1.0 | 672 | $950 | $1.41 | 44d | 1 | 1.23mi |
Listing history 12 events
-
2025-11-05soldstatus $50,000
-
2025-10-21status Pending
-
2025-09-18price $50,000
-
2025-08-20price $54,000
-
2025-07-10status Active
-
2025-06-25status Pending
-
2025-06-04historical Active Under Contract
-
2025-05-20price $55,000
-
2025-04-21$59,900 Active
-
2007-04-10soldstatus $36,000
-
2007-04-05soldstatus $36,000 183-char remark
Show marketing remark (183 chars)
Very nice bungalow, craftsman style home. Updates includes new furnace & air in '05, carpet & paint. Large back yard could easily be fenced. Nice fireplace for cozy evenings.
-
2006-11-01$38,500 183-char remark
Show marketing remark (183 chars)
Very nice bungalow, craftsman style home. Updates includes new furnace & air in '05, carpet & paint. Large back yard could easily be fenced. Nice fireplace for cozy evenings.
ⓘ Source: listings_history table (triggers on properties + properties_extension) + one-shot
backfill from property_details.listing_events for pre-trigger history.
Tax reassessment forecast IL · Partial reset (capped growth)
- Current annual tax
- $1,083 · $90/mo
- Projected year-2 tax
- $1,109 · $92/mo
- Expected delta
- +$26/yr (+$2/mo · 2.4%)
ⓘ Screening estimate from a state-policy table — verify with the county assessor before closing.
Climate risk First Street
- Flood 1/10 Low FEMA zone X (unshaded) · 0% chance over 30 yrs
- Wildfire 1/10 Low
- Heat 3/10 Moderate 7 d/yr ≥105°F today · 19 d/yr by 30 yrs out
- Wind 2/10 Low 100% chance of damaging wind over 30 yrs
- Air quality 2/10 Low 1 unhealthy d/yr today · 1 by 30 yrs out
Nearby sold comps map
Loading sold comps map…
Walkable amenities ~0.75 mi
Loading nearby amenities…
Taxation est. · year 1
- Rental income
- $12,525
- − Mortgage interest
- −$2,801
- − Property taxes
- −$1,083
- − Insurance
- −$250
- − Repairs & maintenance
- −$1,002
- − Management
- −$1,002
- − Depreciation
- −$1,455
- Taxable income
- $4,933
- Est. tax owed @ 24.0%
- −$1,184
- After-tax cash flow
- $4,232/yr
For passive investors: Depreciation is non-cash, so a rental often shows a tax loss while cash-flowing — sheltering income. Rental losses are passive: they offset passive income freely, and up to $25,000/yr can offset ordinary (W-2) income if you actively participate and your MAGI is under $100k (phasing out to $0 by $150k); unused losses carry forward. On sale, claimed depreciation is recaptured at up to 25%, and gains may owe capital-gains tax (a 1031 exchange can defer both). Figures are a year-1 estimate at your 24.0% rate — not tax advice; consult a CPA.
Schools (NCES district)
- District
- Decatur SD 61
- NCES district ID
- 1711850
- Math proficiency
- 3% ▼ -4.00%
- Reading proficiency
- 6% ▼ -6.00%
- Median HH income
- $38,864
- Composite
- 3.99/100
- National rank
- #10059
- State rank
- #605 of 620 in IL
Livability — Decatur
- Score
- 59/100
- State rank
- #1076
- US rank
- #20533
Category grades
Schools grade is shown separately in the Schools card above.
Census & demographics
- Census place
- Decatur, IL
- County
- Macon County · 78,333 people
- City population
- 78,333
- Metro
- Decatur, IL
- Population (ZIP)
- 30,483
- Household income
- $49,062
- Rent vs Own
- Severe rent burden
- 1041.0
Population outlook (Macon County) Hauer SSP2
- Today (2025)
- 99,568 people
- By 2030
- 94,973 · -4.6%
- By 2040
- 85,250 · -14.4%
- By 2050
- 75,920 · -23.8%
- By 2075
- 55,962 · -43.8%
- By 2100
- 36,468 · -63.4%
Race, ethnicity, and origin ACS 2023
- Neighborhood character
- Predominantly White (68%)
- Race & ethnicity
- White 68% Black 22% Two or more races 6% Hispanic / Latino 3% Asian 2%
- Common ancestry
- Lithuanian 2% Italian 2% Slovak 2%
- Foreign-born
- 4% · Canada
- Languages at home
- 95% English-only · Spanish 2% Other Indo-European 1%
Political lean MEDSL · Macon
- 2024 margin
- R (+18.9) · D 39.8% · R 58.7% · Other 1.4%
- 2008→2024 swing
- -20.0pp toward R · 2008: 1.1pp · 2024: -18.9pp
- All cycles
- 2024: R+18.9 2020: R+17.7 2016: R+18.1 2012: R+5.2 2008: D+1.1
Not yet ingested
- Civics
- —
Market trends
- HPI YoY
- ▼ -2.21%
- Current HPI
- 182.871
- Rent YoY
- —
- Metro
- Decatur, IL
- State GDP YoY
- ▲ 1.59%
- F500 in state
- 60
Industry mix (Fortune 500 HQ in IL)
| Industry | F500 HQs | Revenue |
|---|---|---|
| Insurance | 4 | $201B |
|
||
| Consumer Goods | 4 | $87B |
|
||
| Industrial Machinery | 3 | $64B |
|
||
| Healthcare | 2 | $55B |
|
||
| Retail / Pharmacy | 1 | $148B |
|
||
| Agriculture / Food | 1 | $86B |
|
||
Price history
+29.9% since first listed12 events — show timeline
- 2025-11-05 Sold (Public Records) $50,000 Public Records
- 2025-10-21 Pending — CIBR
- 2025-09-18 Price Changed $50,000 CIBR
- 2025-08-20 Price Changed $54,000 CIBR
- 2025-07-10 Relisted — CIBR
- 2025-06-25 Pending — CIBR
- 2025-06-04 Contingent — CIBR
- 2025-05-20 Price Changed $55,000 CIBR
- 2025-04-21 Listed $59,900 CIBR
- 2007-04-10 Sold (Public Records) $36,000 Public Records
- 2007-04-05 Sold (MLS) $36,000 MRED as Distributed by MLS Grid
- 2006-11-01 Listed $38,500 MRED as Distributed by MLS Grid
Property tax history
+6.9%/yrLatest (2024): $1,083 · +0.8% YoY. Source: county tax records.
Cash-flow waterfall
monthlySold comps — $/sqft
last 12 mo · ≤1 miLoading sold comps…