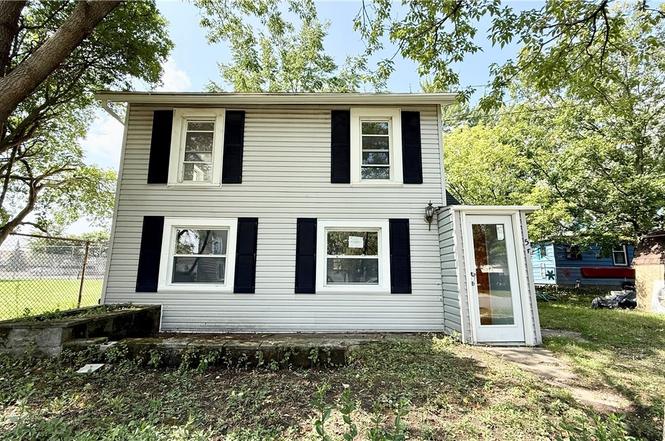
533 Adam St · Tonawanda, NY
Flood risk 1/10 · Minimal
- FEMA flood zone
- X (unshaded)
- Chance of flooding over 30 yrs
- 0.0%
- Est. flood insurance / yr
- $473 – $860
Fire risk 1/10 · Minimal
- Est. fire insurance / yr
- $691 – $1,283
Heat risk 3/10 · Minor
- Hot days now (above 93°F)
- 7 days/yr
- Hot days in 30 yrs
- 15 days/yr
Wind risk 1/10 · Minimal
- Chance of severe wind over 30 yrs
- —
Air-quality risk 3/10 · Minor
- Unhealthy air days now
- 3 days/yr
- Unhealthy air days in 30 yrs
- 4 days/yr
Risk factors via First Street. Map © Google.
Why this score? — see what drove the C+ grade
The composite is a weighted blend of 9 inputs, each scored 0–100. Each bar is that input's sub-score; the figure is the points it added to the 100-point composite (weight × sub-score).
- Cash flow +25.0/30.0
- DSCR +8.2/10.0
- ARV discount +7.5/15.0
- 1% rule +6.4/10.0
- Livability +4.5/5.0
- Rent growth +4.2/5.0
- Schools +3.5/10.0
- Condition / age +2.5/5.0
- Appreciation +0.0/10.0
$139,000
🖨 Deal sheet 📄 Offer letter ✓ Due diligence
Listing remarks
Don’t miss this rare opportunity to own a 2-bedroom, 1-bath home just one block from the Niagara River—a true boater’s delight! Conveniently located near stores, restaurants, and beautiful Niawanda Park, this home offers the perfect blend of lifestyle and convenience. Inside, you’ll find a remodeled kitchen with an eating area, a cozy living space, and a first-floor utility room with laundry hookups. Upstairs features an additional versatile room, ideal for a home office, playroom, or nursery. The double-wide lot provides endless opportunities for expansion and outdoor fun—add a pool, set up horseshoes, or create your dream backyard oasis. With many updates thr
Key facts
- Double-wide lot
- Versatile room
- Remodeled kitchen
Tags
Neighborhood map
What this means for you Summary
Snapshot
- This is a 2-bed/1.0-bath single-family listed at $139k.
Deal economics
- At list price, monthly cash flow is $304 ($4k/yr) — positive.
- The deal already cash-flows at list — no discount required.
- Meets the 1% rule at list price ($2k rent vs $139k).
- Recommended offer: $122k (12.0% below list) — sets the bar for market timing.
Location & tenants
- Location reads 89/100 on livability (#8 in NY, #169 nationally) — a professional / high-income tenant draw. Strengths: amenities A+, commute A+, cost of living A+.
- Tonawanda City School District (suburban): math 39% / reading 43% proficiency, ranked #508 of 590 in NY (top 86%) — families likely to look elsewhere, expect single-tenant / working-renter base with shorter leases.
- Market conditions: Rents rising fast (+6.8%/yr); 191 active listings in the ZIP; 3 comparable units currently listed for rent nearby; rentals leasing fast (median 3d on market — plan ~1-2 weeks tenant-placement turnaround); 1,244 units permitted in Erie County in 2024 (563 in 5+ unit buildings).
Forward outlook
- Local home prices are declining (-3.0%/yr); year-one equity from $961 of loan paydown is wiped out by about $4k of value loss. Plan a longer hold.
- At projected returns (-3.0% appreciation + 6.8% rent growth), your $39k cash investment doubles in ~8 years — after that, you're playing with house money.
Negotiation context
- It's been on market 204 days — a 12% lower offer ($122k) is reasonable based on typical stale-listing flexibility.
- Current owner paid $50k; list at $139k implies a 176% gain — meaningful room to come down on a strong offer.
Risks & watch-outs
- Watch-outs: built in 1920 — expect roof / HVAC / electrical / plumbing capex.
Questions for the listing agent
- It's been on market 204 days. Have you received any prior offers? Is the seller open to a 12% concession, seller financing, or rate buy-down credit?
- Built in 1920 — when were the roof, HVAC, electrical panel, plumbing, and water heater last replaced?
- Why hasn't it sold? Are there any deal-killer items the seller is aware of (foundation, flood, title, zoning, code violations)?
- Is there a deadline driving the sale (1031 exchange, divorce, estate, relocation)? That informs how much negotiation room exists.
- Schools are B-rated — typically a magnet for longer-tenancy family renters. What's the average tenant stay here, and is there a school-zone premium baked into asking?
- What's the average days-on-market for RENTAL listings here right now (not sales)? A rising rental-DOM trend means longer vacancies and softer asking-rent achievability than the comps imply.
- What's the recent tenant-quality profile in this submarket — average credit score on applications, eviction rate, late-payment / NSF rate, and stable-employment percentage? A property-management company in the area should have these aggregated.
- How much new for-sale + rental construction is in the pipeline within 1–3 miles? Heavy new supply typically softens prices + rents 12–24 months out; constrained supply supports both.
Investment metrics
- 1% rule
- 1.14% ✓
- Cap rate
- 8.92%
- Cash-on-cash
- 9.37%
- DSCR
- 1.42
- GRM
- 7.3
CMA / ARV
No comps found within radius.
Projected returns pro-forma
-3.0% appreciation · 6.75% rent growth · sell at horizon
- IRR
- 2.0%
- Equity multiple
- 1.08×
- Total profit
- $3,053
- Equity at exit
- $20,725
- IRR
- 14.9%
- Equity multiple
- 2.42×
- Total profit
- $55,166
- Equity at exit
- $12,018
Cash invested: $38,920 (down + closing). Projections, not guarantees.
Landlord ↔ Tenant lean methodology
- Overall (STATE)
- 15 Strongly Tenant-Friendly
- State New York
- 15 Strongly Tenant-Friendly · D+10
- County
- — inherits STATE
- City
- — inherits STATE
ZIP-level market 14150
- Rents YoY
- 6.8%
- Active inventory
- 191
- Price-to-rent
- 7.3×
Monthly cashflow live
- Estimated rent
- $1,586 medium interval (Pro) →
- Mortgage (P&I)
- −$729
- Tax from tax record
- −$162 /mo · $1,942/yr
- Insurance
- −$58
- HOA
- −$0
- Vacancy / Maint / Mgmt
- −$333
- Net cashflow
- $304
Break-even live
UW: 25.0% down · 7.5% · 30yr · 1.5% tax · 5.0% vac · 8.0% maint · 8.0% mgmt
Financing live
Cash to close
- Down payment
- $34,750
- Closing costs
- $4,170
- Reserves months
- —
- Total cash needed
- —
Loan-product check · same deal, 3 products live
Conventional
25% down · 7.5% · 30yr
- Down + closing
- —
- Monthly P&I
- —
- Monthly cashflow
- —
- DSCR
- —
- Eligible?
- —
Personal DTI + credit; lowest rate.
DSCR
20% down · 8.5% · 30yr
- Down + closing
- —
- Monthly P&I
- —
- Monthly cashflow
- —
- DSCR
- —
- Eligible?
- —
No personal income docs; deal must DSCR.
Hard money
10% down · 12.0% · 12mo
- Down + closing
- —
- Monthly P&I
- —
- Monthly cashflow
- —
- DSCR
- —
- Eligible?
- —
Short-term bridge; refi at stabilization.
Rent comps 3 comps
| Address | Beds | Baths | Sqft | Rent | $/sqft | DOM | Units | Dist |
|---|---|---|---|---|---|---|---|---|
| 115 Klinger Ave Tonawanda, NY | 3.0 | 1.0 | 1200 | $1,450 | $1.21 | 3d | 1 | 0.49mi |
| 53 Winkler Dr Tonawanda, NY | 3.0 | 1.0 | 1060 | $2,100 | $1.98 | 11d | 1 | 1.33mi |
| 184 Sweeney St North Tonawanda, NY | 2.0 | 2.0 | 1155 | $2,000 | $1.73 | 1d | 1 | 1.40mi |
Listing history 4 events
-
2026-03-28status Pending
-
2025-09-19price $139,000
-
2025-09-05$149,000 Active
-
2005-11-14soldstatus $50,450
ⓘ Source: listings_history table (triggers on properties + properties_extension) + one-shot
backfill from property_details.listing_events for pre-trigger history.
Tax reassessment forecast NY · Partial reset (capped growth)
- Current annual tax
- $1,942 · $162/mo
- Projected year-2 tax
- $2,146 · $179/mo
- Expected delta
- +$203/yr (+$17/mo · 10.5%)
ⓘ Screening estimate from a state-policy table — verify with the county assessor before closing.
Climate risk First Street
- Flood 1/10 Low FEMA zone X (unshaded) · 0% chance over 30 yrs
- Wildfire 1/10 Low
- Heat 3/10 Moderate 7 d/yr ≥93°F today · 15 d/yr by 30 yrs out
- Wind 1/10 Low
- Air quality 3/10 Moderate 3 unhealthy d/yr today · 4 by 30 yrs out
Nearby sold comps map
Loading sold comps map…
Walkable amenities ~0.75 mi
Loading nearby amenities…
Taxation est. · year 1
- Rental income
- $19,026
- − Mortgage interest
- −$7,786
- − Property taxes
- −$1,942
- − Insurance
- −$695
- − Repairs & maintenance
- −$1,522
- − Management
- −$1,522
- − Depreciation
- −$4,044
- Taxable income
- $1,515
- Est. tax owed @ 24.0%
- −$364
- After-tax cash flow
- $3,283/yr
For passive investors: Depreciation is non-cash, so a rental often shows a tax loss while cash-flowing — sheltering income. Rental losses are passive: they offset passive income freely, and up to $25,000/yr can offset ordinary (W-2) income if you actively participate and your MAGI is under $100k (phasing out to $0 by $150k); unused losses carry forward. On sale, claimed depreciation is recaptured at up to 25%, and gains may owe capital-gains tax (a 1031 exchange can defer both). Figures are a year-1 estimate at your 24.0% rate — not tax advice; consult a CPA.
Schools (NCES district)
- District
- Tonawanda City School District
- NCES district ID
- 3628740
- Math proficiency
- 39% ▼ -19.00%
- Reading proficiency
- 43% ▼ -7.00%
- Median HH income
- $47,061
- Composite
- 35.03/100
- National rank
- #5041
- State rank
- #508 of 590 in NY
Livability — Tonawanda
- Score
- 89/100
- State rank
- #8
- US rank
- #169
Category grades
Schools grade is shown separately in the Schools card above.
Census & demographics
- Census place
- Tonawanda, NY
- County
- Erie County · 714,559 people
- City population
- 41,260
- Metro
- Buffalo-Cheektowaga, NY
- Population (ZIP)
- 41,260
- Household income
- $71,406
- Rent vs Own
- Severe rent burden
- 1427.0
Population outlook (Erie County) Hauer SSP2
- Today (2025)
- 933,037 people
- By 2030
- 935,181 · +0.2%
- By 2040
- 928,531 · -0.5%
- By 2050
- 905,725 · -2.9%
- By 2075
- 834,037 · -10.6%
- By 2100
- 708,033 · -24.1%
Race, ethnicity, and origin ACS 2023
- Neighborhood character
- Predominantly White (87%)
- Race & ethnicity
- White 87% Two or more races 5% Hispanic / Latino 5% Black 4% Asian 2%
- Common ancestry
- Romanian 13% Lithuanian 3% Slovak 2%
- Foreign-born
- 6% · Canada, Philippines, Vietnam
- Languages at home
- 94% English-only · Other Indo-European 2% Spanish 1% Russian/Polish/Slavic 1%
Political lean MEDSL · Erie
- 2024 margin
- Lean D (+9.7) · D 54.8% · R 45.2%
- 2008→2024 swing
- -7.9pp toward R · 2008: 17.5pp · 2024: 9.7pp
- All cycles
- 2024: D+9.7 2020: D+14.7 2016: D+4.8 2012: D+15.6 2008: D+17.5
Not yet ingested
- Civics
- —
Market trends
- HPI YoY
- ▼ -260.43%
- Current HPI
- 334.5893
- Rent YoY
- ▲ 6.75%
- Metro
- Buffalo-Cheektowaga, NY
- State GDP YoY
- ▲ 2.60%
- F500 in state
- 92
Industry mix (Fortune 500 HQ in NY)
| Industry | F500 HQs | Revenue |
|---|---|---|
| Financial Services | 10 | $950B |
|
||
| Consumer Goods | 9 | $162B |
|
||
| Insurance | 4 | $225B |
|
||
| Telecommunications | 2 | $144B |
|
||
| Pharmaceuticals | 2 | $112B |
|
||
| Media / Entertainment | 2 | $69B |
|
||
Price history
+175.5% since first listed4 events — show timeline
- 2026-03-28 Pending — WNYREIS
- 2025-09-19 Price Changed $139,000 WNYREIS
- 2025-09-05 Listed $149,000 WNYREIS
- 2005-11-14 Sold (Public Records) $50,450 Public Records
Property tax history
+6.6%/yrLatest (2025): $1,942 · +2.8% YoY. Source: county tax records.
Cash-flow waterfall
monthlySold comps — $/sqft
last 12 mo · ≤1 miLoading sold comps…