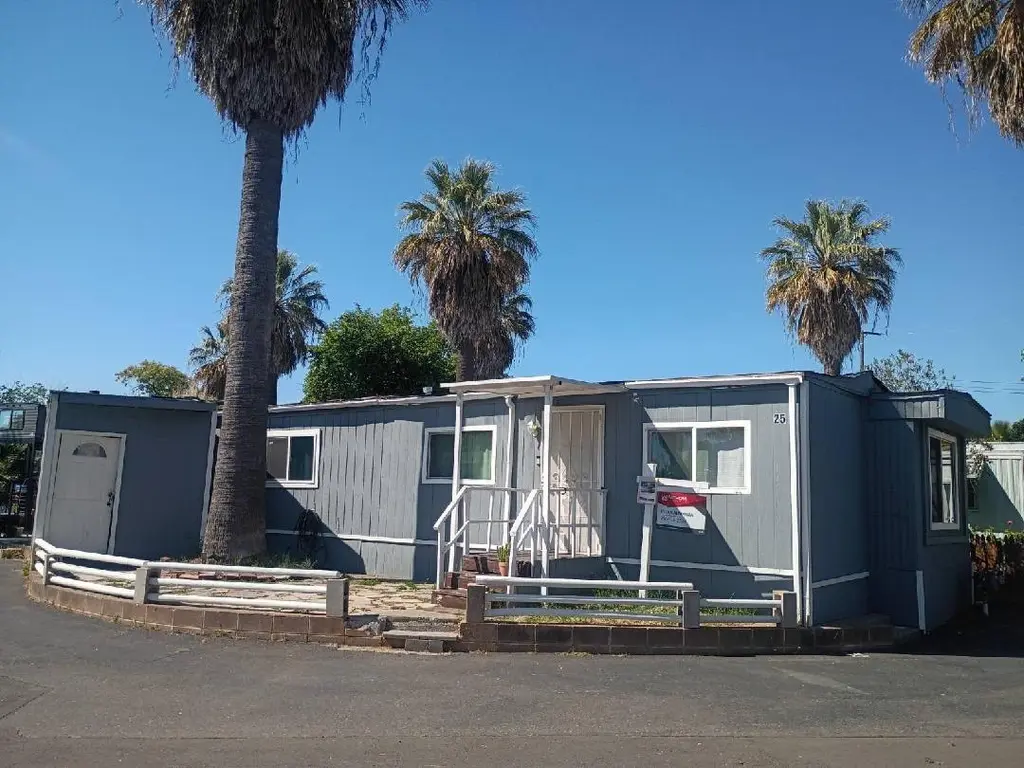
3440 Fulton Ave #25 · Arden-Arcade, CA
Flood risk 1/10 · Minimal
- FEMA flood zone
- X (unshaded)
- Chance of flooding over 30 yrs
- 0.0%
- Est. flood insurance / yr
- $507 – $1,088
Fire risk 1/10 · Minimal
- Est. fire insurance / yr
- $659 – $1,223
Heat risk 7/10 · Major
- Hot days now (above 102°F)
- 7 days/yr
- Hot days in 30 yrs
- 15 days/yr
Wind risk 1/10 · Minimal
- Chance of severe wind over 30 yrs
- —
Air-quality risk 10/10 · Severe
- Unhealthy air days now
- 33 days/yr
- Unhealthy air days in 30 yrs
- 38 days/yr
Risk factors via First Street. Map © Google.
Why this score? — see what drove the B- grade
The composite is a weighted blend of 9 inputs, each scored 0–100. Each bar is that input's sub-score; the figure is the points it added to the 100-point composite (weight × sub-score).
- Cash flow +30.0/30.0
- 1% rule +10.0/10.0
- DSCR +10.0/10.0
- ARV discount +4.6/15.0
- Schools +4.4/10.0
- Livability +2.5/5.0
- Condition / age +2.5/5.0
- Rent growth +2.4/5.0
- Appreciation +0.0/10.0
$50,000
🖨 Deal sheet 📄 Offer letter ✓ Due diligence
Listing remarks
Move in Ready! Great price! Double Wide, newer windows, painted exterior and interior, kitchen cabinets bright white, gas stove, ALL AGES Park! 2 parking spaces, refrigerator, washer and dryer included! Swimming pool available. Nice clean park! Dogs/cats allowed!
Key facts
- Washer and dryer
- Parking spaces
- Swimming pool
Tags
Neighborhood map
What this means for you Summary
Snapshot
- This is a 2-bed/1.0-bath manufactured listed at $50k.
Deal economics
- At list price, monthly cash flow is $820 ($10k/yr) — positive.
- The deal already cash-flows at list — no discount required.
- Meets the 1% rule at list price ($1k rent vs $50k).
- Recommended offer: $47k (6.0% below list) — sets the bar for market timing.
- Cap rate 26.0% vs local median 2.3% in Arden-Arcade — top-decile yield for the area; either an underpriced asset or a hidden risk that comps aren't pricing in. Stress-test before assuming the spread holds.
Location & tenants
- Location reads: area grade B — affects rentability + tenant quality, not the cash-flow math above.
- San Juan Unified (suburban): math 40% / reading 62% proficiency, ranked #138 of 517 in CA (top 27%) — acceptable for families but not a draw, mixed tenant base, ~2y average lease.
- Market conditions: Rents soft (-0.5%/yr); 94 active listings in the ZIP; 40 comparable units currently listed for rent nearby; rentals at typical pace (median 20d on market — plan ~3-4 weeks tenant-placement turnaround); 6,825 units permitted in Sacramento County in 2024 (1,752 in 5+ unit buildings).
Forward outlook
- Local home prices are declining (-3.0%/yr); year-one equity from $346 of loan paydown is wiped out by about $2k of value loss. Plan a longer hold.
- Sacramento County population projected at +17% by 2050 — long-run rental-demand tailwind backs the buy-and-hold thesis.
- At projected returns (-3.0% appreciation + 0.0% rent growth), your $14k cash investment doubles in ~2 years — after that, you're playing with house money.
Negotiation context
- It's been on market 84 days — a 6% lower offer ($47k) is reasonable based on typical stale-listing flexibility.
Risks & watch-outs
- Climate carrying-cost: extreme-heat days projected 7→15/yr by 2055 (HVAC capex compounding) — expect insurance premiums to compound above CPI over the hold.
Questions for the listing agent
- It's been on market 84 days. Have you received any prior offers? Is the seller open to a 6% concession, seller financing, or rate buy-down credit?
- Built in 1978 — when were the roof, HVAC, electrical panel, plumbing, and water heater last replaced?
- Why hasn't it sold? Are there any deal-killer items the seller is aware of (foundation, flood, title, zoning, code violations)?
- Is there a deadline driving the sale (1031 exchange, divorce, estate, relocation)? That informs how much negotiation room exists.
- What's the average days-on-market for RENTAL listings here right now (not sales)? A rising rental-DOM trend means longer vacancies and softer asking-rent achievability than the comps imply.
- What's the recent tenant-quality profile in this submarket — average credit score on applications, eviction rate, late-payment / NSF rate, and stable-employment percentage? A property-management company in the area should have these aggregated.
- How much new for-sale + rental construction is in the pipeline within 1–3 miles? Heavy new supply typically softens prices + rents 12–24 months out; constrained supply supports both.
Investment metrics
- 1% rule
- 2.83% ✓
- Cap rate
- 25.98%
- Cash-on-cash
- 70.29%
- DSCR
- 4.13
- GRM
- 2.9
CMA / ARV
- ARV (median comp)
- $47,000
- List price
- $50,000
- Delta
- 6.38%
- Verdict
- FAIR
- Comps
- 2 within 1.0 mi
Projected returns pro-forma
-3.0% appreciation · 0.0% rent growth · sell at horizon
- IRR
- 66.5%
- Equity multiple
- 3.86×
- Total profit
- $39,971
- Equity at exit
- $7,455
- IRR
- 69.9%
- Equity multiple
- 7.14×
- Total profit
- $85,987
- Equity at exit
- $4,323
Cash invested: $14,000 (down + closing). Projections, not guarantees.
Landlord ↔ Tenant lean methodology
- Overall (STATE)
- 18 Strongly Tenant-Friendly
- State California
- 18 Strongly Tenant-Friendly · D+13
- County
- — inherits STATE
- City
- — inherits STATE
ZIP-level market 95821
- Rents YoY
- -0.5%
- Active inventory
- 94
- Price-to-rent
- 2.9×
Monthly cashflow live
- Estimated rent
- $1,417 high interval (Pro) →
- Mortgage (P&I)
- −$262
- Tax from tax record
- −$16 /mo · $196/yr
- Insurance
- −$21
- HOA
- −$0
- Vacancy / Maint / Mgmt
- −$298
- Net cashflow
- $820
Break-even live
UW: 25.0% down · 7.5% · 30yr · 1.5% tax · 5.0% vac · 8.0% maint · 8.0% mgmt
Financing live
Cash to close
- Down payment
- $12,500
- Closing costs
- $1,500
- Reserves months
- —
- Total cash needed
- —
Loan-product check · same deal, 3 products live
Conventional
25% down · 7.5% · 30yr
- Down + closing
- —
- Monthly P&I
- —
- Monthly cashflow
- —
- DSCR
- —
- Eligible?
- —
Personal DTI + credit; lowest rate.
DSCR
20% down · 8.5% · 30yr
- Down + closing
- —
- Monthly P&I
- —
- Monthly cashflow
- —
- DSCR
- —
- Eligible?
- —
No personal income docs; deal must DSCR.
Hard money
10% down · 12.0% · 12mo
- Down + closing
- —
- Monthly P&I
- —
- Monthly cashflow
- —
- DSCR
- —
- Eligible?
- —
Short-term bridge; refi at stabilization.
Rent comps 40 comps
| Address | Beds | Baths | Sqft | Rent | $/sqft | DOM | Units | Dist |
|---|---|---|---|---|---|---|---|---|
| 2929 Edison Ave Sacramento, CA | 1.0 | 1.0 | 660 | $1,435 | $2.17 | 43d | 1 | 0.22mi |
| 2647 Pope Ave Sacramento, CA | 1.0 | 1.0 | 550 | $1,895 | $3.45 | 23d | 1 | 0.25mi |
| 2511 Edison Ave Unit 2511-26 D Sacramento, CA | 1.0 | 1.0 | 535 | $1,300 | $2.43 | 20d | 1 | 0.27mi |
| 2511 Edison Ave Unit 2511-52 D Sacramento, CA | 1.0 | 1.0 | 525 | $1,300 | $2.48 | 23d | 1 | 0.27mi |
| 2512 Edison Ave Sacramento, CA | 1.0–2.0 | 1.0 | 685 | $1,495 | $2.18 | 4d | 5 | 0.33mi |
| 2501 Edison Ave Unit 2501-34 Sacramento, CA | 1.0 | 1.0 | 525 | $1,300 | $2.48 | 23d | 1 | 0.33mi |
| 2400 Edison Ave Unit 3250 Sacramento, CA | 1.0 | 1.0 | 523 | $1,295 | $2.48 | 16d | 1 | 0.46mi |
| 2400 Edison Ave Sacramento, CA | 1.0 | 1.0 | 523 | $1,195 | $2.28 | 43d | 1 | 0.46mi |
| 3142 Edison Ave Unit 14 Sacramento, CA | 1.0 | 1.0 | 650 | $1,275 | $1.96 | 23d | 1 | 0.49mi |
| 2340 Edison Ave Sacramento, CA | 1.0 | 1.0 | 623 | $1,300 | $2.09 | 23d | 1 | 0.55mi |
| 2315 Edison Ave #3 Sacramento, CA | 1.0 | 1.0 | 600 | $1,225 | $2.04 | 3d | 1 | 0.66mi |
| 2909 Marconi Ave Sacramento, CA | 1.0 | 1.0 | 550 | $1,275 | $2.32 | 21d | 1 | 0.69mi |
| 2318 Church Ave Unit 8 Sacramento, CA | 2.0 | 1.0 | 725 | $1,150 | $1.59 | 14d | 1 | 0.73mi |
| 2904 Marconi Ave Unit 2900-12 Sacramento, CA | 1.0 | 1.0 | 550 | $1,095 | $1.99 | 43d | 1 | 0.86mi |
| 2904 Marconi Ave Unit 2904-10 Sacramento, CA | 2.0 | 1.0 | 675 | $1,345 | $1.99 | 20d | 1 | 0.86mi |
| 2904 Marconi Ave Unit 2900-17 Sacramento, CA | 1.0 | 1.0 | 550 | $1,045 | $1.90 | 23d | 1 | 0.86mi |
| 2904 Marconi Ave Unit 2900-10 Sacramento, CA | 1.0 | 1.0 | 550 | $1,045 | $1.90 | 14d | 1 | 0.86mi |
| 3101 Truax Ct Sacramento, CA | 1.0–2.0 | 1.0 | 667 | $1,495 | $2.24 | 7d | 4 | 0.88mi |
| 2228 Edison Ave Sacramento, CA | 1.0–2.0 | 1.0–2.0 | 706 | $1,914 | $2.71 | 1d | 6 | 0.90mi |
| 3525 Whitney Ave Sacramento, CA | 1.0 | 1.0 | 640 | $1,200 | $1.88 | 4d | 1 | 0.92mi |
| 3536 Watt Ave Sacramento, CA | 1.0–2.0 | 1.0 | 730 | $1,525 | $2.09 | 2d | 6 | 0.94mi |
| 3120 Howe Ave Sacramento, CA | 1.0 | 1.0 | 725 | $1,350 | $1.86 | 23d | 1 | 0.96mi |
| 2121 Edison Ave Sacramento, CA | 1.0 | 1.0 | 580 | $1,300 | $2.24 | 43d | 1 | 1.03mi |
| 2633 Fulton Ave Sacramento, CA | 1.0 | 1.0 | 652 | $1,447 | $2.22 | 43d | 1 | 1.04mi |
| 3821 Annadale Ln Sacramento, CA | 1.0 | 1.0 | 660 | $1,330 | $2.02 | 21d | 1 | 1.08mi |
| 3831 Annadale Ln Sacramento, CA | 1.0–2.0 | 1.0 | 786 | $1,700 | $2.16 | 3d | 4 | 1.09mi |
| 3636 Edison Ave Sacramento, CA | 2.0 | 1.0 | 607 | $1,710 | $2.81 | 2d | 9 | 1.10mi |
| 2932 Watt Ave Unit E-22 Sacramento, CA | 1.0 | 1.0 | 575 | $1,195 | $2.08 | 21d | 1 | 1.11mi |
| 2932 Watt Ave Sacramento, CA | 1.0 | 1.0 | 575 | $1,095 | $1.90 | 16d | 1 | 1.11mi |
| 2740 Elvyra Way Sacramento, CA | 1.0 | 1.0 | 625 | $1,350 | $2.16 | 4d | 1 | 1.12mi |
| 2930 Watt Ave Sacramento, CA | 1.0 | 1.0 | 500 | $1,200 | $2.40 | 14d | 2 | 1.13mi |
| 3544 Auburn Blvd Sacramento, CA | 1.0–2.0 | 1.0 | 750 | $1,495 | $1.99 | 19d | 1 | 1.15mi |
| 3859 Annadale Ln Sacramento, CA | 1.0 | 1.0 | 600 | $1,200 | $2.00 | 43d | 1 | 1.20mi |
| 3535 Marconi Ave Sacramento, CA | 1.0–2.0 | 1.0–2.0 | 940 | $1,895 | $2.01 | 43d | 1 | 1.20mi |
| 2850 Darwin St Sacramento, CA | 1.0 | 1.0 | 530 | $1,300 | $2.45 | 7d | 4 | 1.24mi |
| 2823 El Camino Ave Sacramento, CA | 1.0–2.0 | 1.0 | 773 | $1,595 | $2.06 | 4d | 4 | 1.24mi |
| 2125 North Ave Sacramento, CA | 1.0 | 1.0 | 650 | $1,095 | $1.68 | 7d | 1 | 1.24mi |
| 2125 North Ave Sacramento, CA | 1.0 | 1.0 | 650 | $1,150 | $1.77 | 20d | 1 | 1.24mi |
| 3100 Jersey Way Unit 18 Sacramento, CA | 1.0 | 1.0 | 600 | $1,245 | $2.08 | 23d | 1 | 1.28mi |
| 3100 Jersey Way Unit 8 Sacramento, CA | 1.0 | 1.0 | 600 | $1,245 | $2.08 | 14d | 1 | 1.28mi |
Tax reassessment forecast CA · Resets to sale price
- Current annual tax
- $196 · $16/mo
- Projected year-2 tax
- $380 · $32/mo
- Expected delta
- +$184/yr (+$15/mo · 94.1%)
ⓘ Screening estimate from a state-policy table — verify with the county assessor before closing.
Climate risk First Street
- Flood 1/10 Low FEMA zone X (unshaded) · 0% chance over 30 yrs
- Wildfire 1/10 Low
- Heat 7/10 Severe 7 d/yr ≥102°F today · 15 d/yr by 30 yrs out
- Wind 1/10 Low
- Air quality 10/10 Extreme 33 unhealthy d/yr today · 38 by 30 yrs out
Nearby sold comps map
Loading sold comps map…
Walkable amenities ~0.75 mi
Loading nearby amenities…
Taxation est. · year 1
- Rental income
- $17,004
- − Mortgage interest
- −$2,801
- − Property taxes
- −$196
- − Insurance
- −$250
- − Repairs & maintenance
- −$1,360
- − Management
- −$1,360
- − Depreciation
- −$1,455
- Taxable income
- $9,583
- Est. tax owed @ 24.0%
- −$2,300
- After-tax cash flow
- $7,541/yr
For passive investors: Depreciation is non-cash, so a rental often shows a tax loss while cash-flowing — sheltering income. Rental losses are passive: they offset passive income freely, and up to $25,000/yr can offset ordinary (W-2) income if you actively participate and your MAGI is under $100k (phasing out to $0 by $150k); unused losses carry forward. On sale, claimed depreciation is recaptured at up to 25%, and gains may owe capital-gains tax (a 1031 exchange can defer both). Figures are a year-1 estimate at your 24.0% rate — not tax advice; consult a CPA.
Schools (NCES district)
- District
- San Juan Unified
- NCES district ID
- 0634620
- Math proficiency
- 40% ▲ 3.00%
- Reading proficiency
- 62% ▲ 16.00%
- Median HH income
- $55,655
- Composite
- 44.07/100
- National rank
- #2878
- State rank
- #138 of 517 in CA
Livability — Arden-Arcade
No livability data for this city. (Only ~50 U.S. cities are tracked.)
Census & demographics
- Census place
- Arden-Arcade, CA
- County
- Sacramento County · 1,539,646 people
- City population
- 100,586
- Metro
- Sacramento-Roseville-Folsom, CA
- Population (ZIP)
- 38,064
- Household income
- $64,963
- Rent vs Own
- Severe rent burden
- 2609.0
Population outlook (Sacramento County) Hauer SSP2
- Today (2025)
- 1,660,763 people
- By 2030
- 1,732,990 · +4.3%
- By 2040
- 1,855,755 · +11.7%
- By 2050
- 1,941,335 · +16.9%
- By 2075
- 2,046,162 · +23.2%
- By 2100
- 1,961,444 · +18.1%
Race, ethnicity, and origin ACS 2023
- Neighborhood character
- Diverse neighborhood (Simpson 0.68)
- Race & ethnicity
- White 50% Hispanic / Latino 20% Asian 13% Two or more races 12% Black 8%
- Hispanic origin (detail)
- Mexican 14%
- Common ancestry
- Lithuanian 3% Slovak 3% Scotch-Irish 2%
- Foreign-born
- 23% · Canada, China
- Languages at home
- 70% English-only · Spanish 10% Other Indo-European 9% Russian/Polish/Slavic 5%
Political lean MEDSL · Sacramento
- 2024 margin
- D (+19.7) · D 58.1% · R 38.4% · Other 3.5%
- 2008→2024 swing
- +0.7pp no change · 2008: 19.0pp · 2024: 19.7pp
- All cycles
- 2024: D+19.7 2020: D+25.3 2016: D+23.7 2012: D+16.3 2008: D+19.0
Not yet ingested
- Civics
- —
Market trends
- HPI YoY
- ▼ -485.09%
- Current HPI
- 306.3799
- Rent YoY
- ▼ -0.49%
- Metro
- Sacramento-Roseville-Folsom, CA
- State GDP YoY
- ▲ 3.21%
- F500 in state
- 116
Industry mix (Fortune 500 HQ in CA)
| Industry | F500 HQs | Revenue |
|---|---|---|
| Technology | 27 | $1,492B |
|
||
| Financial Services | 3 | $174B |
|
||
| Retail | 3 | $44B |
|
||
| Insurance | 3 | $26B |
|
||
| Media / Entertainment | 2 | $115B |
|
||
| Pharmaceuticals / Biotech | 2 | $62B |
|
||
Property tax history
+14.0%/yrLatest (2025): $196 · -2.2% YoY. Source: county tax records.
Cash-flow waterfall
monthlySold comps — $/sqft
last 12 mo · ≤1 miLoading sold comps…