6 Normandy A · Delray Beach, FL
Flood risk 1/10 · Minimal
- FEMA flood zone
- X (unshaded)
- Chance of flooding over 30 yrs
- 0.0%
- Est. flood insurance / yr
- $507 – $1,088
Fire risk 1/10 · Minimal
- Est. fire insurance / yr
- $947 – $1,759
Heat risk 9/10 · Severe
- Hot days now (above 107°F)
- 6 days/yr
- Hot days in 30 yrs
- 22 days/yr
Wind risk 10/10 · Severe
- Chance of severe wind over 30 yrs
- 99.0%
Air-quality risk 3/10 · Minor
- Unhealthy air days now
- 2 days/yr
- Unhealthy air days in 30 yrs
- 3 days/yr
Risk factors via First Street. Map © Google.
Why this score? — see what drove the D- grade
The composite is a weighted blend of 9 inputs, each scored 0–100. Each bar is that input's sub-score; the figure is the points it added to the 100-point composite (weight × sub-score).
- 1% rule +8.1/10.0
- Cash flow +7.8/30.0
- ARV discount +7.5/15.0
- Schools +4.3/10.0
- Livability +3.9/5.0
- Rent growth +3.6/5.0
- Condition / age +2.5/5.0
- DSCR +1.9/10.0
- Appreciation +0.0/10.0
$149,999
🖨 Deal sheet 📄 Offer letter ✓ Due diligence
Listing remarks
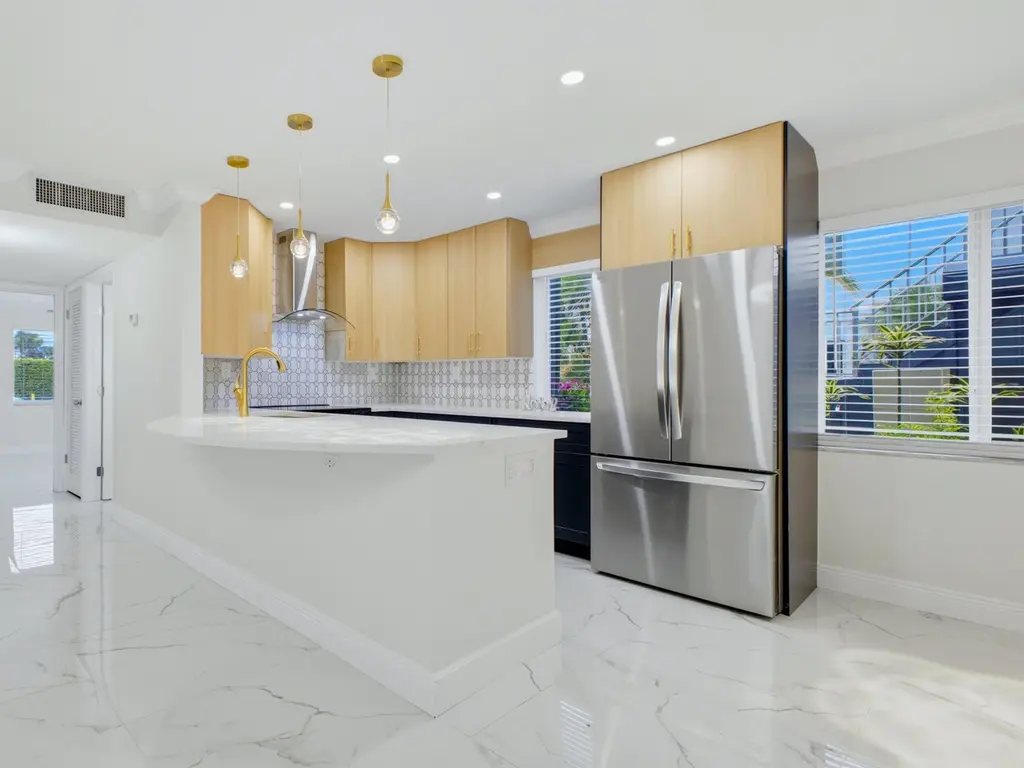
MILLION DOLLAR RENOVATION. THIS UNIT IS BY FAR THE NICEST RENOVATION I HAVE EVER SEEN IN KINGS POINT. TRULY TURN KEY. FEATURING IMPACT WINDOWS, HARD WOOD 2 TONE CABINETS AND BEAUTIFUL QUARTZ COUNTER TOPS. LARGE FORMAT PORCELAIN TILE. NO EXPENCE HAS BEEN SPARED. HIGH END APPLIANCES AND FINISHES. ONCE YOU SEE THIS UNIT, YOU WILL WANT IT. JUST INSTALLED BRAND NEW AIR CONDITIONAR
Key facts
- High end appliances
- Hard wood cabinets
- Quartz counter tops
Tags
Property features AI
Finance
- Other: Senior community
- Financial info: Not a land lease; Pets not allowed; Community has 7,200 units
- HOA & community: Community association (monthly fee); Association amenities include clubhouse, fitness center, golf course, indoor pool, heated pool, pool, spa/hot tub, tennis courts, bocce ball, community room, courtesy bus, internet included, maintained community, security, recreation facilities, parking; Association fee includes cable TV, insurance, internet, grounds maintenance, pest control, security, sewer, trash, common areas, golf, reserve funds, roof repairs, and recreation facility
Exterior
- Parking: 8 total parking spaces; Asphalt parking surface; 1 open parking space
- Security: Security gate; Smoke detector(s)
- Utilities: Public water; Public sewer; 100 Amp electric service; Cable connected; Electricity connected; Sewer connected; Underground utilities; Water connected
- Home design: Condominium; One level; Updated / remodeled; Faces east
- Construction: Built with CBS construction; Flat roof; Slab foundation; 907 sq ft living area
- Exterior features: Waterfront (no specific waterfront features listed); Private maintained road; Asphalt road surface
Interior
- Kitchen: Electric range; Dishwasher (ENERGY STAR qualified); Refrigerator (ENERGY STAR qualified); Garbage disposal; Electric water heater
- Bedrooms: 2 bedrooms on the main level
- Flooring: Tile
- Bathrooms: 2 full bathrooms (main level)
- Heating & cooling: Central heating; Central air conditioning; Ceiling fans; Electric cooling
- Interior features: Kitchen island; ENERGY STAR qualified windows; Storm windows; Smoke detector(s)
- Laundry & utility: Laundry closet
Neighborhood map
What this means for you Summary
Snapshot
- This is a 2-bed/2.0-bath condo listed at $150k.
Deal economics
- At list price, monthly cash flow is $-164 ($-2k/yr) — negative.
- To cash-flow at today's rent, offer at most $121k (19.3% below list).
- Meets the 1% rule at list price ($2k rent vs $150k).
- Recommended offer: $121k (19.3% below list) — sets the bar for cash-flow.
Location & tenants
- Location reads 77/100 on livability (#202 in FL, #3,160 nationally) — a middle-class / working-renter tenant base. Strengths: housing A+, health & safety A+, commute A-; Watch: cost of living C-, crime D-, amenities F.
- Palm Beach (suburban): math 46% / reading 53% proficiency, ranked #34 of 73 in FL (top 47%) — families likely to look elsewhere, expect single-tenant / working-renter base with shorter leases.
- Zoned schools: Orchard View Elementary School (math 48% / reading 47%, grade D, #1,182 of 2,144 statewide, top 55%, 596 students, 76% FRL); Spanish River Community High School (math 64% / reading 74%, grade B, #63 of 667 statewide, top 10%, 2,578 students, 25% FRL) — zoned schools at 50% FRL track the district average.
- Market conditions: Rents rising fast (+4.3%/yr); 546 active listings in the ZIP; 40 comparable units currently listed for rent nearby; rentals at typical pace (median 24d on market — plan ~3-4 weeks tenant-placement turnaround); 3,974 units permitted in Palm Beach County in 2024 (1,012 in 5+ unit buildings).
- This rent runs 38% of the median local income ($62k/yr) — at the standard rent-burdened threshold; future hikes will face affordability resistance.
Forward outlook
- Local home prices are declining (-3.0%/yr); year-one equity from $1k of loan paydown is wiped out by about $4k of value loss. Plan a longer hold.
- Palm Beach County population projected at +30% by 2050 — long-run rental-demand tailwind backs the buy-and-hold thesis.
Negotiation context
- It's been on market 62 days — a 6% lower offer ($141k) is reasonable based on typical stale-listing flexibility.
- Current owner paid $46k; list at $150k implies a 226% gain — meaningful room to come down on a strong offer.
Risks & watch-outs
- Watch-outs: HOA is 37% of rent.
- Climate carrying-cost: severe wind risk, 99% chance of damaging wind over 30y; extreme-heat days projected 6→22/yr by 2055 (HVAC capex compounding) — expect insurance premiums to compound above CPI over the hold.
Questions for the listing agent
- What do current leases actually rent for vs. the listed asking? Can we see a recent rent roll and the last 12 months of T-12 income?
- It's been on market 62 days. Have you received any prior offers? Is the seller open to a 19% concession, seller financing, or rate buy-down credit?
- Built in 1978 — when were the roof, HVAC, electrical panel, plumbing, and water heater last replaced?
- What does the HOA fee cover, when was the last increase, and are there any pending special assessments or reserve-fund shortfalls?
- Any open or pending special assessments — roof, HVAC, plumbing, elevator, façade? What's the per-unit balance and payoff schedule, and is the seller paying it off at close or rolling it to the buyer?
- Why hasn't it sold? Are there any deal-killer items the seller is aware of (foundation, flood, title, zoning, code violations)?
- Is there a deadline driving the sale (1031 exchange, divorce, estate, relocation)? That informs how much negotiation room exists.
- Schools are B-rated — typically a magnet for longer-tenancy family renters. What's the average tenant stay here, and is there a school-zone premium baked into asking?
- Crime grade is D in this area — have there been break-ins, vandalism, or insurance claims at this property in the last 3 years? What carrier currently insures it and at what premium?
- The area grade is low — what's the realistic commute time and amenity access for the typical tenant pool here? Any planned neighborhood developments (good or bad) we should know about?
- What's the average days-on-market for RENTAL listings here right now (not sales)? A rising rental-DOM trend means longer vacancies and softer asking-rent achievability than the comps imply.
- What's the recent tenant-quality profile in this submarket — average credit score on applications, eviction rate, late-payment / NSF rate, and stable-employment percentage? A property-management company in the area should have these aggregated.
- How much new apartment / multifamily construction is in the pipeline within 1–3 miles? Heavy new supply (>2% of stock underway) typically softens rents 12–24 months out; light construction supports rent growth.
Investment metrics
- 1% rule
- 1.31% ✓
- Cap rate
- 4.98%
- Cash-on-cash
- -4.69%
- DSCR
- 0.79
- GRM
- 6.4
CMA / ARV
No comps found within radius.
Projected returns pro-forma
-3.0% appreciation · 4.28% rent growth · sell at horizon
- IRR
- -21.4%
- Equity multiple
- 0.24×
- Total profit
- $-31,742
- Equity at exit
- $22,365
- IRR
- -10.0%
- Equity multiple
- 0.32×
- Total profit
- $-28,474
- Equity at exit
- $12,969
Cash invested: $42,000 (down + closing). Projections, not guarantees.
Landlord ↔ Tenant lean methodology
- Overall (STATE)
- 87 Strongly Landlord-Friendly
- State Florida
- 87 Strongly Landlord-Friendly · R+3
- County
- — inherits STATE
- City
- — inherits STATE
ZIP-level market 33484
- Rents YoY
- 4.3%
- Active inventory
- 546
- Price-to-rent
- 6.4×
Monthly cashflow live
- Estimated rent
- $1,966 high interval (Pro) →
- Mortgage (P&I)
- −$787
- Tax from tax record
- −$150 /mo · $1,800/yr
- Insurance
- −$62
- HOA
- −$718
- Vacancy / Maint / Mgmt
- −$413
- Net cashflow
- $-164
Break-even live
UW: 25.0% down · 7.5% · 30yr · 1.5% tax · 5.0% vac · 8.0% maint · 8.0% mgmt
Financing live
Cash to close
- Down payment
- $37,500
- Closing costs
- $4,500
- Reserves months
- —
- Total cash needed
- —
Loan-product check · same deal, 3 products live
Conventional
25% down · 7.5% · 30yr
- Down + closing
- —
- Monthly P&I
- —
- Monthly cashflow
- —
- DSCR
- —
- Eligible?
- —
Personal DTI + credit; lowest rate.
DSCR
20% down · 8.5% · 30yr
- Down + closing
- —
- Monthly P&I
- —
- Monthly cashflow
- —
- DSCR
- —
- Eligible?
- —
No personal income docs; deal must DSCR.
Hard money
10% down · 12.0% · 12mo
- Down + closing
- —
- Monthly P&I
- —
- Monthly cashflow
- —
- DSCR
- —
- Eligible?
- —
Short-term bridge; refi at stabilization.
Rent comps 40 comps
| Address | Beds | Baths | Sqft | Rent | $/sqft | DOM | Units | Dist |
|---|---|---|---|---|---|---|---|---|
| 29 Flanders a Delray Beach, FL | 2.0 | 2.0 | 760 | $1,900 | $2.50 | 24d | 1 | 0.06mi |
| 492 Piedmont Ct Delray Beach, FL | 2.0 | 2.0 | 1040 | $2,200 | $2.12 | 24d | 1 | 0.11mi |
| 23 Flanders a Delray Beach, FL | 1.0 | 1.5 | 760 | $1,500 | $1.97 | 24d | 1 | 0.12mi |
| 52 Saxony Cir Unit 52 Delray Beach, FL | 2.0 | 2.0 | 1027 | $3,200 | $3.12 | 24d | 1 | 0.13mi |
| 7 Piedmont a Delray Beach, FL | 2.0 | 2.0 | 910 | $2,200 | $2.42 | 2d | 1 | 0.14mi |
| 370 Piedmont H Delray Beach, FL | 1.0 | 1.5 | 760 | $1,600 | $2.11 | 24d | 1 | 0.14mi |
| 368 Piedmont H Unit H Delray Beach, FL | 2.0 | 2.0 | 910 | $1,850 | $2.03 | 24d | 1 | 0.14mi |
| 370 Piedmont Trl Unit 370 Delray Beach, FL | 1.0 | 2.0 | 760 | $1,700 | $2.24 | 24d | 1 | 0.14mi |
| 514 Piedmont K Unit k Delray Beach, FL | 1.0 | 1.5 | 792 | $1,690 | $2.13 | 2d | 1 | 0.15mi |
| 514 Piedmont K Delray Beach, FL | 1.0 | 1.5 | 792 | $1,690 | $2.13 | 24d | 1 | 0.15mi |
| 344 Piedmont Trl Delray Beach, FL | 2.0 | 2.0 | 910 | $1,600 | $1.76 | 24d | 1 | 0.17mi |
| 99 Saxony C Delray Beach, FL | 1.0 | 1.5 | 720 | $2,500 | $3.47 | 24d | 1 | 0.18mi |
| 322 Piedmont G Delray Beach, FL | 2.0 | 2.0 | 910 | $2,000 | $2.20 | 13d | 1 | 0.18mi |
| 322 Piedmont G Delray Beach, FL | 2.0 | 2.0 | 910 | $1,800 | $1.98 | 7d | 1 | 0.18mi |
| 341 Piedmont H Unit H Delray Beach, FL | 2.0 | 2.0 | 907 | $1,650 | $1.82 | 13d | 1 | 0.19mi |
| 224 Piedmont F #224 Delray Beach, FL | 1.0 | 1.5 | 760 | $1,200 | $1.58 | 24d | 1 | 0.19mi |
| 499 Piedmont K Delray Beach, FL | 2.0 | 2.0 | 907 | $2,800 | $3.09 | 24d | 1 | 0.19mi |
| 111 Normandy Ln Delray Beach, FL | 1.0 | 1.5 | 726 | $1,450 | $2.00 | 1d | 1 | 0.20mi |
| 151 Saxony D Delray Beach, FL | 1.0 | 1.5 | 726 | $1,500 | $2.07 | 11d | 1 | 0.21mi |
| 185 Valencia H Delray Beach, FL | 2.0 | 2.0 | 883 | $1,700 | $1.93 | 24d | 1 | 0.21mi |
| 175 Valencia H Delray Beach, FL | 1.0 | 1.5 | 726 | $1,500 | $2.07 | 7d | 1 | 0.21mi |
| 523 Piedmont E Unit 523 Delray Beach, FL | 2.0 | 2.0 | 1044 | $1,750 | $1.68 | 24d | 1 | 0.23mi |
| 127 Flanders C Delray Beach, FL | 1.0 | 1.5 | 760 | $1,550 | $2.04 | 24d | 1 | 0.25mi |
| 176 Piedmont D Delray Beach, FL | 2.0 | 2.0 | 910 | $1,600 | $1.76 | 24d | 1 | 0.26mi |
| 211 Saxony Ln #211 Delray Beach, FL | 1.0 | 1.5 | 720 | $1,400 | $1.94 | 7d | 1 | 0.26mi |
| 669 Monaco N Delray Beach, FL | 2.0 | 2.0 | 880 | $1,700 | $1.93 | 24d | 1 | 0.26mi |
| 322 Seville N Delray Beach, FL | 1.0 | 1.5 | 720 | $1,495 | $2.08 | 24d | 1 | 0.27mi |
| 153 Monaco D Delray Beach, FL | 2.0 | 2.0 | 880 | $1,750 | $1.99 | 16d | 1 | 0.28mi |
| 137 Piedmont Way Unit 137 Delray Beach, FL | 2.0 | 2.0 | 1040 | $2,300 | $2.21 | 10d | 1 | 0.28mi |
| 318 Seville N #318 Delray Beach, FL | 1.0 | 1.5 | 720 | $1,495 | $2.08 | 24d | 1 | 0.28mi |
| 166 Piedmont Way Delray Beach, FL | 2.0 | 2.0 | 910 | $1,600 | $1.76 | 24d | 1 | 0.29mi |
| 401 Monaco Way Unit 401 Delray Beach, FL | 2.0 | 2.0 | 920 | $1,950 | $2.12 | 24d | 1 | 0.29mi |
| 719 Flanders O Delray Beach, FL | 2.0 | 2.0 | 920 | $1,800 | $1.96 | 24d | 1 | 0.30mi |
| 352 Saxony Trl Unit 352 Delray Beach, FL | 2.0 | 2.0 | 907 | $2,000 | $2.21 | 24d | 1 | 0.30mi |
| 177 Flanders D Delray Beach, FL | 2.0 | 2.0 | 920 | $1,600 | $1.74 | 24d | 1 | 0.31mi |
| 459 Monaco Blvd Unit 459 Delray Beach, FL | 1.0 | 1.5 | 720 | $1,500 | $2.08 | 20d | 1 | 0.31mi |
| 711 Monaco O Delray Beach, FL | 1.0 | 1.5 | 720 | $1,550 | $2.15 | 24d | 1 | 0.31mi |
| 581 Monaco Blvd Unit 581 Delray Beach, FL | 2.0 | 2.0 | 880 | $2,000 | $2.27 | 24d | 1 | 0.31mi |
| 451 Monaco Blvd Unit J Delray Beach, FL | 1.0 | 1.5 | 720 | $1,599 | $2.22 | 24d | 1 | 0.31mi |
| 482 Monaco Blvd #482 Delray Beach, FL | 1.0 | 1.5 | 726 | $1,400 | $1.93 | 24d | 1 | 0.31mi |
HOA detail condo
- Monthly dues
- $718 · $8,616/yr
- Assessments
- None detected in remarks — confirm with the listing agent.
Listing history 16 events
-
2026-06-18days on market $149,999 Active 62 DOM
-
2026-06-17days on market $149,999 Active 61 DOM
-
2026-06-16days on market $149,999 Active 60 DOM
-
2026-06-15days on market $149,999 Active 59 DOM
-
2026-06-13days on market $149,999 Active 57 DOM
-
2026-06-09days on market $149,999 Active 53 DOM
-
2026-06-08days on market $149,999 Active 52 DOM
-
2026-06-07days on market $149,999 Active 51 DOM
-
2026-06-04days on market $149,999 Active 48 DOM
-
2026-06-03days on market $149,999 Active 47 DOM
-
2026-06-02pricedays on market $149,999 Active 46 DOM
-
2026-06-01days on market $159,999 Active 45 DOM
-
2026-05-31days on market $159,999 Active 44 DOM
-
2026-04-17$159,999 Active
-
2026-04-02soldstatus $46,000
-
1994-01-21soldstatus $36,000
ⓘ Source: listings_history table (triggers on properties + properties_extension) + one-shot
backfill from property_details.listing_events for pre-trigger history.
Tax reassessment forecast FL · Resets to sale price
- Current annual tax
- $1,800 · $150/mo
- Projected year-2 tax
- $1,800 · $150/mo
- Expected delta
- $0/yr ($0/mo · 0.0%)
ⓘ Screening estimate from a state-policy table — verify with the county assessor before closing.
Climate risk First Street
- Flood 1/10 Low FEMA zone X (unshaded) · 0% chance over 30 yrs
- Wildfire 1/10 Low
- Heat 9/10 Extreme 6 d/yr ≥107°F today · 22 d/yr by 30 yrs out
- Wind 10/10 Extreme 99% chance of damaging wind over 30 yrs
- Air quality 3/10 Moderate 2 unhealthy d/yr today · 3 by 30 yrs out
Nearby sold comps map
Loading sold comps map…
Walkable amenities ~0.75 mi
Loading nearby amenities…
Taxation est. · year 1
- Rental income
- $23,591
- − Mortgage interest
- −$8,402
- − Property taxes
- −$1,800
- − Insurance
- −$750
- − Repairs & maintenance
- −$1,887
- − Management
- −$1,887
- − HOA
- −$8,616
- − Depreciation
- −$4,364
- Taxable loss
- −$4,115
- Est. tax savings @ 24.0%
- +$988
- After-tax cash flow
- $-981/yr
For passive investors: Depreciation is non-cash, so a rental often shows a tax loss while cash-flowing — sheltering income. Rental losses are passive: they offset passive income freely, and up to $25,000/yr can offset ordinary (W-2) income if you actively participate and your MAGI is under $100k (phasing out to $0 by $150k); unused losses carry forward. On sale, claimed depreciation is recaptured at up to 25%, and gains may owe capital-gains tax (a 1031 exchange can defer both). Figures are a year-1 estimate at your 24.0% rate — not tax advice; consult a CPA.
Schools (NCES district)
- District
- Palm Beach
- NCES district ID
- 1201500
- Math proficiency
- 46% ▼ -16.00%
- Reading proficiency
- 53% ▼ -4.00%
- Median HH income
- $53,943
- Composite
- 42.72/100
- National rank
- #3160
- State rank
- #34 of 73 in FL
Livability — Delray Beach
- Score
- 77/100
- State rank
- #202
- US rank
- #3160
Category grades
Schools grade is shown separately in the Schools card above.
Census & demographics
- County
- Palm Beach County · 1,438,312 people
- City population
- 123,167
- Metro
- Miami-Fort Lauderdale-Pompano Beach, FL
- Population (ZIP)
- 26,208
- Household income
- $62,151
- Rent vs Own
- Severe rent burden
- 991.0
Population outlook (Palm Beach County) Hauer SSP2
- Today (2025)
- 1,637,487 people
- By 2030
- 1,743,255 · +6.5%
- By 2040
- 1,948,712 · +19.0%
- By 2050
- 2,132,979 · +30.3%
- By 2075
- 2,530,027 · +54.5%
- By 2100
- 2,706,979 · +65.3%
Race, ethnicity, and origin ACS 2023
- Neighborhood character
- Predominantly White (74%)
- Race & ethnicity
- White 74% Hispanic / Latino 14% Two or more races 10% Black 5% Asian 2%
- Hispanic origin (detail)
- Puerto Rican 2% Cuban 2%
- Common ancestry
- Scotch-Irish 7% Romanian 6% Italian 2%
- Foreign-born
- 23% · Canada, Jamaica, China
- Languages at home
- 76% English-only · Spanish 13% Russian/Polish/Slavic 3% French/Haitian/Cajun 3%
Political lean MEDSL · Palm Beach
- 2024 margin
- Toss-up / Even · D 50.0% · R 49.2%
- 2008→2024 swing
- -22.1pp toward R · 2008: 22.9pp · 2024: 0.8pp
- All cycles
- 2024: D+0.8 2020: D+12.8 2016: D+15.3 2012: D+17.0 2008: D+22.9
Not yet ingested
- Civics
- —
Market trends
- HPI YoY
- ▼ -232.73%
- Current HPI
- 254.5016
- Rent YoY
- ▲ 4.28%
- Metro
- Miami-Fort Lauderdale-Pompano Beach, FL
- State GDP YoY
- ▲ 3.28%
- F500 in state
- 36
Industry mix (Fortune 500 HQ in FL)
| Industry | F500 HQs | Revenue |
|---|---|---|
| Industrial Technology | 2 | $29B |
|
||
| Insurance | 2 | $17B |
|
||
| Retail | 1 | $60B |
|
||
| Technology Distribution | 1 | $58B |
|
||
| Homebuilding | 1 | $35B |
|
||
| Technology Manufacturing | 1 | $35B |
|
||
Price history
+344.4% since first listed3 events — show timeline
- 2026-04-17 Listed $159,999 Beaches MLS
- 2026-04-02 Sold (Public Records) $46,000 Public Records
- 1994-01-21 Sold (Public Records) $36,000 Public Records
Property tax history
+16.4%/yrLatest (2025): $1,800 · +604.5% YoY. Source: county tax records.
Cash-flow waterfall
monthlySold comps — $/sqft
last 12 mo · ≤1 miLoading sold comps…