2620 N Tustin Unit A/37 · Santa Ana, CA
Flood risk No data
- FEMA flood zone
- —
- Chance of flooding over 30 yrs
- —
- Est. flood insurance / yr
- —
Fire risk No data
- Est. fire insurance / yr
- —
Heat risk No data
- Hot days now (above threshold)
- —
- Hot days in 30 yrs
- —
Wind risk No data
- Chance of severe wind over 30 yrs
- —
Air-quality risk No data
- Unhealthy air days now
- —
- Unhealthy air days in 30 yrs
- —
Risk factors via First Street. Map © Google.
Why this score? — see what drove the D+ grade
The composite is a weighted blend of 9 inputs, each scored 0–100. Each bar is that input's sub-score; the figure is the points it added to the 100-point composite (weight × sub-score).
- Cash flow +12.3/30.0
- ARV discount +12.0/15.0
- 1% rule +6.4/10.0
- Schools +4.5/10.0
- DSCR +3.7/10.0
- Rent growth +3.4/5.0
- Livability +2.8/5.0
- Condition / age +2.8/5.0
- Appreciation +0.0/10.0
$315,500
🖨 Deal sheet (PDF) 📄 Offer letter ✓ Due diligence
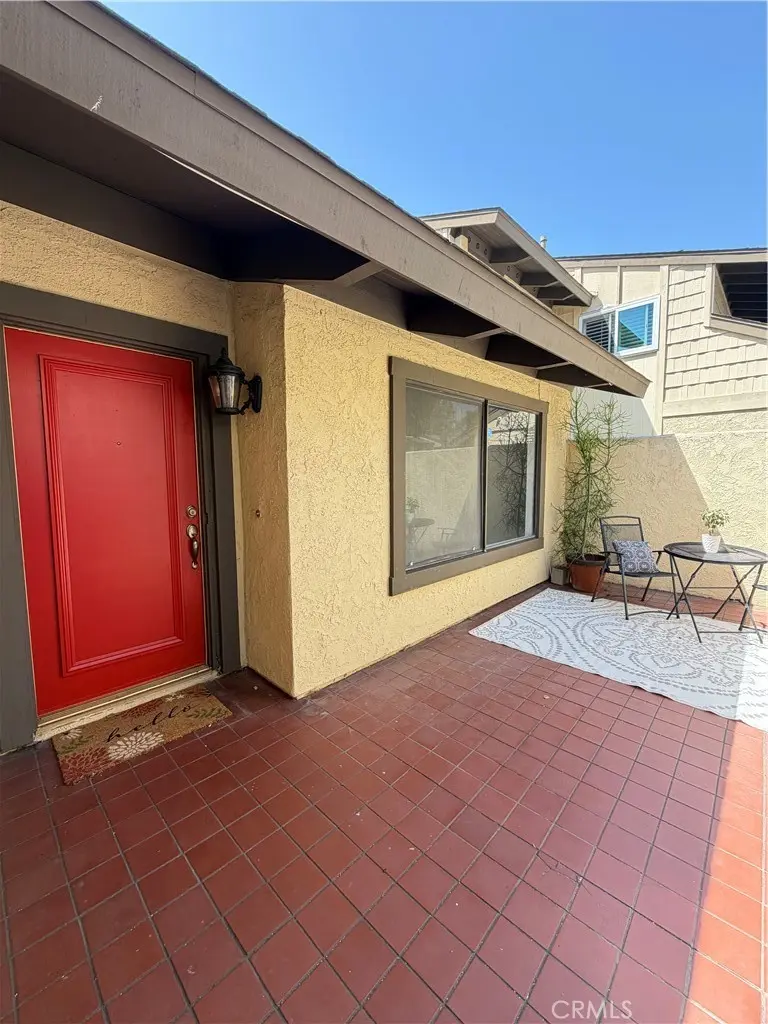
Listing remarks
Beautiful Home in the perfect location. This home sits in a gated community in the heart of Santa Ana. Walk into a private front patio that takes you into your 3-bedroom, 2 bath open floor plan home. High ceilings, large roomy space, great for entertaining family and friends. Kitchen is awaiting your touch and tlc. Large counter space with lots of cabinets for storage. Enjoy your cozy fireplace in your dining area and very private back patio to relax and enjoy. This home has a/c for the hot days. All rooms are great sizes, come see for yourself. Don't wait, this single story won't last - this Property has a LAND LEASE . .
Key facts
- Gated community
- Open floor plan
- Lots of cabinets
Tags
Property features AI
Finance
- Other: Total units in complex: 100; Units in community reported as 150 (multi-unit community)
- Financial info: Land lease: $1,881 monthly (renewal date: December 1, 2049)
- HOA & community: Part of Shady Hallow homeowners association; Association amenities include pool and spa; Association fee: $550 monthly; Secondary association fee: $155 monthly; Community features: gutters, curbs, biking paths, street lighting, sidewalks
Exterior
- Parking: 2 garage spaces; Direct garage access; Garage with opener; Concrete driveway
- Security: Gated community
- Utilities: Standard electric; District/public water; Public sewer; Cable available (see remarks)
- Home design: Attached condominium; Single-story; Turnkey condition; Has view; Entry level: 1
- Construction: Concrete and drywall construction; Concrete slab foundation; Roof: see remarks; Year built source: Assessor
- Exterior features: Front and rear porches (enclosed front porch; rear porch slab); Patio; Community pool; Wood and stucco wall fencing; Has fence; 0-1 Unit/Acre lot character
Interior
- Kitchen: Dishwasher; Garbage disposal; Kitchen island; Breakfast counter/bar; Kitchen open to family room; Tile counters; Water heater unit (gas)
- Bedrooms: Main level bedrooms: 1
- Bathrooms: Full bathrooms: 2; Bathtub; Shower; Shower in tub; Exhaust fan(s)
- Heating & cooling: Central cooling; Central furnace; Heating present (see remarks)
- Interior features: High ceilings (9+ feet); Open floor plan; Ceiling fan; Ceramic counters; Tile counters; Storage space; Unfurnished; Main floor primary bedroom; All bedrooms on ground level; One-level home; Gated community; Community spa
- Laundry & utility: Washer hookup; Gas dryer hookup; Laundry in garage; In-garage laundry
Neighborhood map
What this means for you Summary
Snapshot
- This is a 3-bed/2.0-bath condo listed at $316k. Condition is rated average.
Deal economics
- At list price, monthly cash flow is $-56 ($-673/yr) — negative.
- To cash-flow at today's rent, offer at most $307k (2.6% below list).
- Meets the 1% rule at list price ($4k rent vs $316k).
- Recommended offer: $306k (3.0% below list) — sets the bar for market timing.
- Cap rate 6.1% vs local median 2.5% in Santa Ana — top-decile yield for the area; either an underpriced asset or a hidden risk that comps aren't pricing in. Stress-test before assuming the spread holds.
Location & tenants
- Location reads 55/100 on livability (#871 in CA) — a working-class tenant base; expect higher turnover. Strengths: employment A; Watch: crime D-, amenities F, commute F.
- Orange Unified (urban): math 39% / reading 60% proficiency, ranked #127 of 517 in CA (top 25%) — families likely to look elsewhere, expect single-tenant / working-renter base with shorter leases.
- Zoned schools: Fairhaven Elementary (math 24% / reading 24%, grade F, #973 of 1,571 statewide, top 73%, 445 students, 64% FRL); Portola Middle (597 students, 91% FRL); Orange High (math 19% / reading 48%, grade F, #656 of 1,170 statewide, top 57%, 1,807 students, 89% FRL) — zoned schools average 82% FRL vs 38% district-wide (43 pts higher); higher-poverty schools than district average — tighter screening recommended.
- Zoned-school proficiency averages 29% at this address vs 50% district-wide (-20 pts) — the specific schools serving this property underperform the Orange Unified average; the district grade overstates school quality for this exact location.
- Market conditions: Rents rising (+3.7%/yr); 97 active listings in the ZIP; 40 comparable units currently listed for rent nearby; rentals at typical pace (median 21d on market — plan ~3-4 weeks tenant-placement turnaround); high-income renter base; 6,974 units permitted in Orange County in 2024 (3,839 in 5+ unit buildings).
- This rent runs 33% of the median local income ($129k/yr) — at the standard rent-burdened threshold; future hikes will face affordability resistance.
Forward outlook
- Local home prices are declining (-3.0%/yr); year-one equity from $2k of loan paydown is wiped out by about $9k of value loss. Plan a longer hold.
- Orange County population projected at +14% by 2050 — modest demand growth; plan on rents tracking national, not racing it.
Negotiation context
- It's been on market 56 days — a 3% lower offer ($306k) is reasonable based on typical stale-listing flexibility.
Questions for the listing agent
- What do current leases actually rent for vs. the listed asking? Can we see a recent rent roll and the last 12 months of T-12 income?
- It's been on market 56 days. Have you received any prior offers? Is the seller open to a 3% concession, seller financing, or rate buy-down credit?
- Built in 1974 — when were the roof, HVAC, electrical panel, plumbing, and water heater last replaced?
- What does the HOA fee cover, when was the last increase, and are there any pending special assessments or reserve-fund shortfalls?
- Any open or pending special assessments — roof, HVAC, plumbing, elevator, façade? What's the per-unit balance and payoff schedule, and is the seller paying it off at close or rolling it to the buyer?
- Is there a deadline driving the sale (1031 exchange, divorce, estate, relocation)? That informs how much negotiation room exists.
- Schools are D-rated, which usually means shorter tenancies and higher turnover. Who's the typical renter profile here, and what's been the actual vacancy rate?
- Crime grade is D in this area — have there been break-ins, vandalism, or insurance claims at this property in the last 3 years? What carrier currently insures it and at what premium?
- The area grade is low — what's the realistic commute time and amenity access for the typical tenant pool here? Any planned neighborhood developments (good or bad) we should know about?
- What's the average days-on-market for RENTAL listings here right now (not sales)? A rising rental-DOM trend means longer vacancies and softer asking-rent achievability than the comps imply.
- What's the recent tenant-quality profile in this submarket — average credit score on applications, eviction rate, late-payment / NSF rate, and stable-employment percentage? A property-management company in the area should have these aggregated.
- How much new apartment / multifamily construction is in the pipeline within 1–3 miles? Heavy new supply (>2% of stock underway) typically softens rents 12–24 months out; light construction supports rent growth.
Investment metrics
- 1% rule
- 1.14% ✓
- Cap rate
- 6.08%
- Cash-on-cash
- -0.76%
- DSCR
- 0.97
- GRM
- 7.3
CMA / ARV
- ARV (median comp)
- $350,750
- List price
- $315,500
- Delta
- -10.05%
- Verdict
- UNDERPRICED
- Comps
- 20 within 1.0 mi
Projected returns pro-forma
-3.0% appreciation · 3.72% rent growth · sell at horizon
- IRR
- -16.3%
- Equity multiple
- 0.42×
- Total profit
- $-51,596
- Equity at exit
- $47,042
- IRR
- -6.1%
- Equity multiple
- 0.58×
- Total profit
- $-36,668
- Equity at exit
- $27,279
Cash invested: $88,340 (down + closing). Projections, not guarantees.
Landlord ↔ Tenant lean methodology
- Overall (STATE)
- 18 Strongly Tenant-Friendly
- State California
- 18 Strongly Tenant-Friendly · D+13
- County
- — inherits STATE
- City
- — inherits STATE
ZIP-level market 92705
- Rents YoY
- 3.7%
- Active inventory
- 97
- Price-to-rent
- 7.3×
Monthly cashflow live
- Estimated rent
- $3,581 high interval (Pro) →
- Mortgage (P&I)
- −$1,655
- Tax est. 1.5%
- −$394 /mo · $4,732/yr
- Insurance
- −$131
- HOA
- −$705
- Vacancy / Maint / Mgmt
- −$752
- Net cashflow
- $-56
Break-even live
Sensitivity live
| Price | -10% $162 | -5% $53 | +0% $-56 | +5% $-165 | +10% $-274 |
|---|---|---|---|---|---|
| Rent | -10% $-339 | -5% $-198 | +0% $-56 | +5% $85 | +10% $227 |
| Rate | -1.0pp $103 | -0.5pp $24 | base $-56 | +0.5pp $-138 | +1.0pp $-221 |
UW: 25.0% down · 7.5% · 30yr · 1.5% tax · 5.0% vac · 8.0% maint · 8.0% mgmt
Financing live
Cash to close
- Down payment
- $78,875
- Closing costs
- $9,465
- Reserves months
- —
- Total cash needed
- —
Loan-product check · same deal, 3 products live
Conventional
25% down · 7.5% · 30yr
- Down + closing
- —
- Monthly P&I
- —
- Monthly cashflow
- —
- DSCR
- —
- Eligible?
- —
Personal DTI + credit; lowest rate.
DSCR
20% down · 8.5% · 30yr
- Down + closing
- —
- Monthly P&I
- —
- Monthly cashflow
- —
- DSCR
- —
- Eligible?
- —
No personal income docs; deal must DSCR.
Hard money
10% down · 12.0% · 12mo
- Down + closing
- —
- Monthly P&I
- —
- Monthly cashflow
- —
- DSCR
- —
- Eligible?
- —
Short-term bridge; refi at stabilization.
Rent comps 40 comps
| Address | Beds | Baths | Sqft | Rent | $/sqft | DOM | Units | Dist |
|---|---|---|---|---|---|---|---|---|
| 819 S Ponderosa St Orange, CA | 2.0 | 2.0 | 1300 | $2,980 | $2.29 | 45d | 1 | 0.27mi |
| 2414 N Tustin Ave Santa Ana, CA | 2.0 | 1.0–2.0 | 738 | $2,933 | $3.97 | 0d | 29 | 0.30mi |
| 2243 E Santa Clara Ave Santa Ana, CA | 1.0–2.0 | 1.0–2.0 | 991 | $2,925 | $2.95 | 26d | 3 | 0.48mi |
| 2215 E Avalon Ave Santa Ana, CA | 3.0 | 2.0 | 1315 | $1,400 | $1.06 | 45d | 1 | 0.54mi |
| 1047 E Tularosa Ave Orange, CA | 3.0 | 2.0 | 1745 | $4,500 | $2.58 | 0d | 1 | 0.54mi |
| 2210 E Avalon Ave Santa Ana, CA | 3.0 | 2.0 | 1325 | $3,750 | $2.83 | 0d | 1 | 0.56mi |
| 2210 E Avalon Ave Unit 2210 Santa Ana, CA | 3.0 | 2.0 | 1325 | $3,800 | $2.87 | 45d | 1 | 0.56mi |
| 2232 E Lenita Ln Unit K Santa Ana, CA | 2.0 | 1.0 | 900 | $2,695 | $2.99 | 45d | 1 | 0.75mi |
| 2232 E Lenita Ln Unit K Santa Ana, CA | 2.0 | 1.0 | 900 | $2,695 | $2.99 | 26d | 1 | 0.75mi |
| 327 S Wayfield St Orange, CA | 3.0 | 2.0 | 1200 | $3,900 | $3.25 | 0d | 1 | 0.79mi |
| 1300 Fairhaven Ave Santa Ana, CA | 1.0–2.0 | 1.0–2.0 | 900 | $2,879 | $3.20 | 0d | 6 | 0.79mi |
| 326 S Waverly St Apt 4 Orange, CA | 2.0 | 2.0 | 940 | $2,995 | $3.19 | 26d | 1 | 0.80mi |
| 1920 Sherry Ln Santa Ana, CA | 2.0 | 2.0 | 1080 | $2,995 | $2.77 | 26d | 1 | 0.83mi |
| 817 E Palmyra Ave Orange, CA | 2.0 | 2.0 | 1656 | $3,000 | $1.81 | 24d | 1 | 0.88mi |
| 478 S Grand St Orange, CA | 3.0 | 1.0 | 1066 | $4,195 | $3.94 | 17d | 1 | 0.94mi |
| 478 S Grand St Orange, CA | 3.0 | 1.0 | 1066 | $3,995 | $3.75 | 12d | 1 | 0.94mi |
| 480 S Grand St Unit 478 Orange, CA | 3.0 | 1.0 | 1066 | $3,995 | $3.75 | 7d | 1 | 0.95mi |
| 1201 Fairhaven Ave Santa Ana, CA | 1.0–2.0 | 1.0–2.0 | 863 | $3,275 | $3.79 | 0d | 9 | 0.97mi |
| 1600 Mabury St Santa Ana, CA | 3.0 | 2.0 | 1480 | $3,595 | $2.43 | 45d | 1 | 1.05mi |
| 340 W Fairway Dr Apt B Orange, CA | 2.0 | 2.0 | 950 | $2,400 | $2.53 | 14d | 1 | 1.10mi |
| 619 S Cypress St Unit B Orange, CA | 2.0 | 2.0 | 1000 | $2,900 | $2.90 | 45d | 1 | 1.13mi |
| 316 W La Veta Ave Unit 326 C Orange, CA | 2.0 | 2.0 | 1000 | $2,475 | $2.48 | 0d | 1 | 1.14mi |
| 344 W Tularosa Ave Orange, CA | 2.0 | 2.0 | 950 | $2,495 | $2.63 | 26d | 1 | 1.14mi |
| 344 W Tularosa Ave Unit Tularosa 344 (C) Orange, CA | 2.0 | 2.0 | 950 | $2,495 | $2.63 | 20d | 1 | 1.14mi |
| 336 W La Veta Ave Unit D Orange, CA | 2.0 | 2.0 | 1080 | $2,750 | $2.55 | 45d | 1 | 1.16mi |
| 181 N Waverly St Orange, CA | 3.0 | 2.0 | 1522 | $4,900 | $3.22 | 45d | 1 | 1.16mi |
| 166 N Cambridge St Orange, CA | 3.0 | 2.0 | 1100 | $3,995 | $3.63 | 18d | 1 | 1.17mi |
| 602 S Cypress St Unit B Orange, CA | 2.0 | 2.0 | 950 | $2,495 | $2.63 | 13d | 1 | 1.17mi |
| 408 W La Veta Ave Orange, CA | 3.0 | 2.0 | 1439 | $4,000 | $2.78 | 45d | 1 | 1.18mi |
| 401 W La Veta Ave Orange, CA | 2.0–3.0 | 2.0–2.5 | 1152 | $3,695 | $3.21 | 12d | 6 | 1.21mi |
| 201 N Wayfield St Orange, CA | 1.0–2.0 | 1.0–2.0 | 870 | $2,945 | $3.39 | 14d | 2 | 1.25mi |
| 1094 Cabrillo Park Dr Unit B Santa Ana, CA | 2.0 | 2.0 | 1007 | $2,545 | $2.53 | 45d | 1 | 1.27mi |
| 227 N Cleveland St Orange, CA | 3.0 | 2.0 | 1200 | $5,295 | $4.41 | 0d | 1 | 1.30mi |
| 850 W Town and Country Rd Orange, CA | 3.0 | 1.0–2.0 | 1008 | $4,382 | $4.35 | 0d | 21 | 1.33mi |
| 345 N Shattuck Pl Orange, CA | 3.0 | 2.0 | 1421 | $4,995 | $3.52 | 0d | 1 | 1.33mi |
| 345 N Shattuck Pl Orange, CA | 3.0 | 1.5 | 1434 | $5,195 | $3.62 | 18d | 1 | 1.33mi |
| 1311 E Washington Pl Unit H-3 Santa Ana, CA | 2.0 | 1.0 | 950 | $3,050 | $3.21 | 19d | 1 | 1.33mi |
| 250 N Cleveland St Orange, CA | 3.0 | 1.0 | 1280 | $4,500 | $3.52 | 20d | 1 | 1.34mi |
| 1311 E Washington Pl Unit P-1 Santa Ana, CA | 2.0 | 1.0 | 950 | $3,255 | $3.43 | 26d | 1 | 1.35mi |
| 1311 E Washington Pl Apt C3 Santa Ana, CA | 2.0 | 1.0 | 950 | $3,145 | $3.31 | 26d | 1 | 1.35mi |
HOA detail condo
- Monthly dues
- $705 · $8,460/yr
- Likely covers
- security
- Assessments
- None detected in remarks — confirm with the listing agent.
Listing history 16 events
-
2026-06-21days on market $315,500 Active 56 DOM
-
2026-06-18days on market $315,500 Active 53 DOM
-
2026-06-17days on market $315,500 Active 52 DOM
-
2026-06-16days on market $315,500 Active 51 DOM
-
2026-06-15days on market $315,500 Active 50 DOM
-
2026-06-13days on market $315,500 Active 48 DOM
-
2026-06-13days on market $315,500 Active 47 DOM
-
2026-06-09days on market $315,500 Active 44 DOM
-
2026-06-08days on market $315,500 Active 43 DOM
-
2026-06-07days on market $315,500 Active 42 DOM
-
2026-06-04days on market $315,500 Active 39 DOM
-
2026-06-03days on market $315,500 Active 38 DOM
-
2026-06-02days on market $315,500 Active 37 DOM
-
2026-06-01days on market $315,500 Active 36 DOM
-
2026-05-31days on market $315,500 Active 35 DOM
-
2026-04-26$340,000 Active 629-char remark
ⓘ Source: listings_history table (triggers on properties + properties_extension) + one-shot
backfill from property_details.listing_events for pre-trigger history.
Nearby sold comps map
Loading sold comps map…
Walkable amenities ~0.75 mi
Loading nearby amenities…
Taxation est. · year 1
- Rental income
- $42,976
- − Mortgage interest
- −$17,673
- − Property taxes
- −$4,732
- − Insurance
- −$1,578
- − Repairs & maintenance
- −$3,438
- − Management
- −$3,438
- − HOA
- −$8,460
- − Depreciation
- −$9,178
- Taxable loss
- −$5,521
- Est. tax savings @ 24.0%
- +$1,325
- After-tax cash flow
- $652/yr
For passive investors: Depreciation is non-cash, so a rental often shows a tax loss while cash-flowing — sheltering income. Rental losses are passive: they offset passive income freely, and up to $25,000/yr can offset ordinary (W-2) income if you actively participate and your MAGI is under $100k (phasing out to $0 by $150k); unused losses carry forward. On sale, claimed depreciation is recaptured at up to 25%, and gains may owe capital-gains tax (a 1031 exchange can defer both). Figures are a year-1 estimate at your 24.0% rate — not tax advice; consult a CPA.
Condition & rehab AI · 12 photos
This home requires moderate renovations to improve its condition and value. The kitchen and bathrooms need significant updates, and the interior walls and windows should be cleaned. Painting the interior walls and replacing the kitchen cabinets and bathroom fixtures would significantly enhance the home's resale and rental value.
Repairs flagged
- Major Kitchen cabinets — Awaiting TLC
- Major Bathroom fixtures — Awaiting TLC
Value-add opportunities
- Both Paint interior walls — Enhances curb appeal and interior aesthetics
- Both Replace kitchen cabinets — Improves functionality and aesthetics
- Both Replace bathroom fixtures — Improves functionality and aesthetics
Renovation cost estimate screening
| Repair item | Severity | Est. cost |
|---|---|---|
| Kitchen cabinets · Awaiting TLC | Major | $15,000–50,000 |
| Bathroom fixtures · Awaiting TLC | Major | $15,000–50,000 |
| Total estimated repair cost · 2 items | $30,000–100,000 |
Value-add ROI direction
- Both Paint interior walls — Enhances curb appeal and interior aesthetics ↑
- Both Replace kitchen cabinets — Improves functionality and aesthetics ↑
- Both Replace bathroom fixtures — Improves functionality and aesthetics ↑
ⓘ Cost ranges are severity-bucket heuristics (US national rule-of-thumb). Get contractor quotes + a written scope before underwriting a rehab budget.
Schools (NCES district)
- District
- Orange Unified
- NCES district ID
- 0628650
- Math proficiency
- 39% ▼ -6.00%
- Reading proficiency
- 60% ▲ 3.00%
- Median HH income
- $83,557
- Composite
- 45.5/100
- National rank
- #2609
- State rank
- #127 of 517 in CA
Livability — Santa Ana
- Score
- 55/100
- State rank
- #871
- US rank
- #23502
Category grades
Schools grade is shown separately in the Schools card above.
Census & demographics
- Census place
- Santa Ana, CA
- County
- Orange County · 3,096,323 people
- City population
- 288,255
- Metro
- Los Angeles-Long Beach-Anaheim, CA
- Population (ZIP)
- 48,781
- Household income
- $129,331
- Rent vs Own
- Severe rent burden
- 1962.0
Population outlook (Orange County) Hauer SSP2
- Today (2025)
- 3,477,456 people
- By 2030
- 3,613,117 · +3.9%
- By 2040
- 3,835,945 · +10.3%
- By 2050
- 3,968,736 · +14.1%
- By 2075
- 4,097,053 · +17.8%
- By 2100
- 3,903,633 · +12.3%
Race, ethnicity, and origin ACS 2023
- Neighborhood character
- Diverse neighborhood (Simpson 0.64)
- Race & ethnicity
- Hispanic / Latino 48% White 34% Two or more races 17% Asian 11% Black 1%
- Hispanic origin (detail)
- Mexican 42%
- Common ancestry
- Lithuanian 2% Italian 1% Romanian 1%
- Foreign-born
- 25% · Canada, Vietnam, China
- Languages at home
- 53% English-only · Spanish 36% Other Indo-European 3% Chinese 2%
Political lean MEDSL · Orange
- 2024 margin
- Toss-up / Even · D 49.7% · R 47.1% · Other 3.2%
- 2008→2024 swing
- +5.2pp toward D · 2008: -2.6pp · 2024: 2.6pp
- All cycles
- 2024: D+2.6 2020: D+9.0 2016: D+7.7 2012: R+8.3 2008: R+2.6
Not yet ingested
- Civics
- —
Market trends
- HPI YoY
- ▼ -831.43%
- Current HPI
- 453.5303
- Rent YoY
- ▲ 3.72%
- Metro
- Los Angeles-Long Beach-Anaheim, CA
- State GDP YoY
- ▲ 3.21%
- F500 in state
- 116
Industry mix (Fortune 500 HQ in CA)
| Industry | F500 HQs | Revenue |
|---|---|---|
| Technology | 27 | $1,492B |
|
||
| Financial Services | 3 | $174B |
|
||
| Retail | 3 | $44B |
|
||
| Insurance | 3 | $26B |
|
||
| Media / Entertainment | 2 | $115B |
|
||
| Pharmaceuticals / Biotech | 2 | $62B |
|
||
Price history
-7.2% since first listed2 events — show timeline
- 2026-05-27 Price Changed $315,500 CRMLS
- 2026-04-26 Listed $340,000 CRMLS
Cash-flow waterfall
monthlySold comps — $/sqft
last 12 mo · ≤1 miLoading sold comps…