 🌊 Lakefront
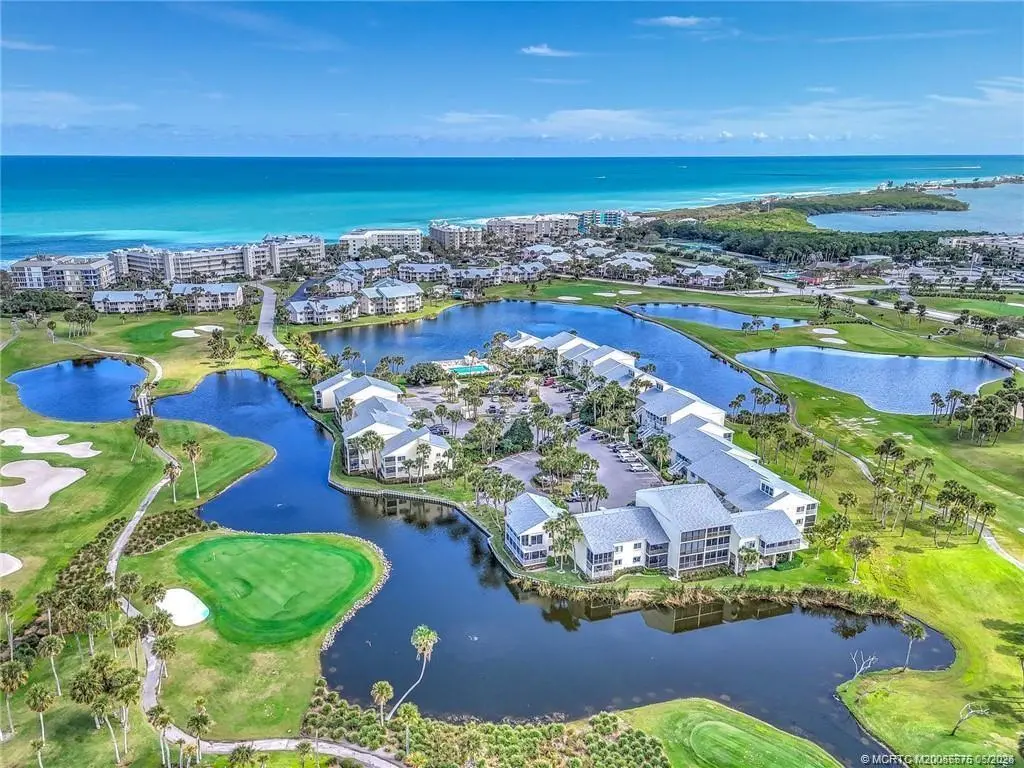
5558 NE Gulfstream Way · Sewall's Point, FL
Flood risk 10/10 · Severe
- FEMA flood zone
- X (shaded)
- Chance of flooding over 30 yrs
- 0.99%
- Est. flood insurance / yr
- $507 – $1,088
Fire risk 2/10 · Minimal
- Est. fire insurance / yr
- $947 – $1,759
Heat risk 10/10 · Severe
- Hot days now (above 106°F)
- 7 days/yr
- Hot days in 30 yrs
- 26 days/yr
Wind risk 10/10 · Severe
- Chance of severe wind over 30 yrs
- 99.0%
Air-quality risk 2/10 · Minimal
- Unhealthy air days now
- 2 days/yr
- Unhealthy air days in 30 yrs
- 2 days/yr
Risk factors via First Street. Map © Google.
Why this score? — see what drove the D- grade
The composite is a weighted blend of 9 inputs, each scored 0–100. Each bar is that input's sub-score; the figure is the points it added to the 100-point composite (weight × sub-score).
- ARV discount +15.0/15.0
- Appreciation +10.0/10.0
- Schools +4.5/10.0
- Rent growth +2.5/5.0
- Livability +2.5/5.0
- Condition / age +2.5/5.0
- Cash flow +0.5/30.0
- 1% rule +0.2/10.0
- DSCR +0.0/10.0
$450,000
🖨 Deal sheet 📄 Offer letter ✓ Due diligence
Listing remarks
Coastal sophistication meets timeless elegance in this beautifully updated two-story townhome nestled on desirable Hutchinson Island. Wake each morning to glorious sunrises-unwind in the evening with splendid sunset displays painting the sky over the golf course and shimmering lakes, from both the expanded living room and spacious primary suite. The main level showcases updated kitchen, powder bath, expansive living and dining areas — the perfect setting for morning coffee or sunset cocktails. Upstairs, two generously sized bedrooms and two full baths create a serene and private sanctuary. Upgrades include impact sliders and doors, along with a recently installed HVAC system for comfo
Key facts
- $800 HOA
- Parking
- Built 1980
Property features AI
Finance
- Financial info: Pets allowed with number limit
- HOA & community: Homeowners association with $800 fee; Association covers management, cable TV, insurance, internet, grounds and structure maintenance, sewer, trash and water; Community amenities include beach access; non-gated community
Exterior
- Parking: Assigned parking (see remarks)
- Utilities: Electricity connected (110V and 220V)
- Home design: Single-story; Resale property
- Construction: Block and concrete construction; Composition shingle roof
- Exterior features: Balcony; Covered and open patio
Interior
- Kitchen: Dishwasher; Electric range; Disposal; Microwave
- Bedrooms: 2 possible bedrooms
- Flooring: Ceramic tile
- Bathrooms: 2 full bathrooms; 1 half bathroom
- Heating & cooling: Central heating; Central air conditioning
- Interior features: Unfurnished; Ceramic tile flooring; Has view
- Laundry & utility: Washer; Dryer
Neighborhood map
What this means for you Summary
Snapshot
- This is a 1-bed/1.0-bath condo listed at $450k.
Deal economics
- At list price, monthly cash flow is $-2k ($-24k/yr) — negative.
- To cash-flow at today's rent, offer at most $106k (76.4% below list).
- To meet the 1% rule (rent ≥ 1% of price), the offer needs to be $233k (48.3% below list).
- Recommended offer: $106k (76.4% below list) — sets the bar for cash-flow.
- Cap rate 1.1% vs local median 0.7% in Sewall's Point — top-decile yield for the area; either an underpriced asset or a hidden risk that comps aren't pricing in. Stress-test before assuming the spread holds.
Location & tenants
- Location reads: area grade D — affects rentability + tenant quality, not the cash-flow math above.
- Martin (suburban): math 52% / reading 53% proficiency, ranked #24 of 73 in FL (top 33%) — acceptable for families but not a draw, mixed tenant base, ~2y average lease.
- Market conditions: 251 active listings in the ZIP; 38 comparable units currently listed for rent nearby; rentals at typical pace (median 23d on market — plan ~3-4 weeks tenant-placement turnaround); solid renter incomes; 737 units permitted in Martin County in 2024 (167 in 5+ unit buildings).
- This rent runs 33% of the median local income ($84k/yr) — at the standard rent-burdened threshold; future hikes will face affordability resistance.
Forward outlook
- In year one you build about $48k of equity ($3k loan paydown + $45k appreciation (10.0% local appreciation)).
- Martin County population projected at +19% by 2050 — long-run rental-demand tailwind backs the buy-and-hold thesis.
- By year 2, paydown + projected appreciation supports a ~$77k cash-out refi (75% LTV) — recoverable capital for the next deal without selling this one.
Negotiation context
- It's been on market 34 days — a 3% lower offer ($436k) is reasonable based on typical stale-listing flexibility.
- Current owner paid $283k; list at $450k implies a 59% gain — meaningful room to come down on a strong offer.
Risks & watch-outs
- Watch-outs: flood insurance adds $66/mo; HOA is 34% of rent.
- Climate carrying-cost: severe flood risk; severe wind risk, 99% chance of damaging wind over 30y; extreme-heat days projected 7→26/yr by 2055 (HVAC capex compounding) — expect insurance premiums to compound above CPI over the hold.
Questions for the listing agent
- What do current leases actually rent for vs. the listed asking? Can we see a recent rent roll and the last 12 months of T-12 income?
- It's been on market 34 days. Have you received any prior offers? Is the seller open to a 76% concession, seller financing, or rate buy-down credit?
- What's the actual annual flood-insurance premium (NFIP or private), and is the property in a SFHA with mandatory coverage?
- What does the HOA fee cover, when was the last increase, and are there any pending special assessments or reserve-fund shortfalls?
- Any open or pending special assessments — roof, HVAC, plumbing, elevator, façade? What's the per-unit balance and payoff schedule, and is the seller paying it off at close or rolling it to the buyer?
- Is there a deadline driving the sale (1031 exchange, divorce, estate, relocation)? That informs how much negotiation room exists.
- The area grade is low — what's the realistic commute time and amenity access for the typical tenant pool here? Any planned neighborhood developments (good or bad) we should know about?
- This sits on a lake — are riparian / water-frontage rights deeded with the parcel? Any dock permits, shoreline easements, or HOA water-use restrictions?
- What's the documented flood / surge / shoreline-erosion history here (FEMA AND non-FEMA — e.g., storm surge, creek backup, septic-field saturation)?
- Any water-quality or seasonal algae-bloom issues that affect tenant satisfaction or short-term-rental demand?
- What's the average days-on-market for RENTAL listings here right now (not sales)? A rising rental-DOM trend means longer vacancies and softer asking-rent achievability than the comps imply.
- What's the recent tenant-quality profile in this submarket — average credit score on applications, eviction rate, late-payment / NSF rate, and stable-employment percentage? A property-management company in the area should have these aggregated.
- How much new apartment / multifamily construction is in the pipeline within 1–3 miles? Heavy new supply (>2% of stock underway) typically softens rents 12–24 months out; light construction supports rent growth.
Investment metrics
- 1% rule
- 0.52% ✗
- Cap rate
- 1.09%
- Cash-on-cash
- -18.58%
- DSCR
- 0.17
- GRM
- 16.1
CMA / ARV
- ARV (median comp)
- $592,247
- List price
- $450,000
- Delta
- -24.02%
- Verdict
- UNDERPRICED
- Comps
- 20 within 1.0 mi
Projected returns pro-forma
10.0% appreciation · 3.0% rent growth · sell at horizon
- IRR
- 11.1%
- Equity multiple
- 1.93×
- Total profit
- $117,103
- Equity at exit
- $405,396
- IRR
- 12.1%
- Equity multiple
- 4.55×
- Total profit
- $446,862
- Equity at exit
- $874,251
Cash invested: $126,000 (down + closing). Projections, not guarantees.
Landlord ↔ Tenant lean methodology
- Overall (STATE)
- 87 Strongly Landlord-Friendly
- State Florida
- 87 Strongly Landlord-Friendly · R+3
- County
- — inherits STATE
- City
- — inherits STATE
ZIP-level market 34996
- Home prices YoY
- 2.1%
- Active inventory
- 251
- Price-to-rent
- 16.1×
Monthly cashflow live
- Estimated rent
- $2,329 medium interval (Pro) →
- Mortgage (P&I)
- −$2,360
- Tax from tax record
- −$443 /mo · $5,316/yr
- Insurance
- −$188
- Flood insurance flood zone
- −$66 /mo · $798/yr
- HOA
- −$800
- Vacancy / Maint / Mgmt
- −$489
- Net cashflow
- $-2,017
Break-even live
UW: 25.0% down · 7.5% · 30yr · 1.5% tax · 5.0% vac · 8.0% maint · 8.0% mgmt
Financing live
Cash to close
- Down payment
- $112,500
- Closing costs
- $13,500
- Reserves months
- —
- Total cash needed
- —
Loan-product check · same deal, 3 products live
Conventional
25% down · 7.5% · 30yr
- Down + closing
- —
- Monthly P&I
- —
- Monthly cashflow
- —
- DSCR
- —
- Eligible?
- —
Personal DTI + credit; lowest rate.
DSCR
20% down · 8.5% · 30yr
- Down + closing
- —
- Monthly P&I
- —
- Monthly cashflow
- —
- DSCR
- —
- Eligible?
- —
No personal income docs; deal must DSCR.
Hard money
10% down · 12.0% · 12mo
- Down + closing
- —
- Monthly P&I
- —
- Monthly cashflow
- —
- DSCR
- —
- Eligible?
- —
Short-term bridge; refi at stabilization.
Rent comps 38 comps
| Address | Beds | Baths | Sqft | Rent | $/sqft | DOM | Units | Dist |
|---|---|---|---|---|---|---|---|---|
| 5564 NE Gulfstream Way Stuart, FL | 2.0 | 2.0 | 1100 | $5,000 | $4.55 | 23d | 1 | 0.03mi |
| 391 NE Plantation Rd #226 Stuart, FL | 2.0 | 2.0 | 1300 | $4,500 | $3.46 | 23d | 1 | 0.17mi |
| 391 NE Plantation Rd #228 Stuart, FL | 2.0 | 2.0 | 1274 | $2,200 | $1.73 | 23d | 1 | 0.17mi |
| 391 NE Plantation Rd #215 Stuart, FL | 2.0 | 2.0 | 1253 | $4,000 | $3.19 | 23d | 1 | 0.17mi |
| 484 NE Plantation Rd #4108 Stuart, FL | 2.0 | 2.0 | 1000 | $5,500 | $5.50 | 23d | 1 | 0.18mi |
| 484 NE Plantation Rd #4103 Stuart, FL | 2.0 | 2.0 | 971 | $6,000 | $6.18 | 23d | 1 | 0.18mi |
| 311 NE Golfview Cir Stuart, FL | 2.0 | 2.0 | 961 | $3,500 | $3.64 | 23d | 1 | 0.21mi |
| 669 NE Plantation Rd Stuart, FL | 2.0 | 2.0 | 1400 | $8,250 | $5.89 | 23d | 2 | 0.22mi |
| 411 NE Plantation Rd #526 Stuart, FL | 2.0 | 2.0 | 1274 | $6,000 | $4.71 | 23d | 1 | 0.22mi |
| 411 NE Plantation Rd #511 Stuart, FL | 2.0 | 2.0 | 1253 | $7,500 | $5.99 | 23d | 1 | 0.22mi |
| 221 NE Plantation Rd Stuart, FL | 2.0 | 2.0 | 1296 | $4,350 | $3.36 | 23d | 3 | 0.30mi |
| 185 NE Edgewater Dr #5105 Stuart, FL | 2.0 | 2.0 | 1366 | $6,500 | $4.76 | 23d | 1 | 0.31mi |
| 233 NE Edgewater Dr Stuart, FL | 2.0–3.0 | 2.0–3.0 | 1534 | $2,200 | $1.43 | 23d | 3 | 0.31mi |
| 40 NE Plantation Rd #209 Stuart, FL | 2.0 | 2.0 | 1039 | $6,000 | $5.77 | 23d | 1 | 0.33mi |
| 40 NE Plantation Rd #410 Stuart, FL | 2.0 | 2.0 | 1039 | $5,200 | $5.00 | 23d | 1 | 0.33mi |
| 40 NE Plantation Rd #208 Stuart, FL | 2.0 | 2.0 | 1039 | $5,100 | $4.91 | 23d | 1 | 0.33mi |
| 40 NE Plantation Rd #304 Stuart, FL | 2.0 | 2.0 | 1039 | $2,700 | $2.60 | 23d | 1 | 0.33mi |
| 40 NE Plantation Rd #203 Stuart, FL | 2.0 | 2.0 | 1039 | $5,900 | $5.68 | 13d | 1 | 0.33mi |
| 40 NE Plantation Rd #110 Stuart, FL | 2.0 | 2.0 | 1039 | $6,500 | $6.26 | 23d | 1 | 0.33mi |
| 40 NE Plantation Rd #309 Stuart, FL | 2.0 | 2.0 | 1039 | $1,800 | $1.73 | 23d | 1 | 0.33mi |
| 350 NE Edgewater Dr #202 Stuart, FL | 2.0 | 2.0 | 970 | $2,500 | $2.58 | 23d | 1 | 0.33mi |
| 264 NE Edgewater Dr #102 Stuart, FL | 1.0 | 1.0 | 911 | $2,100 | $2.31 | 23d | 1 | 0.35mi |
| 20 NE Plantation Rd #205 Stuart, FL | 2.0 | 2.0 | 1306 | $2,900 | $2.22 | 23d | 1 | 0.38mi |
| 20 NE Plantation Rd #306 Stuart, FL | 2.0 | 2.0 | 1306 | $3,500 | $2.68 | 23d | 1 | 0.38mi |
| 5799 NE Island Cove Way Unit 1546190P Stuart, FL | 2.0 | 2.0 | 1270 | $2,029 | $1.60 | 13d | 1 | 0.40mi |
| 5750 NE Island Cove Way #3302 Stuart, FL | 2.0 | 2.0 | 1204 | $2,450 | $2.03 | 13d | 1 | 0.40mi |
| 5800 NE Island Cove Way #2207 Stuart, FL | 2.0 | 2.0 | 1204 | $3,500 | $2.91 | 23d | 1 | 0.41mi |
| 245 NE MacArthur Blvd Stuart, FL | 2.0 | 2.5 | 1310 | $7,750 | $5.92 | 23d | 2 | 0.41mi |
| 1289 NE Ocean Blvd Stuart, FL | 2.0 | 2.0 | 1234 | $5,700 | $4.62 | 21d | 5 | 0.67mi |
| 1357 NE Ocean Blvd Stuart, FL | 2.0 | 2.0 | 1204 | $5,250 | $4.36 | 21d | 2 | 0.76mi |
| 1357 NE Ocean Blvd #312 Stuart, FL | 2.0 | 2.0 | 1242 | $5,500 | $4.43 | 23d | 1 | 0.77mi |
| 1501 NE Ocean Blvd #2 Stuart, FL | 2.0 | 1.5 | 925 | $4,300 | $4.65 | 23d | 1 | 0.86mi |
| 1550 NE Ocean Blvd Stuart, FL | 2.0 | 2.0 | 1101 | $2,125 | $1.93 | 23d | 2 | 1.08mi |
| 2051 NE Ocean Blvd Unit C13 Stuart, FL | 2.0 | 2.0 | 1545 | $4,000 | $2.59 | 13d | 1 | 1.40mi |
| 2051 NE Ocean Blvd Stuart, FL | 2.0 | 2.0 | 1545 | $3,250 | $2.10 | 23d | 2 | 1.40mi |
| 2355 NE Ocean Blvd Unit 1-19B Stuart, FL | 2.0 | 2.0 | 1197 | $6,200 | $5.18 | 23d | 1 | 1.49mi |
| 2355 NE Ocean Blvd Unit 1-7A Stuart, FL | 1.0 | 1.0 | 937 | $3,800 | $4.06 | 23d | 1 | 1.49mi |
| 2355 NE Ocean Blvd Unit 1-20A Stuart, FL | 1.0 | 1.0 | 937 | $2,900 | $3.09 | 23d | 1 | 1.49mi |
HOA detail condo
- Monthly dues
- $800 · $9,600/yr
- Assessments
- None detected in remarks — confirm with the listing agent.
Listing history 18 events
-
2026-06-18days on market $450,000 Active 34 DOM
-
2026-06-17days on market $450,000 Active 33 DOM
-
2026-06-16days on market $450,000 Active 32 DOM
-
2026-06-15days on market $450,000 Active 31 DOM
-
2026-06-14days on market $450,000 Active 29 DOM
-
2026-06-13days on market $450,000 Active 28 DOM
-
2026-06-10days on market $450,000 Active 26 DOM
-
2026-06-09days on market $450,000 Active 25 DOM
-
2026-06-08days on market $450,000 Active 24 DOM
-
2026-06-07days on market $450,000 Active 23 DOM
-
2026-06-03days on market $450,000 Active 19 DOM
-
2026-06-02days on market $450,000 Active 18 DOM
-
2026-06-01days on market $450,000 Active 17 DOM
-
2026-05-31days on market $450,000 Active 16 DOM
-
2026-05-31days on market $450,000 Active 15 DOM
-
2026-05-15$450,000 Active 1261-char remark
-
2003-11-19soldstatus $283,000
-
1980-09-01soldstatus $151,800
ⓘ Source: listings_history table (triggers on properties + properties_extension) + one-shot
backfill from property_details.listing_events for pre-trigger history.
Tax reassessment forecast FL · Resets to sale price
- Current annual tax
- $5,316 · $443/mo
- Projected year-2 tax
- $5,316 · $443/mo
- Expected delta
- $0/yr ($0/mo · 0.0%)
ⓘ Screening estimate from a state-policy table — verify with the county assessor before closing.
Climate risk First Street
- Flood 10/10 Extreme FEMA zone X (shaded) · 99% chance over 30 yrs
- Wildfire 2/10 Low
- Heat 10/10 Extreme 7 d/yr ≥106°F today · 26 d/yr by 30 yrs out
- Wind 10/10 Extreme 99% chance of damaging wind over 30 yrs
- Air quality 2/10 Low 2 unhealthy d/yr today · 2 by 30 yrs out
Nearby sold comps map
Loading sold comps map…
Walkable amenities ~0.75 mi
Loading nearby amenities…
Taxation est. · year 1
- Rental income
- $27,944
- − Mortgage interest
- −$25,207
- − Property taxes
- −$5,316
- − Insurance
- −$3,048
- − Repairs & maintenance
- −$2,236
- − Management
- −$2,236
- − HOA
- −$9,600
- − Depreciation
- −$13,091
- Taxable loss
- −$32,788
- Est. tax savings @ 24.0%
- +$7,869
- After-tax cash flow
- $-16,337/yr
For passive investors: Depreciation is non-cash, so a rental often shows a tax loss while cash-flowing — sheltering income. Rental losses are passive: they offset passive income freely, and up to $25,000/yr can offset ordinary (W-2) income if you actively participate and your MAGI is under $100k (phasing out to $0 by $150k); unused losses carry forward. On sale, claimed depreciation is recaptured at up to 25%, and gains may owe capital-gains tax (a 1031 exchange can defer both). Figures are a year-1 estimate at your 24.0% rate — not tax advice; consult a CPA.
Schools (NCES district)
- District
- Martin
- NCES district ID
- 1201290
- Math proficiency
- 52% ▼ -14.00%
- Reading proficiency
- 53% ▼ -4.00%
- Median HH income
- $52,482
- Composite
- 45.1/100
- National rank
- #2690
- State rank
- #24 of 73 in FL
Livability — Sewall's Point
No livability data for this city. (Only ~50 U.S. cities are tracked.)
Census & demographics
- County
- Martin County · 165,223 people
- City population
- 10,875
- Metro
- Port St. Lucie, FL
- Population (ZIP)
- 10,653
- Household income
- $83,929
- Rent vs Own
- Severe rent burden
- 247.0
Population outlook (Martin County) Hauer SSP2
- Today (2025)
- 172,383 people
- By 2030
- 180,192 · +4.5%
- By 2040
- 194,114 · +12.6%
- By 2050
- 204,992 · +18.9%
- By 2075
- 229,641 · +33.2%
- By 2100
- 232,146 · +34.7%
Race, ethnicity, and origin ACS 2023
- Neighborhood character
- Predominantly White (90%)
- Race & ethnicity
- White 90% Hispanic / Latino 7% Two or more races 5%
- Hispanic origin (detail)
- Puerto Rican 2%
- Common ancestry
- Italian 3% Romanian 3% Slovak 3%
- Foreign-born
- 6% · Canada
- Languages at home
- 94% English-only · Spanish 3% Other Indo-European 1% French/Haitian/Cajun 1%
Political lean MEDSL · Martin
- 2024 margin
- Solid R (+31.1) · D 34.1% · R 65.2%
- 2008→2024 swing
- -17.5pp toward R · 2008: -13.6pp · 2024: -31.1pp
- All cycles
- 2024: R+31.1 2020: R+24.6 2016: R+26.9 2012: R+22.9 2008: R+13.6
Not yet ingested
- Civics
- —
Market trends
- HPI YoY
- ▲ 13.71%
- Current HPI
- 658.96
- Rent YoY
- —
- Metro
- Port St. Lucie, FL
- State GDP YoY
- ▲ 3.28%
- F500 in state
- 36
Industry mix (Fortune 500 HQ in FL)
| Industry | F500 HQs | Revenue |
|---|---|---|
| Industrial Technology | 2 | $29B |
|
||
| Insurance | 2 | $17B |
|
||
| Retail | 1 | $60B |
|
||
| Technology Distribution | 1 | $58B |
|
||
| Homebuilding | 1 | $35B |
|
||
| Technology Manufacturing | 1 | $35B |
|
||
Price history
+196.4% since first listed3 events — show timeline
- 2026-05-15 Listed $450,000 MCRTC
- 2003-11-19 Sold (Public Records) $283,000 Public Records
- 1980-09-01 Sold (Public Records) $151,800 Public Records
Property tax history
+36.2%/yrLatest (2025): $5,316 · +6200.6% YoY. Source: county tax records.
Cash-flow waterfall
monthlySold comps — $/sqft
last 12 mo · ≤1 miLoading sold comps…