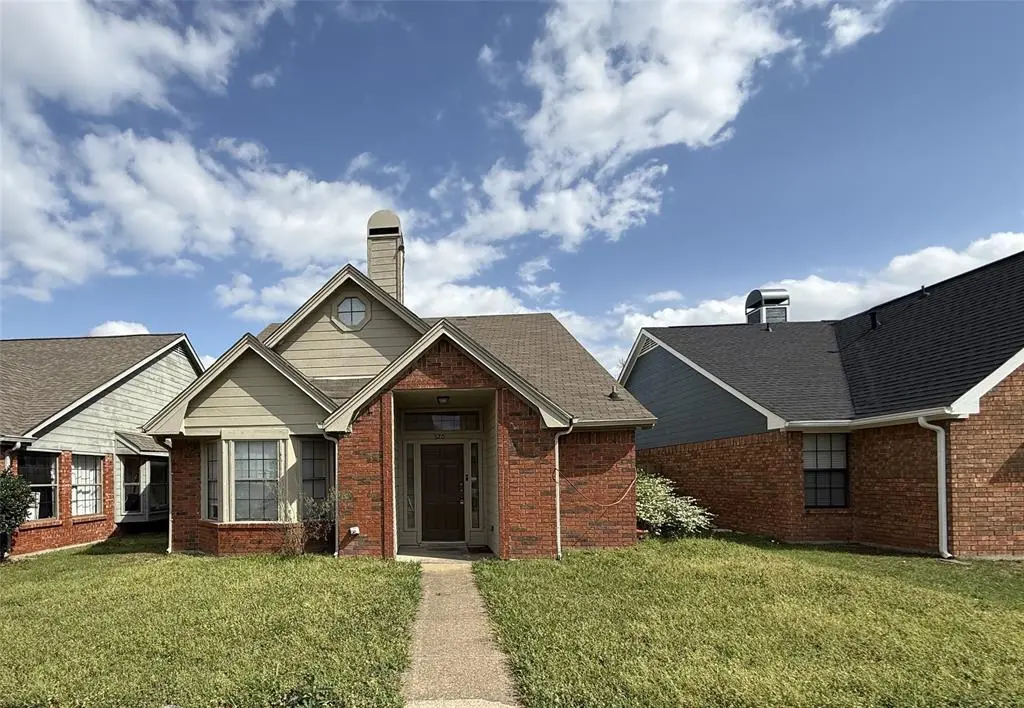
520 Lookout Mountain Trl · Mesquite, TX
Flood risk 1/10 · Minimal
- FEMA flood zone
- X (unshaded)
- Chance of flooding over 30 yrs
- 0.0%
- Est. flood insurance / yr
- $507 – $1,088
Fire risk 3/10 · Minor
- Est. fire insurance / yr
- $1,222 – $2,270
Heat risk 8/10 · Major
- Hot days now (above 110°F)
- 7 days/yr
- Hot days in 30 yrs
- 25 days/yr
Wind risk 6/10 · Moderate
- Chance of severe wind over 30 yrs
- 27.0%
Air-quality risk 2/10 · Minimal
- Unhealthy air days now
- 1 days/yr
- Unhealthy air days in 30 yrs
- 2 days/yr
Risk factors via First Street. Map © Google.
Why this score? — see what drove the D+ grade
The composite is a weighted blend of 9 inputs, each scored 0–100. Each bar is that input's sub-score; the figure is the points it added to the 100-point composite (weight × sub-score).
- ARV discount +15.0/15.0
- Cash flow +13.0/30.0
- 1% rule +4.7/10.0
- DSCR +3.9/10.0
- Livability +3.5/5.0
- Schools +2.9/10.0
- Rent growth +2.6/5.0
- Condition / age +2.5/5.0
- Appreciation +0.0/10.0
$210,000
🖨 Deal sheet 📄 Offer letter ✓ Due diligence
Listing remarks MLS
Hud home to be sold 'as-is'. Bid deadline: 03-26-06. Case#491-729214.
Key facts
- Repair needs
- Strong rental demand
- Value-add asset
Tags
Property features AI
Finance
- Financial info: Listing accepted offers and supports multiple financing types (Cash, Conventional, FHA, VA, Texas Vet, 1031 Exchange)
- HOA & community: No homeowners association
Exterior
- Parking: Attached garage; 2 covered parking spaces; 2-car garage (approximately 18' wide x 20' deep, 8' height)
- Utilities: City water; City sewer; Electricity connected; Individual gas meter (separate meter)
- Home design: Single family residence; Two-story; Built in 1986; Not attached to other properties
- Construction: Brick construction; Shingle roof; Slab foundation
- Exterior features: Lot smaller than 0.5 acre; Subdivision: East Glen Ph 02
Interior
- Kitchen: Electric range
- Bedrooms: 3 bedrooms total; Primary bedroom on main level with ensuite bath; Two additional bedrooms on second level
- Flooring: Varied flooring
- Bathrooms: 2 full bathrooms; 1 half bathroom
- Heating & cooling: Electric cooling; Natural gas heating
- Interior features: Vaulted ceilings; One living area; One dining area; Room count: 5
- Laundry & utility: Individual gas meter
Neighborhood map
What this means for you Summary
Snapshot
- This is a 3-bed/2.5-bath single-family listed at $210k.
Deal economics
- At list price, monthly cash flow is $-12 ($-139/yr) — negative.
- To cash-flow at today's rent, offer at most $208k (1.0% below list).
- To meet the 1% rule (rent ≥ 1% of price), the offer needs to be $205k (2.6% below list).
- Recommended offer: $204k (3.0% below list) — sets the bar for market timing.
- Cap rate 6.2% vs local median 4.4% in Mesquite — top-decile yield for the area; either an underpriced asset or a hidden risk that comps aren't pricing in. Stress-test before assuming the spread holds.
Location & tenants
- Location reads 70/100 on livability (#358 in TX) — a middle-class / working-renter tenant base. Strengths: cost of living A+, housing A+, health & safety A-; Watch: crime F, commute F.
- Mesquite ISD (suburban): math 35% / reading 32% proficiency, ranked #536 of 826 in TX (top 65%) — families likely to look elsewhere, expect single-tenant / working-renter base with shorter leases; 63% free/reduced lunch — lower-income household profile, screen leases tightly.
- Zoned schools: Rutherford El (math 38% / reading 41%, grade F, #1,545 of 4,322 statewide, top 38%, 729 students, 78% FRL) — zoned schools average 78% FRL vs 63% district-wide (15 pts higher); higher-poverty schools than district average — tighter screening recommended.
- Market conditions: Rents flat; 340 active listings in the ZIP; 38 comparable units currently listed for rent nearby; rentals at typical pace (median 21d on market — plan ~3-4 weeks tenant-placement turnaround); 12,577 units permitted in Dallas County in 2024 (6,829 in 5+ unit buildings).
- This rent runs 35% of the median local income ($71k/yr) — at the standard rent-burdened threshold; future hikes will face affordability resistance.
Forward outlook
- Local home prices are declining (-3.0%/yr); year-one equity from $1k of loan paydown is wiped out by about $6k of value loss. Plan a longer hold.
- Dallas County population projected at +35% by 2050 — long-run rental-demand tailwind backs the buy-and-hold thesis.
Negotiation context
- It's been on market 42 days — a 3% lower offer ($204k) is reasonable based on typical stale-listing flexibility.
- 3 sale attempts since 20y ago with the ask held roughly flat each time — persistent listings suggest the price (not the market) is what's stuck; bring a comps-based counter.
Risks & watch-outs
- Watch-outs: property tax is 2.5% of price.
- Climate carrying-cost: major wind risk, 27% chance of damaging wind over 30y; extreme-heat days projected 7→25/yr by 2055 (HVAC capex compounding) — expect insurance premiums to compound above CPI over the hold.
Questions for the listing agent
- What do current leases actually rent for vs. the listed asking? Can we see a recent rent roll and the last 12 months of T-12 income?
- It's been on market 42 days. Have you received any prior offers? Is the seller open to a 3% concession, seller financing, or rate buy-down credit?
- Property tax is high relative to price — has the assessment been appealed recently, and will the sale trigger a re-assessment?
- Is there a deadline driving the sale (1031 exchange, divorce, estate, relocation)? That informs how much negotiation room exists.
- Crime grade is F in this area — have there been break-ins, vandalism, or insurance claims at this property in the last 3 years? What carrier currently insures it and at what premium?
- The area grade is low — what's the realistic commute time and amenity access for the typical tenant pool here? Any planned neighborhood developments (good or bad) we should know about?
- What's the average days-on-market for RENTAL listings here right now (not sales)? A rising rental-DOM trend means longer vacancies and softer asking-rent achievability than the comps imply.
- What's the recent tenant-quality profile in this submarket — average credit score on applications, eviction rate, late-payment / NSF rate, and stable-employment percentage? A property-management company in the area should have these aggregated.
- How much new for-sale + rental construction is in the pipeline within 1–3 miles? Heavy new supply typically softens prices + rents 12–24 months out; constrained supply supports both.
Investment metrics
- 1% rule
- 0.97% ✗
- Cap rate
- 6.23%
- Cash-on-cash
- -0.24%
- DSCR
- 0.99
- GRM
- 8.6
CMA / ARV
- ARV (on-the-fly)
- $275,220
- Comps found
- 12
Show comp detail 12 sales within ~0.75 mi
| Address | Dist | Beds/Ba | Sqft | Sold | Price | $/sf | Match |
|---|---|---|---|---|---|---|---|
| 520 Lookout Mountain Trl | 0.00mi | 3/2.5 | 1,529 (0%) | 1mo | $210,000 | $137 | 99 |
| 1923 Shoreline Dr | 0.17mi | 3/2.0 | 1,632 (+7%) | 3mo | $299,000 | $183 | 77 |
| 414 Chancellorsville Dr | 0.11mi | 3/2.0 | 1,389 (-9%) | 3mo | $262,900 | $189 | 75 |
| 514 Appomattox Dr | 0.23mi | 3/2.0 | 1,440 (-6%) | 3mo | $275,000 | $191 | 75 |
| 532 Lookout Mountain Trl | 0.02mi | 4/2.5 (+1) | 1,730 (+13%) | 2mo | $199,900 | $116 | 70 |
| 438 Appomattox Dr | 0.22mi | 3/2.0 | 1,353 (-12%) | 0mo | $269,800 | $199 | 68 |
| 413 Horse Shoe Bnd | 0.41mi | 3/2.0 | 1,440 (-6%) | 4mo | $249,999 | $174 | 66 |
| 702 Coolwood Ln | 0.24mi | 3/2.0 | 1,345 (-12%) | 4mo | $280,875 | $209 | 64 |
| 422 Paldao Dr | 0.67mi | 3/2.0 | 1,431 (-6%) | 2mo | $246,300 | $172 | 55 |
| 2321 Baretta Dr | 0.61mi | 3/2.0 | 1,406 (-8%) | 5mo | $243,500 | $173 | 52 |
| 533 Horse Shoe Bnd | 0.44mi | 3/2.0 | 1,750 (+14%) | 2mo | $210,000 | $120 | 52 |
| 426 Paldao Dr | 0.68mi | 3/2.0 | 1,389 (-9%) | 3mo | $249,999 | $180 | 49 |
Match score weights: distance 35% · size 25% · config 20% · recency 20%. Top-matched comps best support the ARV.
Projected returns pro-forma
-3.0% appreciation · 0.22% rent growth · sell at horizon
- IRR
- -20.2%
- Equity multiple
- 0.32×
- Total profit
- $-40,195
- Equity at exit
- $31,312
- IRR
- -22.0%
- Equity multiple
- 0.03×
- Total profit
- $-56,992
- Equity at exit
- $18,157
Cash invested: $58,800 (down + closing). Projections, not guarantees.
Landlord ↔ Tenant lean methodology
- Overall (STATE)
- 87 Strongly Landlord-Friendly
- State Texas
- 87 Strongly Landlord-Friendly · R+5
- County
- — inherits STATE
- City
- — inherits STATE
ZIP-level market 75149
- Home prices YoY
- -27.4%
- Rents YoY
- 0.2%
- Active inventory
- 340
- Price-to-rent
- 8.6×
Monthly cashflow live
- Estimated rent
- $2,045 high interval (Pro) →
- Mortgage (P&I)
- −$1,101
- Tax from tax record
- −$438 /mo · $5,262/yr
- Insurance
- −$88
- HOA
- −$0
- Vacancy / Maint / Mgmt
- −$429
- Net cashflow
- $-12
Break-even live
UW: 25.0% down · 7.5% · 30yr · 1.5% tax · 5.0% vac · 8.0% maint · 8.0% mgmt
Financing live
Cash to close
- Down payment
- $52,500
- Closing costs
- $6,300
- Reserves months
- —
- Total cash needed
- —
Loan-product check · same deal, 3 products live
Conventional
25% down · 7.5% · 30yr
- Down + closing
- —
- Monthly P&I
- —
- Monthly cashflow
- —
- DSCR
- —
- Eligible?
- —
Personal DTI + credit; lowest rate.
DSCR
20% down · 8.5% · 30yr
- Down + closing
- —
- Monthly P&I
- —
- Monthly cashflow
- —
- DSCR
- —
- Eligible?
- —
No personal income docs; deal must DSCR.
Hard money
10% down · 12.0% · 12mo
- Down + closing
- —
- Monthly P&I
- —
- Monthly cashflow
- —
- DSCR
- —
- Eligible?
- —
Short-term bridge; refi at stabilization.
Rent comps 38 comps
| Address | Beds | Baths | Sqft | Rent | $/sqft | DOM | Units | Dist |
|---|---|---|---|---|---|---|---|---|
| 505 Picketts Dr Mesquite, TX | 3.0 | 2.0 | 1406 | $1,950 | $1.39 | 43d | 1 | 0.07mi |
| 608 Coolwood Ln Mesquite, TX | 3.0 | 2.0 | 1272 | $1,900 | $1.49 | 43d | 1 | 0.20mi |
| 612 Coolwood Ln Mesquite, TX | 3.0 | 2.0 | 1433 | $1,746 | $1.22 | 43d | 1 | 0.21mi |
| 450 Appomattox Dr Mesquite, TX | 3.0 | 2.0 | 1567 | $1,930 | $1.23 | 43d | 1 | 0.25mi |
| 1617 Savannah St Mesquite, TX | 3.0 | 2.0 | 1306 | $1,985 | $1.52 | 5d | 1 | 0.35mi |
| 1601 Chapman Dr Mesquite, TX | 3.0 | 2.0 | 1306 | $1,845 | $1.41 | 12d | 1 | 0.38mi |
| 711 Darnel Dr Mesquite, TX | 4.0 | 2.0 | 1370 | $1,939 | $1.42 | 7d | 1 | 0.41mi |
| 1424 Savannah St Mesquite, TX | 3.0 | 2.0 | 1462 | $1,959 | $1.34 | 17d | 1 | 0.46mi |
| 1601 Hillwood Dr Mesquite, TX | 3.0 | 2.0 | 1284 | $2,095 | $1.63 | 7d | 1 | 0.48mi |
| 2208 Browning Dr Mesquite, TX | 3.0 | 2.0 | 1406 | $1,955 | $1.39 | 43d | 1 | 0.62mi |
| 2345 Browning Dr Mesquite, TX | 3.0 | 2.0 | 1384 | $3,500 | $2.53 | 1d | 1 | 0.66mi |
| 2433 Baretta Dr Mesquite, TX | 3.0 | 2.0 | 1406 | $2,091 | $1.49 | 22d | 1 | 0.69mi |
| 908 Winchester Ln Mesquite, TX | 3.0 | 2.0 | 1386 | $2,049 | $1.48 | 2d | 1 | 0.72mi |
| 928 Winchester Ln Mesquite, TX | 3.0 | 2.0 | 1426 | $2,650 | $1.86 | 1d | 1 | 0.74mi |
| 1400 Paintbrush St Mesquite, TX | 3.0 | 2.5 | 1795 | $2,400 | $1.34 | 43d | 1 | 0.77mi |
| 1115 Casa Dr Mesquite, TX | 2.0 | 2.0 | 1215 | $1,850 | $1.52 | 24d | 1 | 0.78mi |
| 628 Windsong Mesquite, TX | 4.0 | 2.5 | 2248 | $2,600 | $1.16 | 17d | 1 | 0.84mi |
| 1217 Buckeye Dr Mesquite, TX | 3.0 | 2.0 | 1735 | $1,995 | $1.15 | 22d | 1 | 0.89mi |
| 1217 Buckeye Dr Mesquite, TX | 3.0 | 2.0 | 1735 | $1,995 | $1.15 | 43d | 1 | 0.89mi |
| 334 Freeman St Mesquite, TX | 3.0 | 2.0 | 1330 | $2,180 | $1.64 | 7d | 1 | 1.01mi |
| 1104 Ashland Dr Mesquite, TX | 3.0 | 1.0 | 1250 | $1,625 | $1.30 | 7d | 1 | 1.11mi |
| 1729 Hazer Ln Mesquite, TX | 3.0 | 2.0 | 1498 | $2,400 | $1.60 | 20d | 1 | 1.14mi |
| 1416 Hackamore St Mesquite, TX | 3.0 | 2.0 | 1500 | $2,200 | $1.47 | 2d | 1 | 1.14mi |
| 1409 Hackamore St Mesquite, TX | 3.0 | 2.5 | 1360 | $1,965 | $1.44 | 12d | 1 | 1.18mi |
| 1809 Osage Trl Mesquite, TX | 4.0 | 2.0 | 2022 | $2,599 | $1.29 | 17d | 1 | 1.19mi |
| 1512 Wheatfield Dr Mesquite, TX | 3.0 | 2.0 | 1406 | $2,000 | $1.42 | 7d | 1 | 1.22mi |
| 2621 Ash Crk Mesquite, TX | 3.0 | 2.0 | 1843 | $2,299 | $1.25 | 43d | 1 | 1.22mi |
| 1436 Wheatfield Dr Mesquite, TX | 3.0 | 2.0 | 1317 | $2,180 | $1.66 | 43d | 1 | 1.25mi |
| 1101 La Esperanza Dr Mesquite, TX | 3.0 | 2.0 | 1697 | $2,700 | $1.59 | 1d | 1 | 1.27mi |
| 1330 Planters Rd Mesquite, TX | 3.0 | 2.0 | 1707 | $2,095 | $1.23 | 19d | 1 | 1.28mi |
| 1330 Planters Rd Mesquite, TX | 3.0 | 2.5 | 1707 | $2,095 | $1.23 | 12d | 1 | 1.28mi |
| 1128 Catalan Trl Mesquite, TX | 3.0 | 2.5 | 1600 | $2,300 | $1.44 | 43d | 1 | 1.29mi |
| 1232 Wheatfield Dr Mesquite, TX | 2.0 | 2.0 | 1204 | $1,825 | $1.52 | 24d | 1 | 1.30mi |
| 608 Robinlynn St Mesquite, TX | 4.0 | 2.0 | 1716 | $2,235 | $1.30 | 43d | 1 | 1.32mi |
| 1201 Wheatfield Dr Mesquite, TX | 2.0 | 2.0 | 1204 | $1,800 | $1.50 | 43d | 1 | 1.35mi |
| 312 E Kimbrough St Mesquite, TX | 4.0 | 2.0 | 1560 | $2,100 | $1.35 | 43d | 1 | 1.37mi |
| 1513 Colborne Dr Mesquite, TX | 3.0 | 2.0 | 1805 | $2,045 | $1.13 | 43d | 1 | 1.46mi |
| 2812 Clearmeadow Dr Mesquite, TX | 4.0 | 2.0 | 1837 | $2,800 | $1.52 | 1d | 1 | 1.49mi |
Listing history 9 events
-
2026-05-11status Pending
-
2026-04-29historical Active Option Contract
-
2026-04-24status Active
-
2026-04-14historical Active Option Contract
-
2026-03-29$210,000 Active
-
2006-04-27soldstatus 69-char remark
Show marketing remark (69 chars)
Hud home to be sold 'as-is'. Bid deadline: 03-26-06. Case#491-729214.
-
2006-03-28historical 69-char remark
Show marketing remark (69 chars)
Hud home to be sold 'as-is'. Bid deadline: 03-26-06. Case#491-729214.
-
2006-01-06$98,000 69-char remark
Show marketing remark (69 chars)
Hud home to be sold 'as-is'. Bid deadline: 03-26-06. Case#491-729214.
-
2001-08-07soldstatus
ⓘ Source: listings_history table (triggers on properties + properties_extension) + one-shot
backfill from property_details.listing_events for pre-trigger history.
Tax reassessment forecast TX · Resets to sale price
- Current annual tax
- $5,262 · $438/mo
- Projected year-2 tax
- $5,262 · $438/mo
- Expected delta
- $0/yr ($0/mo · 0.0%)
ⓘ Screening estimate from a state-policy table — verify with the county assessor before closing.
Climate risk First Street
- Flood 1/10 Low FEMA zone X (unshaded) · 0% chance over 30 yrs
- Wildfire 3/10 Moderate
- Heat 8/10 Severe 7 d/yr ≥110°F today · 25 d/yr by 30 yrs out
- Wind 6/10 Major 27% chance of damaging wind over 30 yrs
- Air quality 2/10 Low 1 unhealthy d/yr today · 2 by 30 yrs out
Nearby sold comps map
Loading sold comps map…
Walkable amenities ~0.75 mi
Loading nearby amenities…
Taxation est. · year 1
- Rental income
- $24,541
- − Mortgage interest
- −$11,763
- − Property taxes
- −$5,262
- − Insurance
- −$1,050
- − Repairs & maintenance
- −$1,963
- − Management
- −$1,963
- − Depreciation
- −$6,109
- Taxable loss
- −$3,569
- Est. tax savings @ 24.0%
- +$857
- After-tax cash flow
- $717/yr
For passive investors: Depreciation is non-cash, so a rental often shows a tax loss while cash-flowing — sheltering income. Rental losses are passive: they offset passive income freely, and up to $25,000/yr can offset ordinary (W-2) income if you actively participate and your MAGI is under $100k (phasing out to $0 by $150k); unused losses carry forward. On sale, claimed depreciation is recaptured at up to 25%, and gains may owe capital-gains tax (a 1031 exchange can defer both). Figures are a year-1 estimate at your 24.0% rate — not tax advice; consult a CPA.
Schools (NCES district)
- District
- Mesquite ISD
- NCES district ID
- 4830390
- Math proficiency
- 35% ▼ -11.00%
- Reading proficiency
- 32% ▼ -7.00%
- Median HH income
- $49,372
- Composite
- 29.06/100
- National rank
- #6606
- State rank
- #536 of 826 in TX
Livability — Mesquite
- Score
- 70/100
- State rank
- #358
- US rank
- #7743
Category grades
Schools grade is shown separately in the Schools card above.
Census & demographics
- Census place
- Mesquite, TX
- County
- Dallas County · 2,612,404 people
- City population
- 150,788
- Metro
- Dallas-Fort Worth-Arlington, TX
- Population (ZIP)
- 58,262
- Household income
- $70,774
- Rent vs Own
- Severe rent burden
- 2266.0
Population outlook (Dallas County) Hauer SSP2
- Today (2025)
- 2,979,839 people
- By 2030
- 3,191,823 · +7.1%
- By 2040
- 3,619,611 · +21.5%
- By 2050
- 4,026,915 · +35.1%
- By 2075
- 4,957,073 · +66.4%
- By 2100
- 5,508,725 · +84.9%
Race, ethnicity, and origin ACS 2023
- Neighborhood character
- Diverse neighborhood (Simpson 0.65)
- Race & ethnicity
- Hispanic / Latino 49% White 25% Two or more races 21% Black 20% Asian 2% Native American 1%
- Hispanic origin (detail)
- Mexican 42% Cuban 1%
- Common ancestry
- Italian 1% Iranian 1% Serbian 1%
- Foreign-born
- 22% · Canada, Vietnam
- Languages at home
- 58% English-only · Spanish 39% Other Asian/Pacific 1% Vietnamese 1%
Political lean MEDSL · Dallas
- 2024 margin
- Strong D (+22.2) · D 60.2% · R 38.0% · Other 1.8%
- 2008→2024 swing
- +6.9pp toward D · 2008: 15.3pp · 2024: 22.2pp
- All cycles
- 2024: D+22.2 2020: D+31.6 2016: D+26.2 2012: D+15.4 2008: D+15.3
Not yet ingested
- Civics
- —
Market trends
- HPI YoY
- ▼ -130.12%
- Current HPI
- 345.6606
- Rent YoY
- ▲ 0.22%
- Metro
- Dallas-Fort Worth-Arlington, TX
- State GDP YoY
- ▲ 3.95%
- F500 in state
- 110
Industry mix (Fortune 500 HQ in TX)
| Industry | F500 HQs | Revenue |
|---|---|---|
| Energy | 16 | $1,198B |
|
||
| Technology | 5 | $198B |
|
||
| Engineering / Construction | 4 | $72B |
|
||
| Energy Services | 3 | $60B |
|
||
| Utilities | 3 | $41B |
|
||
| Healthcare | 2 | $330B |
|
||
Price history
+114.3% since first listed9 events — show timeline
- 2026-05-11 Pending — NTREIS
- 2026-04-29 Contingent — NTREIS
- 2026-04-24 Relisted — NTREIS
- 2026-04-14 Contingent — NTREIS
- 2026-03-29 Listed $210,000 NTREIS
- 2006-04-27 Sold (MLS) — NTREIS
- 2006-03-28 Listing Removed — NTREIS
- 2006-01-06 Listed $98,000 NTREIS
- 2001-08-07 Sold (Public Records) — Public Records
Property tax history
+6.7%/yrLatest (2025): $5,262 · +1.1% YoY. Source: county tax records.
Cash-flow waterfall
monthlySold comps — $/sqft
last 12 mo · ≤1 miLoading sold comps…