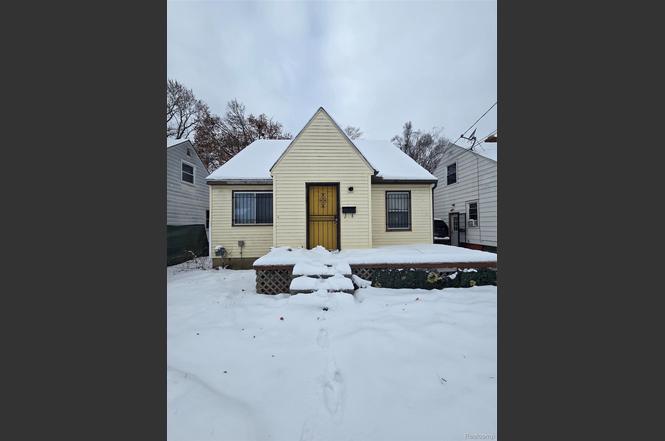
3505 Leerda St · Flint, MI
Flood risk 1/10 · Minimal
- FEMA flood zone
- X (unshaded)
- Chance of flooding over 30 yrs
- 0.0%
- Est. flood insurance / yr
- $507 – $1,088
Fire risk 1/10 · Minimal
- Est. fire insurance / yr
- $784 – $1,456
Heat risk 2/10 · Minimal
- Hot days now (above 96°F)
- 7 days/yr
- Hot days in 30 yrs
- 15 days/yr
Wind risk 2/10 · Minimal
- Chance of severe wind over 30 yrs
- —
Air-quality risk 3/10 · Minor
- Unhealthy air days now
- 3 days/yr
- Unhealthy air days in 30 yrs
- 4 days/yr
Risk factors via First Street. Map © Google.
Why this score? — see what drove the D grade
The composite is a weighted blend of 9 inputs, each scored 0–100. Each bar is that input's sub-score; the figure is the points it added to the 100-point composite (weight × sub-score).
- Cash flow +15.0/30.0
- ARV discount +7.5/15.0
- 1% rule +5.0/10.0
- DSCR +5.0/10.0
- Livability +3.7/5.0
- Rent growth +2.5/5.0
- Condition / age +2.5/5.0
- Schools +1.1/10.0
- Appreciation +0.0/10.0
$14,000
🖨 Deal sheet 📄 Offer letter ✓ Due diligence
Listing remarks MLS
Fixer upper opportunity in Flint. Property needs work and is priced accordingly. This home is located on a street with multiple properties available, including additional single-family homes and a vacant lot. Properties may be purchased individually or together as a package. Discount may be considered for buyers purchasing multiple properties. Great opportunity to renovate and own multiple properties on the same street. Contact listing agent for photos and additional details. Limited photos posted.
Key facts
- 4,792 sq ft lot
- Built 1943
- Listed 161 days
Property features AI
Exterior
- Parking: No garage
- Utilities: Public water; Public sewer
- Home design: Single-family residence; Two levels; Ground-level entry with steps
- Construction: Vinyl siding; Block foundation; Home warranty included
- Exterior features: Paved road access; Lot dimensions roughly 40 x 115.68 (0.11 acre)
Interior
- Bathrooms: One full bathroom
- Heating & cooling: Forced air heating (natural gas); No cooling
- Interior features: Unfinished basement; Three total rooms
Neighborhood map
What this means for you Summary
Snapshot
- This is a 3-bed/1.0-bath single-family listed at $14k.
Deal economics
- At list price, monthly cash flow is $620 ($7k/yr) — positive.
- The deal already cash-flows at list — no discount required.
- Meets the 1% rule at list price ($907 rent vs $14k).
- Recommended offer: $12k (12.0% below list) — sets the bar for market timing.
- Cap rate 59.4% vs local median 11.5% in Flint — top-decile yield for the area; either an underpriced asset or a hidden risk that comps aren't pricing in. Stress-test before assuming the spread holds.
Location & tenants
- Location reads 74/100 on livability (#196 in MI, #4,946 nationally) — a middle-class / working-renter tenant base. Strengths: commute A+, cost of living A+, housing A+; Watch: schools F, crime F, employment F.
- Flint School District (urban): math 7% / reading 13% proficiency, ranked #714 of 760 in MI (top 94%) — low school quality limits family demand, transient renter base, plan for 1-2y turnover; 83% free/reduced lunch — lower-income household profile, screen leases tightly.
- Market conditions: 131 active listings in the ZIP; 13 comparable units currently listed for rent nearby; rentals lingering (median 44d on market — plan ~5-8 weeks vacancy on turnover, expect pricing pressure); 54% of comp listings sitting > 30 days — soft ceiling on asking rent; 419 units permitted in Genesee County in 2024 (68 in 5+ unit buildings).
Forward outlook
- Local home prices are declining (-3.0%/yr); year-one equity from $97 of loan paydown is wiped out by about $420 of value loss. Plan a longer hold.
- Genesee County population projected at -27% by 2050 — secular population decline; favor cash flow + early exit over multi-decade hold.
- At projected returns (-3.0% appreciation + 3.0% rent growth), your $4k cash investment doubles in ~1 year — after that, you're playing with house money.
Negotiation context
- It's been on market 161 days — a 12% lower offer ($12k) is reasonable based on typical stale-listing flexibility.
- 20 sale attempts since 30y ago; this cycle's ask has dropped $3k (18%) from the opening price — seller is motivated, your offer sets the floor, not the list.
Risks & watch-outs
- Watch-outs: built in 1943 — expect roof / HVAC / electrical / plumbing capex.
Questions for the listing agent
- It's been on market 161 days. Have you received any prior offers? Is the seller open to a 12% concession, seller financing, or rate buy-down credit?
- Built in 1943 — when were the roof, HVAC, electrical panel, plumbing, and water heater last replaced?
- Why hasn't it sold? Are there any deal-killer items the seller is aware of (foundation, flood, title, zoning, code violations)?
- Is there a deadline driving the sale (1031 exchange, divorce, estate, relocation)? That informs how much negotiation room exists.
- Schools are F-rated, which usually means shorter tenancies and higher turnover. Who's the typical renter profile here, and what's been the actual vacancy rate?
- Crime grade is F in this area — have there been break-ins, vandalism, or insurance claims at this property in the last 3 years? What carrier currently insures it and at what premium?
- The area grade is low — what's the realistic commute time and amenity access for the typical tenant pool here? Any planned neighborhood developments (good or bad) we should know about?
- What's the average days-on-market for RENTAL listings here right now (not sales)? A rising rental-DOM trend means longer vacancies and softer asking-rent achievability than the comps imply.
- What's the recent tenant-quality profile in this submarket — average credit score on applications, eviction rate, late-payment / NSF rate, and stable-employment percentage? A property-management company in the area should have these aggregated.
- How much new for-sale + rental construction is in the pipeline within 1–3 miles? Heavy new supply typically softens prices + rents 12–24 months out; constrained supply supports both.
Investment metrics
- 1% rule
- 6.48% ✓
- Cap rate
- 59.44%
- Cash-on-cash
- 189.80%
- DSCR
- 9.44
- GRM
- 1.3
CMA / ARV
- ARV (on-the-fly)
- $58,140
- Comps found
- 12
Show comp detail 12 sales within ~0.75 mi
| Address | Dist | Beds/Ba | Sqft | Sold | Price | $/sf | Match |
|---|---|---|---|---|---|---|---|
| 1818 Parkfront Dr | 0.13mi | 3/1.0 | 972 (-5%) | 4mo | $63,000 | $65 | 83 |
| 3419 Leerda St | 0.02mi | 3/1.0 | 938 (-8%) | 4mo | $25,500 | $27 | 82 |
| 3819 Brownell Blvd | 0.20mi | 3/1.0 | 1,137 (+12%) | 5mo | $69,900 | $61 | 67 |
| 4702 Warrington Dr | 0.72mi | 3/1.0 | 1,010 (-1%) | 3mo | $82,900 | $82 | 62 |
| 2118 Santa Barbara Dr | 0.61mi | 3/1.0 | 950 (-7%) | 5mo | $21,000 | $22 | 56 |
| 2613 Brownell Blvd | 0.50mi | 3/1.0 | 911 (-11%) | 4mo | $78,000 | $86 | 55 |
| 4310 Berger Dr | 0.58mi | 3/1.0 | 905 (-11%) | 2mo | $33,000 | $36 | 52 |
| 3143 Maywood Dr | 0.53mi | 3/1.0 | 882 (-14%) | 1mo | $35,000 | $40 | 52 |
| 1101 W Rankin St | 0.61mi | 2/1.0 (-1) | 1,100 (+8%) | 6mo | $25,000 | $23 | 48 |
| 2210 Canniff St | 0.65mi | 3/1.5 | 905 (-11%) | 1mo | $83,000 | $92 | 48 |
| 3330 Maywood Dr | 0.73mi | 3/1.0 | 1,120 (+10%) | 5mo | $14,000 | $13 | 45 |
| 2644 Clio Rd | 0.57mi | 2/1.5 (-1) | 1,150 (+13%) | 4mo | $65,000 | $57 | 42 |
Match score weights: distance 35% · size 25% · config 20% · recency 20%. Top-matched comps best support the ARV.
Projected returns pro-forma
-3.0% appreciation · 3.0% rent growth · sell at horizon
- IRR
- —
- Equity multiple
- 10.50×
- Total profit
- $37,233
- Equity at exit
- $2,087
- IRR
- —
- Equity multiple
- 22.26×
- Total profit
- $83,325
- Equity at exit
- $1,210
Cash invested: $3,920 (down + closing). Projections, not guarantees.
Landlord ↔ Tenant lean methodology
- Overall (STATE)
- 62 Landlord-Friendly
- State Michigan
- 62 Landlord-Friendly · EVEN
- County
- — inherits STATE
- City
- — inherits STATE
ZIP-level market 48504
- Active inventory
- 131
- Price-to-rent
- 1.3×
Monthly cashflow live
- Estimated rent
- $907 high interval (Pro) →
- Mortgage (P&I)
- −$73
- Tax est. 1.5%
- −$18 /mo · $210/yr
- Insurance
- −$6
- HOA
- −$0
- Vacancy / Maint / Mgmt
- −$191
- Net cashflow
- $620
Break-even live
UW: 25.0% down · 7.5% · 30yr · 1.5% tax · 5.0% vac · 8.0% maint · 8.0% mgmt
Financing live
Cash to close
- Down payment
- $3,500
- Closing costs
- $420
- Reserves months
- —
- Total cash needed
- —
Loan-product check · same deal, 3 products live
Conventional
25% down · 7.5% · 30yr
- Down + closing
- —
- Monthly P&I
- —
- Monthly cashflow
- —
- DSCR
- —
- Eligible?
- —
Personal DTI + credit; lowest rate.
DSCR
20% down · 8.5% · 30yr
- Down + closing
- —
- Monthly P&I
- —
- Monthly cashflow
- —
- DSCR
- —
- Eligible?
- —
No personal income docs; deal must DSCR.
Hard money
10% down · 12.0% · 12mo
- Down + closing
- —
- Monthly P&I
- —
- Monthly cashflow
- —
- DSCR
- —
- Eligible?
- —
Short-term bridge; refi at stabilization.
Rent comps 13 comps
| Address | Beds | Baths | Sqft | Rent | $/sqft | DOM | Units | Dist |
|---|---|---|---|---|---|---|---|---|
| 3221 Burgess St Flint, MI | 2.0 | 1.0 | 755 | $875 | $1.16 | 20d | 1 | 0.21mi |
| 711 W Dewey St Flint, MI | 3.0 | 1.0 | 1011 | $925 | $0.91 | 20d | 1 | 0.62mi |
| 2462 Gena Ann Ln Unit GEN2462 Flint, MI | 3.0 | 2.0 | 960 | $895 | $0.93 | 43d | 1 | 1.08mi |
| 3376 Preston Pl Unit PRE3376 Flint, MI | 3.0 | 2.0 | 960 | $895 | $0.93 | 43d | 1 | 1.09mi |
| 2410 Gena Ann Ln Unit GEN2410 Flint, MI | 3.0 | 2.0 | 960 | $895 | $0.93 | 43d | 1 | 1.11mi |
| 2410 Gena Ann Ln Flint, MI | 3.0 | 2.0 | 960 | $895 | $0.93 | 44d | 1 | 1.11mi |
| 2419 Gena Ann Ln Unit GEN2419 Flint, MI | 3.0 | 2.0 | 960 | $895 | $0.93 | 43d | 1 | 1.13mi |
| 411 W Marengo Ave Flint, MI | 3.0 | 1.0 | 1350 | $1,072 | $0.79 | 13d | 1 | 1.20mi |
| 5413 DuPont St Flint, MI | 4.0 | 1.5 | 1038 | $900 | $0.87 | 20d | 1 | 1.26mi |
| 3616 Concord St Unit CON3616 Flint, MI | 3.0 | 2.0 | 960 | $895 | $0.93 | 43d | 1 | 1.28mi |
| 2332 Fredonia Ave Unit FRE2332 Flint, MI | 3.0 | 2.0 | 960 | $895 | $0.93 | 43d | 1 | 1.30mi |
| 5905 Griggs Dr Flint, MI | 3.0 | 1.0 | 940 | $1,000 | $1.06 | 13d | 1 | 1.34mi |
| 5813 Edwards Ave Flint, MI | 3.0 | 1.0 | 1500 | $899 | $0.60 | 13d | 1 | 1.43mi |
Listing history 50 events
-
2026-06-18status $14,000 Pending 161 DOM
-
2026-06-18days on market $14,000 Active 161 DOM
-
2026-06-17days on market $14,000 Active 160 DOM
-
2026-06-16days on market $14,000 Active 159 DOM
-
2026-06-15days on market $14,000 Active 158 DOM
-
2026-06-14days on market $14,000 Active 156 DOM
-
2026-06-13days on market $14,000 Active 155 DOM
-
2026-06-10days on market $14,000 Active 153 DOM
-
2026-06-09days on market $14,000 Active 152 DOM
-
2026-06-08days on market $14,000 Active 151 DOM
-
2026-06-07days on market $14,000 Active 150 DOM
-
2026-06-05days on market $14,000 Active 147 DOM
-
2026-06-03days on market $14,000 Active 146 DOM
-
2026-06-02days on market $14,000 Active 145 DOM
-
2026-06-01days on market $14,000 Active 144 DOM
-
2026-05-31days on market $14,000 Active 143 DOM
-
2026-05-30days on market $14,000 Active 142 DOM
-
2026-04-17price $14,000 503-char remark
Show marketing remark (503 chars)
Fixer upper opportunity in Flint. Property needs work and is priced accordingly. This home is located on a street with multiple properties available, including additional single-family homes and a vacant lot. Properties may be purchased individually or together as a package. Discount may be considered for buyers purchasing multiple properties. Great opportunity to renovate and own multiple properties on the same street. Contact listing agent for photos and additional details. Limited photos posted.
-
2026-04-16price $14,000
-
2026-02-08price $15,000 503-char remark
Show marketing remark (503 chars)
Fixer upper opportunity in Flint. Property needs work and is priced accordingly. This home is located on a street with multiple properties available, including additional single-family homes and a vacant lot. Properties may be purchased individually or together as a package. Discount may be considered for buyers purchasing multiple properties. Great opportunity to renovate and own multiple properties on the same street. Contact listing agent for photos and additional details. Limited photos posted.
-
2026-02-07price $15,000
-
2026-01-08$17,000 Active 503-char remark
Show marketing remark (503 chars)
Fixer upper opportunity in Flint. Property needs work and is priced accordingly. This home is located on a street with multiple properties available, including additional single-family homes and a vacant lot. Properties may be purchased individually or together as a package. Discount may be considered for buyers purchasing multiple properties. Great opportunity to renovate and own multiple properties on the same street. Contact listing agent for photos and additional details. Limited photos posted.
-
2026-01-08$17,000 Active
Show marketing remark (503 chars)
Fixer upper opportunity in Flint. Property needs work and is priced accordingly. This home is located on a street with multiple properties available, including additional single-family homes and a vacant lot. Properties may be purchased individually or together as a package. Discount may be considered for buyers purchasing multiple properties. Great opportunity to renovate and own multiple properties on the same street. Contact listing agent for photos and additional details. Limited photos posted.
-
2024-09-06historical
-
2024-09-05historical
-
2024-08-17price $17,900
-
2024-08-16price $17,900
-
2024-08-14$19,900 Active
-
2024-08-14$19,900 Active
-
2024-08-12historical
-
2024-08-12historical
-
2024-08-08$22,000 Active
-
2024-08-08$22,000 Active
-
2023-07-25historical
-
2023-07-25historical
-
2023-03-14price $14,500
-
2023-03-13price $14,500
-
2023-02-28$16,500 Active
-
2023-02-28$16,500 Active
-
2010-12-03historical
-
2009-06-08historical
-
2009-06-08historical
-
2009-06-08historical
-
2009-05-08historical
-
2009-05-06$2,900
-
2008-11-19$2,900
-
2008-11-19$2,900
-
2008-11-19$2,900
-
2008-08-26historical
-
2008-08-26historical
ⓘ Source: listings_history table (triggers on properties + properties_extension) + one-shot
backfill from property_details.listing_events for pre-trigger history.
Climate risk First Street
- Flood 1/10 Low FEMA zone X (unshaded) · 0% chance over 30 yrs
- Wildfire 1/10 Low
- Heat 2/10 Low 7 d/yr ≥96°F today · 15 d/yr by 30 yrs out
- Wind 2/10 Low
- Air quality 3/10 Moderate 3 unhealthy d/yr today · 4 by 30 yrs out
Nearby sold comps map
Loading sold comps map…
Walkable amenities ~0.75 mi
Loading nearby amenities…
Taxation est. · year 1
- Rental income
- $10,887
- − Mortgage interest
- −$784
- − Property taxes
- −$210
- − Insurance
- −$70
- − Repairs & maintenance
- −$871
- − Management
- −$871
- − Depreciation
- −$407
- Taxable income
- $7,674
- Est. tax owed @ 24.0%
- −$1,842
- After-tax cash flow
- $5,598/yr
For passive investors: Depreciation is non-cash, so a rental often shows a tax loss while cash-flowing — sheltering income. Rental losses are passive: they offset passive income freely, and up to $25,000/yr can offset ordinary (W-2) income if you actively participate and your MAGI is under $100k (phasing out to $0 by $150k); unused losses carry forward. On sale, claimed depreciation is recaptured at up to 25%, and gains may owe capital-gains tax (a 1031 exchange can defer both). Figures are a year-1 estimate at your 24.0% rate — not tax advice; consult a CPA.
Schools (NCES district)
- District
- Flint School District
- NCES district ID
- 2614520
- Math proficiency
- 7% ▬ 0.00%
- Reading proficiency
- 13% ▲ 3.00%
- Median HH income
- $25,954
- Composite
- 10.97/100
- National rank
- #14642
- State rank
- #714 of 760 in MI
Livability — Flint
- Score
- 74/100
- State rank
- #196
- US rank
- #4946
Category grades
Schools grade is shown separately in the Schools card above.
Census & demographics
- Census place
- Flint, MI
- City population
- 93,814
- Population (ZIP)
- 23,873
Population outlook (Genesee County) Hauer SSP2
- Today (2025)
- 381,312 people
- By 2030
- 362,731 · -4.9%
- By 2040
- 321,550 · -15.7%
- By 2050
- 279,212 · -26.8%
- By 2075
- 193,336 · -49.3%
- By 2100
- 128,118 · -66.4%
Race, ethnicity, and origin ACS 2023
- Neighborhood character
- Predominantly Black (66%)
- Race & ethnicity
- Black 66% White 24% Two or more races 6% Hispanic / Latino 5% Asian 1%
- Common ancestry
- Romanian 2% Lithuanian 1% Italian 1%
- Foreign-born
- 3% · Canada, China
- Languages at home
- 96% English-only · Spanish 2%
Political lean MEDSL · Genesee
- 2024 margin
- Toss-up / Even · D 51.4% · R 47.2% · Other 1.4%
- 2008→2024 swing
- -28.3pp toward R · 2008: 32.5pp · 2024: 4.2pp
- All cycles
- 2024: D+4.2 2020: D+9.3 2016: D+9.5 2012: D+28.2 2008: D+32.5
Not yet ingested
- Civics
- —
Market trends
- HPI YoY
- ▼ -101.67%
- Current HPI
- 94.3111
- Rent YoY
- —
- Metro
- —
- State GDP YoY
- ▲ 1.37%
- F500 in state
- 28
Industry mix (Fortune 500 HQ in MI)
| Industry | F500 HQs | Revenue |
|---|---|---|
| Automotive Parts | 3 | $48B |
|
||
| Automotive | 2 | $372B |
|
||
| Chemicals | 1 | $45B |
|
||
| Automotive Retail | 1 | $29B |
|
||
| Healthcare / Medical Devices | 1 | $23B |
|
||
| Automotive Technology | 1 | $20B |
|
||
Price history
-51.6% since first listed47 events — show timeline
- 2026-04-17 Price Changed $14,000 MiRealSource-MiMLS
- 2026-04-16 Price Changed $14,000 REALCOMP
- 2026-02-08 Price Changed $15,000 MiRealSource-MiMLS
- 2026-02-07 Price Changed $15,000 REALCOMP
- 2026-01-08 Listed $17,000 REALCOMP
- 2026-01-08 Listed $17,000 MiRealSource-MiMLS
- 2024-09-06 Listing Removed — MiRealSource-MiMLS
- 2024-09-05 Listing Removed — REALCOMP
- 2024-08-17 Price Changed $17,900 MiRealSource-MiMLS
- 2024-08-16 Price Changed $17,900 REALCOMP
- 2024-08-14 Listed $19,900 MiRealSource-MiMLS
- 2024-08-14 Listed $19,900 REALCOMP
- 2024-08-12 Listing Removed — MiRealSource-MiMLS
- 2024-08-12 Listing Removed — REALCOMP
- 2024-08-08 Listed $22,000 MiRealSource-MiMLS
- 2024-08-08 Listed $22,000 REALCOMP
- 2023-07-25 Listing Removed — MiRealSource-MiMLS
- 2023-07-25 Listing Removed — REALCOMP
- 2023-03-14 Price Changed $14,500 MiRealSource-MiMLS
- 2023-03-13 Price Changed $14,500 REALCOMP
- 2023-02-28 Listed $16,500 MiRealSource-MiMLS
- 2023-02-28 Listed $16,500 REALCOMP
- 2010-12-03 Listing Removed — REALCOMP
- 2009-06-08 Listing Removed — REALCOMP
- 2009-06-08 Listing Removed — MiRealSource-MiMLS
- 2009-06-08 Listing Removed — REALCOMP
- 2009-05-08 Listing Removed — MiRealSource-MiMLS
- 2009-05-06 Listed $2,900 MiRealSource-MiMLS
- 2008-11-19 Listed $2,900 REALCOMP
- 2008-11-19 Listed $2,900 MiRealSource-MiMLS
- 2008-11-19 Listed $2,900 REALCOMP
- 2008-08-26 Listing Removed — REALCOMP
- 2008-08-26 Listing Removed — MiRealSource-MiMLS
- 2007-12-07 Listed $5,000 REALCOMP
- 2007-12-07 Listed $5,000 MiRealSource-MiMLS
- 2006-08-18 Sold (Public Records) $57,000 Public Records
- 1997-12-18 Listed $25,900 MiRealSource-MiMLS
- 1997-12-18 Listing Removed — MiRealSource-MiMLS
- 1997-12-18 Listing Removed — REALCOMP
- 1997-12-18 Listed $25,900 REALCOMP
- 1997-09-24 Listing Removed — MiRealSource-MiMLS
- 1997-09-24 Listed $25,900 MiRealSource-MiMLS
- 1997-09-24 Listing Removed — REALCOMP
- 1997-09-24 Listed $25,900 REALCOMP
- 1996-12-29 Listing Removed — MiRealSource-MiMLS
- 1996-03-19 Listed $28,900 MiRealSource-MiMLS
- 1996-03-19 Listed $28,900 REALCOMP
Property tax history
+0.8%/yrLatest (2025): $742 · +2.7% YoY. Source: county tax records.
Cash-flow waterfall
monthlySold comps — $/sqft
last 12 mo · ≤1 miLoading sold comps…