 🏗️ New Construction
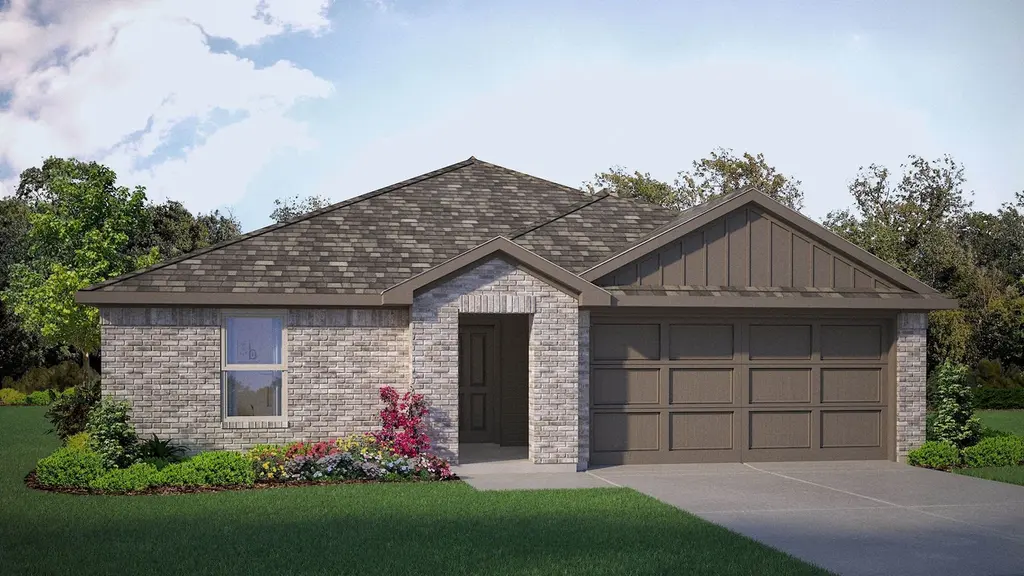
AUSTIN Plan · Boyd, TX
Flood risk 1/10 · Minimal
- FEMA flood zone
- X (unshaded)
- Chance of flooding over 30 yrs
- 0.0%
- Est. flood insurance / yr
- $507 – $1,088
Fire risk 7/10 · Major
- Est. fire insurance / yr
- $1,222 – $2,270
Heat risk 7/10 · Major
- Hot days now (above 109°F)
- 7 days/yr
- Hot days in 30 yrs
- 22 days/yr
Wind risk 6/10 · Moderate
- Chance of severe wind over 30 yrs
- 27.0%
Air-quality risk 2/10 · Minimal
- Unhealthy air days now
- 1 days/yr
- Unhealthy air days in 30 yrs
- 1 days/yr
Risk factors via First Street. Map © Google.
Why this score? — see what drove the F grade
The composite is a weighted blend of 9 inputs, each scored 0–100. Each bar is that input's sub-score; the figure is the points it added to the 100-point composite (weight × sub-score).
- Cash flow +8.1/30.0
- ARV discount +7.5/15.0
- Condition / age +4.0/5.0
- Livability +3.7/5.0
- Schools +3.2/10.0
- 1% rule +2.5/10.0
- Rent growth +2.5/5.0
- DSCR +2.1/10.0
- Appreciation +0.0/10.0
$262,990
🖨 Deal sheet (PDF) 📄 Offer letter ✓ Due diligence
Listing remarks MLS
The Austin is a spacious single-story home designed with comfort and convenience in mind, offering approximately 1657 sq. ft. of living space with 4 bedrooms and 2 bathrooms in a bright, open-concept layout. A welcoming front porch and foyer lead into the main living area, where the kitchen, dining space, and family room flow together seamlessly-creating an inviting setting for both everyday living and entertaining. The kitchen features stainless steel appliances, a centrally located sink overlooking the living areas, and a walk-in pantry for added storage. The private primary suite is tucked at the rear of the home and includes a generous walk-in closet and a full bath. Three additional bedrooms are thoughtfully arranged near the front of the home, each with its own closet and convenient access to the secondary bathroom-ideal for families, guests, or a home office. Additional highlights include a dedicated laundry room, linen and coat closets, and direct access to the two-car garage. A rear stoop extends the living space outdoors, completing the Austin's well-balanced and functional design. Photos shown here may not depict the specified home and features and are included for illustration purposes only. Elevations, exterior/ interior colors, options, available upgrades, and standard features will vary in each community and may change without notice. May include options, elevations, and upgrades (such as patio covers, front porches, stone options, and lot premiums) that requ
Key facts
- 2 garage spots
- Listed 127 days
Neighborhood map
What this means for you Summary
Snapshot
- This is a 4-bed/2.0-bath single-family listed at $263k. Condition is rated good.
Deal economics
- At list price, monthly cash flow is $-284 ($-3k/yr) — negative.
- To cash-flow at today's rent, offer at most $251k (4.5% below list).
- To meet the 1% rule (rent ≥ 1% of price), the offer needs to be $220k (16.5% below list).
- Recommended offer: $220k (16.5% below list) — sets the bar for 1% rule.
Location & tenants
- Location reads 74/100 on livability (#185 in TX, #4,775 nationally) — a middle-class / working-renter tenant base. Strengths: crime A+, cost of living A+, housing A+; Watch: amenities F, commute F.
- Boyd ISD (rural): math 36% / reading 38% proficiency, ranked #462 of 826 in TX (top 56%) — families likely to look elsewhere, expect single-tenant / working-renter base with shorter leases.
- Zoned schools: Boyd El (math 47% / reading 37%, grade F, #1,335 of 4,322 statewide, top 33%, 478 students, 57% FRL); Boyd Middle (math 32% / reading 47%, grade F, #660 of 1,662 statewide, top 41%, 202 students, 48% FRL); Boyd H S (math 37% / reading 47%, grade F, #730 of 1,632 statewide, top 47%, 386 students, 39% FRL) — zoned schools at 48% FRL track the district average.
- Market conditions: 203 active listings in the ZIP; 6 comparable units currently listed for rent nearby; rentals leasing fast (median 12d on market — plan ~1-2 weeks tenant-placement turnaround); 460 units permitted in Wise County in 2024 (243 in 5+ unit buildings).
Forward outlook
- Local home prices are declining (-3.0%/yr); year-one equity from $2k of loan paydown is wiped out by about $9k of value loss. Plan a longer hold.
- Wise County population projected at +27% by 2050 — long-run rental-demand tailwind backs the buy-and-hold thesis.
Negotiation context
- It's been on market 127 days — a 12% lower offer ($231k) is reasonable based on typical stale-listing flexibility.
Risks & watch-outs
- Climate carrying-cost: major wind risk, 27% chance of damaging wind over 30y; major wildfire risk; extreme-heat days projected 7→22/yr by 2055 (HVAC capex compounding) — expect insurance premiums to compound above CPI over the hold.
Questions for the listing agent
- What do current leases actually rent for vs. the listed asking? Can we see a recent rent roll and the last 12 months of T-12 income?
- It's been on market 127 days. Have you received any prior offers? Is the seller open to a 16% concession, seller financing, or rate buy-down credit?
- Why hasn't it sold? Are there any deal-killer items the seller is aware of (foundation, flood, title, zoning, code violations)?
- Is there a deadline driving the sale (1031 exchange, divorce, estate, relocation)? That informs how much negotiation room exists.
- Schools are D-rated, which usually means shorter tenancies and higher turnover. Who's the typical renter profile here, and what's been the actual vacancy rate?
- The area grade is low — what's the realistic commute time and amenity access for the typical tenant pool here? Any planned neighborhood developments (good or bad) we should know about?
- What's the average days-on-market for RENTAL listings here right now (not sales)? A rising rental-DOM trend means longer vacancies and softer asking-rent achievability than the comps imply.
- What's the recent tenant-quality profile in this submarket — average credit score on applications, eviction rate, late-payment / NSF rate, and stable-employment percentage? A property-management company in the area should have these aggregated.
- How much new for-sale + rental construction is in the pipeline within 1–3 miles? Heavy new supply typically softens prices + rents 12–24 months out; constrained supply supports both.
Investment metrics
- 1% rule
- 0.75% ✗
- Cap rate
- 5.13%
- Cash-on-cash
- -4.16%
- DSCR
- 0.81
- GRM
- 11.1
CMA / ARV
- ARV (median comp)
- $292,138
- List price
- $262,990
- Delta
- -9.98%
- Verdict
- FAIR
- Comps
- 20 within 1.0 mi
Show comp detail 12 sales within ~0.75 mi
| Address | Dist | Beds/Ba | Sqft | Sold | Price | $/sf | Match |
|---|---|---|---|---|---|---|---|
| 128 Birch Forest Ln | 0.09mi | 4/2.0 | 1,733 (+5%) | 2mo | $295,000 | $170 | 86 |
| 120 Birch Forest Ln | 0.11mi | 4/2.0 | 1,779 (+7%) | 2mo | $207,320 | $117 | 81 |
| 250 Birch Forest Ln | 0.21mi | 4/2.0 | 1,818 (+10%) | 1mo | $269,990 | $149 | 74 |
| 207 Greenhill Trl | 0.42mi | 4/2.0 | 1,602 (-3%) | 2mo | $300,990 | $188 | 73 |
| 172 Mojave Rd | 0.29mi | 3/2.0 (-1) | 1,566 (-6%) | 1mo | $269,990 | $172 | 72 |
| 132 Lilywood Ln | 0.31mi | 3/2.0 (-1) | 1,566 (-6%) | 2mo | $259,990 | $166 | 70 |
| 500 Green Meadow Dr | 0.30mi | 3/2.0 (-1) | 1,781 (+8%) | 1mo | $380,000 | $213 | 68 |
| 135 Mojave Rd | 0.22mi | 3/2.0 (-1) | 1,442 (-13%) | 1mo | $265,507 | $184 | 62 |
| 192 Greennhill Trl | 0.43mi | 4/2.0 | 1,838 (+11%) | 1mo | $316,990 | $172 | 61 |
| 215 Greenhill Trl | 0.44mi | 4/2.0 | 1,836 (+11%) | 2mo | $309,990 | $169 | 60 |
| 136 Lilywood Ln | 0.30mi | 3/2.0 (-1) | 1,442 (-13%) | 2mo | $254,990 | $177 | 58 |
| 128 Lilywood Ln | 0.32mi | 3/2.0 (-1) | 1,440 (-13%) | 1mo | $259,660 | $180 | 58 |
Match score weights: distance 35% · size 25% · config 20% · recency 20%. Top-matched comps best support the ARV.
Projected returns pro-forma
-3.0% appreciation · 3.0% rent growth · sell at horizon
- IRR
- -23.3%
- Equity multiple
- 0.20×
- Total profit
- $-65,385
- Equity at exit
- $43,559
- IRR
- -18.0%
- Equity multiple
- 0.02×
- Total profit
- $-80,081
- Equity at exit
- $25,259
Cash invested: $81,799 (down + closing). Projections, not guarantees.
Landlord ↔ Tenant lean methodology
- Overall (STATE)
- 87 Strongly Landlord-Friendly
- State Texas
- 87 Strongly Landlord-Friendly · R+5
- County
- — inherits STATE
- City
- — inherits STATE
ZIP-level market 76023
- Home prices YoY
- -3.6%
- Active inventory
- 203
- Price-to-rent
- 10.0×
Monthly cashflow live
- Estimated rent
- $2,196 high interval (Pro) →
- Mortgage (P&I)
- −$1,532
- Tax est. 1.5%
- −$365 /mo · $4,382/yr
- Insurance
- −$122
- HOA
- −$0
- Vacancy / Maint / Mgmt
- −$461
- Net cashflow
- $-284
Break-even live
Sensitivity live
| Price | -10% $-82 | -5% $-183 | +0% $-284 | +5% $-385 | +10% $-486 |
|---|---|---|---|---|---|
| Rent | -10% $-457 | -5% $-371 | +0% $-284 | +5% $-197 | +10% $-110 |
| Rate | -1.0pp $-137 | -0.5pp $-210 | base $-284 | +0.5pp $-360 | +1.0pp $-437 |
UW: 25.0% down · 7.5% · 30yr · 1.5% tax · 5.0% vac · 8.0% maint · 8.0% mgmt
Financing live
Cash to close
- Down payment
- $73,035
- Closing costs
- $8,764
- Reserves months
- —
- Total cash needed
- —
Loan-product check · same deal, 3 products live
Conventional
25% down · 7.5% · 30yr
- Down + closing
- —
- Monthly P&I
- —
- Monthly cashflow
- —
- DSCR
- —
- Eligible?
- —
Personal DTI + credit; lowest rate.
DSCR
20% down · 8.5% · 30yr
- Down + closing
- —
- Monthly P&I
- —
- Monthly cashflow
- —
- DSCR
- —
- Eligible?
- —
No personal income docs; deal must DSCR.
Hard money
10% down · 12.0% · 12mo
- Down + closing
- —
- Monthly P&I
- —
- Monthly cashflow
- —
- DSCR
- —
- Eligible?
- —
Short-term bridge; refi at stabilization.
Rent comps 6 comps
| Address | Beds | Baths | Sqft | Rent | $/sqft | DOM | Units | Dist |
|---|---|---|---|---|---|---|---|---|
| 105 Greengate Dr Boyd, TX | 4.0 | 2.5 | 2084 | $2,495 | $1.20 | 12d | 1 | 0.10mi |
| 156 Birch St Boyd, TX | 4.0 | 2.0 | 1587 | $2,150 | $1.35 | 3d | 1 | 0.21mi |
| 134 Gerber Ln Boyd, TX | 3.0 | 2.0 | 1566 | $2,100 | $1.34 | 45d | 1 | 0.32mi |
| 139 Mojave RD Boyd, TX | 3.0 | 2.0 | 1331 | $1,975 | $1.48 | 26d | 1 | 0.32mi |
| 139 Mojave RD Boyd, TX | 3.0 | 2.0 | 1331 | $1,895 | $1.42 | 1d | 1 | 0.32mi |
| 477 S Evans St Unit 300 Boyd, TX | 3.0 | 2.5 | 1681 | $1,800 | $1.07 | 0d | 1 | 0.67mi |
Listing history 15 events
-
2026-06-21days on market $262,990 Active 127 DOM
-
2026-06-18days on market $262,990 Active 124 DOM
-
2026-06-17days on market $262,990 Active 123 DOM
-
2026-06-16days on market $262,990 Active 122 DOM
-
2026-06-15days on market $262,990 Active 121 DOM
-
2026-06-13days on market $262,990 Active 119 DOM
-
2026-06-09days on market $262,990 Active 115 DOM
-
2026-06-08days on market $262,990 Active 114 DOM
-
2026-06-07days on market $262,990 Active 113 DOM
-
2026-06-04days on market $262,990 Active 110 DOM
-
2026-06-03days on market $262,990 Active 109 DOM
-
2026-06-02pricedays on market $262,990 Active 108 DOM
-
2026-06-01days on market $259,990 Active 107 DOM
-
2026-05-31days on market $259,990 Active 106 DOM
-
2026-02-14$259,990 Active 1498-char remark
Show marketing remark (1498 chars)
The Austin is a spacious single-story home designed with comfort and convenience in mind, offering approximately 1657 sq. ft. of living space with 4 bedrooms and 2 bathrooms in a bright, open-concept layout. A welcoming front porch and foyer lead into the main living area, where the kitchen, dining space, and family room flow together seamlessly-creating an inviting setting for both everyday living and entertaining. The kitchen features stainless steel appliances, a centrally located sink overlooking the living areas, and a walk-in pantry for added storage. The private primary suite is tucked at the rear of the home and includes a generous walk-in closet and a full bath. Three additional bedrooms are thoughtfully arranged near the front of the home, each with its own closet and convenient access to the secondary bathroom-ideal for families, guests, or a home office. Additional highlights include a dedicated laundry room, linen and coat closets, and direct access to the two-car garage. A rear stoop extends the living space outdoors, completing the Austin's well-balanced and functional design. Photos shown here may not depict the specified home and features and are included for illustration purposes only. Elevations, exterior/ interior colors, options, available upgrades, and standard features will vary in each community and may change without notice. May include options, elevations, and upgrades (such as patio covers, front porches, stone options, and lot premiums) that requ
ⓘ Source: listings_history table (triggers on properties + properties_extension) + one-shot
backfill from property_details.listing_events for pre-trigger history.
Climate risk First Street
- Flood 1/10 Low FEMA zone X (unshaded) · 0% chance over 30 yrs
- Wildfire 7/10 Severe
- Heat 7/10 Severe 7 d/yr ≥109°F today · 22 d/yr by 30 yrs out
- Wind 6/10 Major 27% chance of damaging wind over 30 yrs
- Air quality 2/10 Low 1 unhealthy d/yr today · 1 by 30 yrs out
Nearby sold comps map
Loading sold comps map…
Walkable amenities ~0.75 mi
Loading nearby amenities…
Taxation est. · year 1
- Rental income
- $26,355
- − Mortgage interest
- −$16,364
- − Property taxes
- −$4,382
- − Insurance
- −$1,461
- − Repairs & maintenance
- −$2,108
- − Management
- −$2,108
- − Depreciation
- −$8,499
- Taxable loss
- −$8,567
- Est. tax savings @ 24.0%
- +$2,056
- After-tax cash flow
- $-1,350/yr
For passive investors: Depreciation is non-cash, so a rental often shows a tax loss while cash-flowing — sheltering income. Rental losses are passive: they offset passive income freely, and up to $25,000/yr can offset ordinary (W-2) income if you actively participate and your MAGI is under $100k (phasing out to $0 by $150k); unused losses carry forward. On sale, claimed depreciation is recaptured at up to 25%, and gains may owe capital-gains tax (a 1031 exchange can defer both). Figures are a year-1 estimate at your 24.0% rate — not tax advice; consult a CPA.
Condition & rehab AI · 1 photo
The Austin Plan is a well-maintained single-story home with good condition and minimal repairs needed. It offers a spacious layout and is ready for a fresh coat of paint and some landscaping to enhance its curb appeal and value.
Value-add opportunities
- Both Painting exterior and interior — Enhances curb appeal and interior aesthetics
- Both Landscaping improvements — Enhances curb appeal and adds value
- Both New flooring in kitchen and bathrooms — Improves functionality and aesthetics
- Both New kitchen appliances — Modernizes the kitchen and adds value
Renovation cost estimate screening
Value-add ROI direction
- Both Painting exterior and interior — Enhances curb appeal and interior aesthetics ↑
- Both Landscaping improvements — Enhances curb appeal and adds value ↑
- Both New flooring in kitchen and bathrooms — Improves functionality and aesthetics ↑
- Both New kitchen appliances — Modernizes the kitchen and adds value ↑
ⓘ Cost ranges are severity-bucket heuristics (US national rule-of-thumb). Get contractor quotes + a written scope before underwriting a rehab budget.
Schools (NCES district)
- District
- Boyd ISD
- NCES district ID
- 4811010
- Math proficiency
- 36% ▼ -3.00%
- Reading proficiency
- 38% ▼ -5.00%
- Median HH income
- $51,462
- Composite
- 32.14/100
- National rank
- #5796
- State rank
- #462 of 826 in TX
Livability — Boyd
- Score
- 74/100
- State rank
- #185
- US rank
- #4775
Category grades
Schools grade is shown separately in the Schools card above.
Census & demographics
- Population (ZIP)
- 7,192
Population outlook (Wise County) Hauer SSP2
- Today (2025)
- 71,620 people
- By 2030
- 75,858 · +5.9%
- By 2040
- 83,908 · +17.2%
- By 2050
- 90,717 · +26.7%
- By 2075
- 107,583 · +50.2%
- By 2100
- 114,996 · +60.6%
Race, ethnicity, and origin ACS 2023
- Neighborhood character
- Predominantly White (85%)
- Race & ethnicity
- White 85% Hispanic / Latino 11% Two or more races 6%
- Hispanic origin (detail)
- Mexican 10%
- Common ancestry
- Lithuanian 4% Scotch-Irish 2% Italian 2%
- Foreign-born
- 3% · Canada
- Languages at home
- 92% English-only · Spanish 6% Russian/Polish/Slavic 1%
Political lean MEDSL · Wise
- 2024 margin
- Solid R (+70.0) · D 14.7% · R 84.7%
- 2008→2024 swing
- -14.3pp toward R · 2008: -55.7pp · 2024: -70.0pp
- All cycles
- 2024: R+70.0 2020: R+68.2 2016: R+69.9 2012: R+67.5 2008: R+55.7
Not yet ingested
- Civics
- —
Market trends
- HPI YoY
- ▼ -10.08%
- Current HPI
- 268.5024
- Rent YoY
- —
- Metro
- —
- State GDP YoY
- ▲ 3.95%
- F500 in state
- 110
Industry mix (Fortune 500 HQ in TX)
| Industry | F500 HQs | Revenue |
|---|---|---|
| Energy | 16 | $1,198B |
|
||
| Technology | 5 | $198B |
|
||
| Engineering / Construction | 4 | $72B |
|
||
| Energy Services | 3 | $60B |
|
||
| Utilities | 3 | $41B |
|
||
| Healthcare | 2 | $330B |
|
||
Price history
1 event — show timeline
- 2026-02-14 Listed $259,990 Zillow
Cash-flow waterfall
monthlySold comps — $/sqft
last 12 mo · ≤1 miLoading sold comps…