 🏗️ New Construction
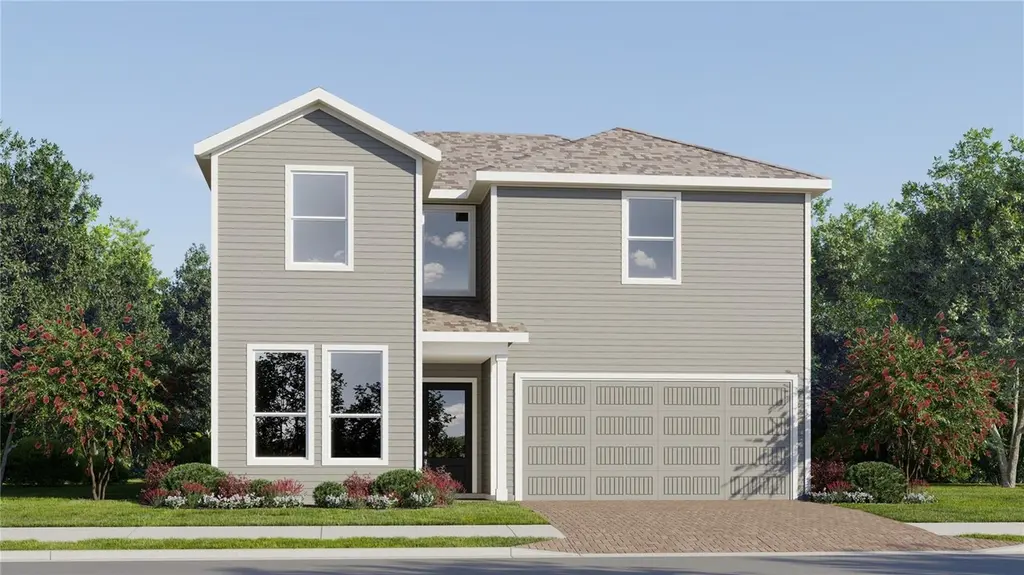
4353 Vibernum Ave · St. Cloud, FL
Flood risk No data
- FEMA flood zone
- —
- Chance of flooding over 30 yrs
- —
- Est. flood insurance / yr
- —
Fire risk No data
- Est. fire insurance / yr
- —
Heat risk No data
- Hot days now (above threshold)
- —
- Hot days in 30 yrs
- —
Wind risk No data
- Chance of severe wind over 30 yrs
- —
Air-quality risk No data
- Unhealthy air days now
- —
- Unhealthy air days in 30 yrs
- —
Risk factors via First Street. Map © Google.
Why this score? — see what drove the F grade
The composite is a weighted blend of 9 inputs, each scored 0–100. Each bar is that input's sub-score; the figure is the points it added to the 100-point composite (weight × sub-score).
- Cash flow +8.0/30.0
- ARV discount +7.5/15.0
- Schools +3.6/10.0
- Rent growth +3.1/5.0
- 1% rule +2.8/10.0
- Livability +2.5/5.0
- Condition / age +2.5/5.0
- DSCR +2.1/10.0
- Appreciation +0.0/10.0
$407,990
🖨 Deal sheet (PDF) 📄 Offer letter ✓ Due diligence
Listing remarks
Under Construction. This new two-story Napali is ready for modern lifestyles. Upon entry is a convenient bedroom with an en-suite bathroom, leading to an inviting open-concept floorplan with access to a covered patio. A luxurious owner’s suite provides a private retreat on the first floor, complete with a full bathroom and walk-in closet. Three additional bedrooms can be found on the second floor, including a versatile game room. Every home comes with Lennar’s Everything’s Included® promise, which includes new appliances as well as quartz countertops, and more in the price of your home. The Glades at Crossprairie is one of the most anticipated new communities. Resident
Key facts
- Full bathroom
- Walk-in closet
- Covered patio
Tags
Property features AI
Finance
- Other: CDD applies; Lease restrictions apply
- Financial info: Other annual assessment: $1,666; Monthly HOA amount: $115; Association approval required
- HOA & community: HOA required with monthly fee of $115 (includes grounds maintenance); Association amenities: clubhouse, pool, playground; Community features: dog park, park, tennis courts, street lights; Pets allowed
Exterior
- Parking: Attached 2-car garage (18x20) with garage door opener; Driveway
- Security: Owned security system; Smoke detectors
- Utilities: Public water; Public sewer; Cable available and connected; Electricity available and connected; Fiber optics; Underground utilities; Irrigation equipment (reclaimed water in community)
- Home design: Single-family residence; New construction (projected completion May 28, 2026); Two levels; West-facing
- Construction: Concrete and frame construction; Shingle roof; Built by Lennar Homes (Napali model); Slab foundation
- Exterior features: Covered patio and porch; Sliding doors; Trees and landscaped yard; City limits lot, paved and private with sidewalk
Interior
- Kitchen: Dishwasher; Disposal; Microwave; Refrigerator
- Bedrooms: 5 bedrooms
- Flooring: Ceramic tile; Concrete; Slab foundation
- Bathrooms: 3 full baths; 2 half baths
- Heating & cooling: Central heating (electric); Central air conditioning
- Interior features: In-wall pest control system; Kitchen open to family room; Solid surface counters; Solid wood cabinets; Thermostat; Walk-in closets; Thermal windows
- Laundry & utility: Inside laundry; Washer; Dryer; Inside utility / family room access
Neighborhood map
What this means for you Summary
Snapshot
- This is a 5-bed/4.0-bath land listed at $408k.
Deal economics
- At list price, monthly cash flow is $-409 ($-5k/yr) — negative.
- To cash-flow at today's rent, offer at most $349k (14.5% below list).
- To meet the 1% rule (rent ≥ 1% of price), the offer needs to be $320k (21.6% below list).
- Recommended offer: $320k (21.6% below list) — sets the bar for 1% rule.
- Cap rate 5.1% vs local median 4.0% in St. Cloud — meaningfully above typical; check what's discounted (condition, days-on-market, listing class) to confirm the premium yield is real.
Location & tenants
- Location reads: area grade F — affects rentability + tenant quality, not the cash-flow math above.
- Osceola (suburban): math 39% / reading 45% proficiency, ranked #60 of 73 in FL (top 82%) — families likely to look elsewhere, expect single-tenant / working-renter base with shorter leases; 60% free/reduced lunch — lower-income household profile, screen leases tightly.
- Zoned schools: Neptune Elementary School (math 42% / reading 44%, grade F, #1,366 of 2,144 statewide, top 64%, 993 students, 46% FRL); Neptune Middle School (math 49% / reading 48%, grade C-, #274 of 571 statewide, top 50%, 978 students, 44% FRL); St. Cloud High School (math 32% / reading 50%, grade F, #289 of 667 statewide, top 44%, 2,264 students, 51% FRL).
- Market conditions: Rents rising (+2.3%/yr); 879 active listings in the ZIP; 16 comparable units currently listed for rent nearby; rentals at typical pace (median 26d on market — plan ~3-4 weeks tenant-placement turnaround); solid renter incomes; 8,813 units permitted in Osceola County in 2024 (3,072 in 5+ unit buildings).
- This rent runs 39% of the median local income ($98k/yr) — at the standard rent-burdened threshold; future hikes will face affordability resistance.
Forward outlook
- Local home prices are declining (-3.0%/yr); year-one equity from $3k of loan paydown is wiped out by about $12k of value loss. Plan a longer hold.
- Osceola County population projected at +73% by 2050 — long-run rental-demand tailwind backs the buy-and-hold thesis.
Negotiation context
- Only 5 days on market — expect competitive offers; lowballing is unlikely to land.
Questions for the listing agent
- What do current leases actually rent for vs. the listed asking? Can we see a recent rent roll and the last 12 months of T-12 income?
- What does the HOA fee cover, when was the last increase, and are there any pending special assessments or reserve-fund shortfalls?
- Is there a deadline driving the sale (1031 exchange, divorce, estate, relocation)? That informs how much negotiation room exists.
- The area grade is low — what's the realistic commute time and amenity access for the typical tenant pool here? Any planned neighborhood developments (good or bad) we should know about?
- What's the average days-on-market for RENTAL listings here right now (not sales)? A rising rental-DOM trend means longer vacancies and softer asking-rent achievability than the comps imply.
- What's the recent tenant-quality profile in this submarket — average credit score on applications, eviction rate, late-payment / NSF rate, and stable-employment percentage? A property-management company in the area should have these aggregated.
- How much new for-sale + rental construction is in the pipeline within 1–3 miles? Heavy new supply typically softens prices + rents 12–24 months out; constrained supply supports both.
Investment metrics
- 1% rule
- 0.78% ✗
- Cap rate
- 5.09%
- Cash-on-cash
- -4.30%
- DSCR
- 0.81
- GRM
- 10.6
CMA / ARV
No comps found within radius.
Projected returns pro-forma
-3.0% appreciation · 2.3% rent growth · sell at horizon
- IRR
- -24.3%
- Equity multiple
- 0.17×
- Total profit
- $-94,285
- Equity at exit
- $60,833
- IRR
- -21.8%
- Equity multiple
- -0.09×
- Total profit
- $-124,217
- Equity at exit
- $35,276
Cash invested: $114,237 (down + closing). Projections, not guarantees.
Landlord ↔ Tenant lean methodology
- Overall (STATE)
- 87 Strongly Landlord-Friendly
- State Florida
- 87 Strongly Landlord-Friendly · R+3
- County
- — inherits STATE
- City
- — inherits STATE
ZIP-level market 34772
- Home prices YoY
- -32.5%
- Rents YoY
- 2.3%
- Active inventory
- 879
- Price-to-rent
- 10.6×
Monthly cashflow live
- Estimated rent
- $3,197 high interval (Pro) →
- Mortgage (P&I)
- −$2,140
- Tax est. 1.5%
- −$510 /mo · $6,120/yr
- Insurance
- −$170
- HOA
- −$115
- Vacancy / Maint / Mgmt
- −$671
- Net cashflow
- $-409
Break-even live
Sensitivity live
| Price | -10% $-127 | -5% $-268 | +0% $-409 | +5% $-550 | +10% $-691 |
|---|---|---|---|---|---|
| Rent | -10% $-662 | -5% $-535 | +0% $-409 | +5% $-283 | +10% $-157 |
| Rate | -1.0pp $-204 | -0.5pp $-305 | base $-409 | +0.5pp $-515 | +1.0pp $-622 |
UW: 25.0% down · 7.5% · 30yr · 1.5% tax · 5.0% vac · 8.0% maint · 8.0% mgmt
Financing live
Cash to close
- Down payment
- $101,998
- Closing costs
- $12,240
- Reserves months
- —
- Total cash needed
- —
Loan-product check · same deal, 3 products live
Conventional
25% down · 7.5% · 30yr
- Down + closing
- —
- Monthly P&I
- —
- Monthly cashflow
- —
- DSCR
- —
- Eligible?
- —
Personal DTI + credit; lowest rate.
DSCR
20% down · 8.5% · 30yr
- Down + closing
- —
- Monthly P&I
- —
- Monthly cashflow
- —
- DSCR
- —
- Eligible?
- —
No personal income docs; deal must DSCR.
Hard money
10% down · 12.0% · 12mo
- Down + closing
- —
- Monthly P&I
- —
- Monthly cashflow
- —
- DSCR
- —
- Eligible?
- —
Short-term bridge; refi at stabilization.
Rent comps 16 comps
| Address | Beds | Baths | Sqft | Rent | $/sqft | DOM | Units | Dist |
|---|---|---|---|---|---|---|---|---|
| 4377 Vibernum Ave Saint Cloud, FL | 4.0 | 3.0 | 2366 | $3,600 | $1.52 | 0d | 1 | 0.07mi |
| 5097 Arrowfeather Ct Saint Cloud, FL | 4.0 | 3.0 | 2366 | $3,600 | $1.52 | 0d | 1 | 0.13mi |
| 5161 Marlberry Ct Saint Cloud, FL | 4.0 | 2.5 | 2071 | $2,550 | $1.23 | 0d | 1 | 0.13mi |
| 5147 Natalia Dr Saint Cloud, FL | 4.0 | 3.5 | 2366 | $3,200 | $1.35 | 26d | 1 | 0.13mi |
| 5153 Natalia Dr Saint Cloud, FL | 4.0 | 3.0 | 2175 | $2,900 | $1.33 | 26d | 1 | 0.14mi |
| 5107 Loyalty Dr Saint Cloud, FL | 4.0 | 2.5 | 2071 | $2,500 | $1.21 | 24d | 1 | 0.23mi |
| 5115 Loyalty Dr Saint Cloud, FL | 4.0 | 2.5 | 2071 | $2,490 | $1.20 | 17d | 1 | 0.24mi |
| 5151 Loyalty Dr Saint Cloud, FL | 4.0 | 2.5 | 2071 | $2,750 | $1.33 | 26d | 1 | 0.26mi |
| 5195 Loyalty Dr Saint Cloud, FL | 4.0 | 2.5 | 2071 | $2,750 | $1.33 | 26d | 1 | 0.30mi |
| 4512 Homestead Trl Saint Cloud, FL | 4.0 | 2.5 | 2114 | $2,485 | $1.18 | 0d | 1 | 0.94mi |
| 4519 Windy Oak Way Saint Cloud, FL | 5.0 | 3.5 | 2825 | $2,950 | $1.04 | 26d | 1 | 1.02mi |
| 4632 Homestead Trl Saint Cloud, FL | 4.0 | 2.5 | 2104 | $2,500 | $1.19 | 26d | 1 | 1.05mi |
| 4658 Homestead Trl Saint Cloud, FL | 4.0 | 2.5 | 2114 | $2,500 | $1.18 | 20d | 1 | 1.09mi |
| 4598 Sidesaddle Trl Saint Cloud, FL | 4.0 | 2.5 | 2339 | $2,800 | $1.20 | 26d | 1 | 1.12mi |
| 4704 Homestead Trl Saint Cloud, FL | 4.0 | 2.5 | 2011 | $2,600 | $1.29 | 13d | 1 | 1.18mi |
| 4724 Homestead Trl Saint Cloud, FL | 4.0 | 2.5 | 2114 | $2,550 | $1.21 | 26d | 1 | 1.21mi |
HOA detail
- Monthly dues
- $115 · $1,380/yr
Listing history 2 events
-
2026-05-20$407,990 Active
-
2026-04-22soldstatus $1,631,200
ⓘ Source: listings_history table (triggers on properties + properties_extension) + one-shot
backfill from property_details.listing_events for pre-trigger history.
Nearby sold comps map
Loading sold comps map…
Walkable amenities ~0.75 mi
Loading nearby amenities…
Taxation est. · year 1
- Rental income
- $38,361
- − Mortgage interest
- −$22,854
- − Property taxes
- −$6,120
- − Insurance
- −$2,040
- − Repairs & maintenance
- −$3,069
- − Management
- −$3,069
- − HOA
- −$1,380
- − Depreciation
- −$11,869
- Taxable loss
- −$12,039
- Est. tax savings @ 24.0%
- +$2,889
- After-tax cash flow
- $-2,020/yr
For passive investors: Depreciation is non-cash, so a rental often shows a tax loss while cash-flowing — sheltering income. Rental losses are passive: they offset passive income freely, and up to $25,000/yr can offset ordinary (W-2) income if you actively participate and your MAGI is under $100k (phasing out to $0 by $150k); unused losses carry forward. On sale, claimed depreciation is recaptured at up to 25%, and gains may owe capital-gains tax (a 1031 exchange can defer both). Figures are a year-1 estimate at your 24.0% rate — not tax advice; consult a CPA.
Schools (NCES district)
- District
- Osceola
- NCES district ID
- 1201470
- Math proficiency
- 39% ▼ -9.00%
- Reading proficiency
- 45% ▼ -4.00%
- Median HH income
- $45,528
- Composite
- 35.7/100
- National rank
- #4865
- State rank
- #60 of 73 in FL
Livability — St. Cloud
No livability data for this city. (Only ~50 U.S. cities are tracked.)
Census & demographics
- Census place
- St. Cloud, FL
- County
- Osceola County · 410,217 people
- City population
- 29,247
- Metro
- Orlando-Kissimmee-Sanford, FL
- Population (ZIP)
- 35,390
- Household income
- $97,868
- Rent vs Own
- Severe rent burden
- 443.0
Population outlook (Osceola County) Hauer SSP2
- Today (2025)
- 447,624 people
- By 2030
- 511,823 · +14.3%
- By 2040
- 642,986 · +43.6%
- By 2050
- 774,552 · +73.0%
- By 2075
- 1,078,144 · +140.9%
- By 2100
- 1,269,660 · +183.6%
Race, ethnicity, and origin ACS 2023
- Neighborhood character
- Diverse neighborhood (Simpson 0.62)
- Race & ethnicity
- White 44% Hispanic / Latino 44% Two or more races 19% Black 4% Asian 2%
- Hispanic origin (detail)
- Puerto Rican 20% Cuban 2% Dominican 6%
- Common ancestry
- Lithuanian 2% Slovak 1% Iranian 1%
- Foreign-born
- 18% · Canada, Jamaica
- Languages at home
- 60% English-only · Spanish 36% German/W. Germanic 1% Other Indo-European 1%
Political lean MEDSL · Osceola
- 2024 margin
- Toss-up / Even · D 48.7% · R 50.2% · Other 1.1%
- 2008→2024 swing
- -21.2pp toward R · 2008: 19.7pp · 2024: -1.4pp
- All cycles
- 2024: R+1.4 2020: D+13.8 2016: D+25.0 2012: D+24.5 2008: D+19.7
Not yet ingested
- Civics
- —
Market trends
- HPI YoY
- ▼ -132.55%
- Current HPI
- 274.6517
- Rent YoY
- ▲ 2.30%
- Metro
- Orlando-Kissimmee-Sanford, FL
- State GDP YoY
- ▲ 3.28%
- F500 in state
- 36
Industry mix (Fortune 500 HQ in FL)
| Industry | F500 HQs | Revenue |
|---|---|---|
| Industrial Technology | 2 | $29B |
|
||
| Insurance | 2 | $17B |
|
||
| Retail | 1 | $60B |
|
||
| Technology Distribution | 1 | $58B |
|
||
| Homebuilding | 1 | $35B |
|
||
| Technology Manufacturing | 1 | $35B |
|
||
Price history
-75.0% since first listed2 events — show timeline
- 2026-05-20 Listed $407,990 Stellar MLS as Distributed by MLS Grid
- 2026-04-22 Sold (Public Records) $1,631,200 Public Records
Cash-flow waterfall
monthlySold comps — $/sqft
last 12 mo · ≤1 miLoading sold comps…