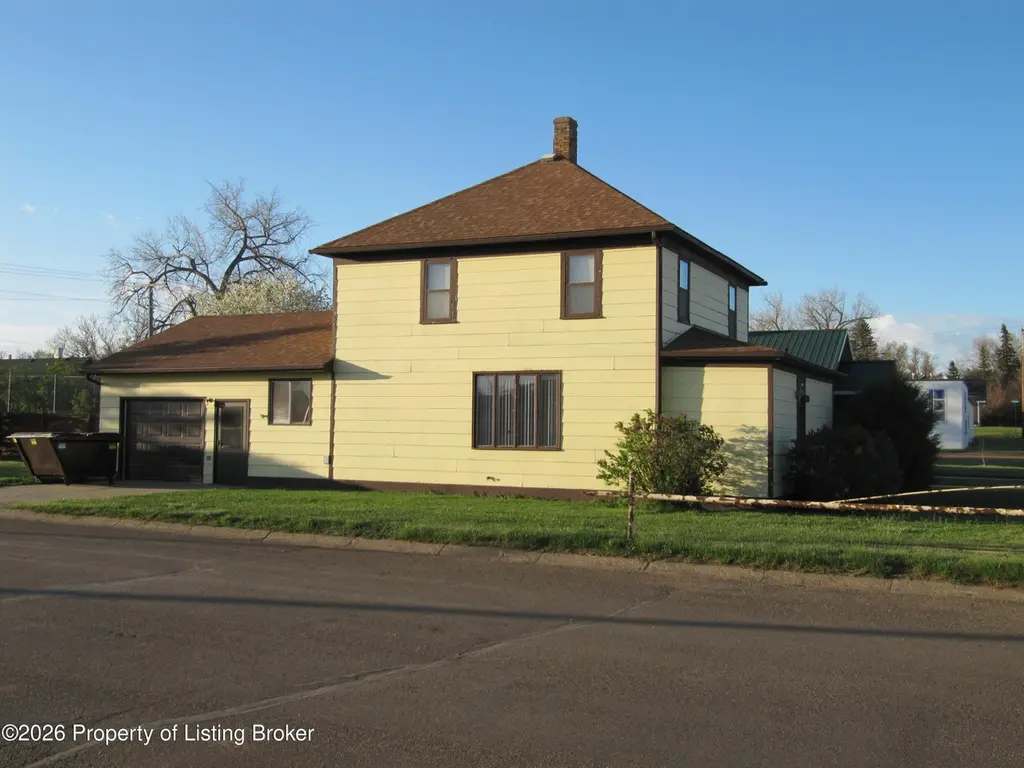
310 Central Ave S · Beach, ND
Flood risk 1/10 · Minimal
- FEMA flood zone
- —
- Chance of flooding over 30 yrs
- 0.0%
- Est. flood insurance / yr
- —
Fire risk 4/10 · Minor
- Est. fire insurance / yr
- $1,289 – $2,393
Heat risk 2/10 · Minimal
- Hot days now (above 96°F)
- 7 days/yr
- Hot days in 30 yrs
- 14 days/yr
Wind risk 2/10 · Minimal
- Chance of severe wind over 30 yrs
- —
Air-quality risk 3/10 · Minor
- Unhealthy air days now
- 3 days/yr
- Unhealthy air days in 30 yrs
- 3 days/yr
Risk factors via First Street. Map © Google.
Why this score? — see what drove the C+ grade
The composite is a weighted blend of 9 inputs, each scored 0–100. Each bar is that input's sub-score; the figure is the points it added to the 100-point composite (weight × sub-score).
- Cash flow +21.7/30.0
- ARV discount +10.9/15.0
- DSCR +6.9/10.0
- 1% rule +5.7/10.0
- Appreciation +5.0/10.0
- Livability +4.0/5.0
- Schools +3.6/10.0
- Rent growth +2.5/5.0
- Condition / age +2.2/5.0
$139,900
🖨 Deal sheet 📄 Offer letter ✓ Due diligence
Key facts
- En suite bathroom
- Attached garage
- Flex room
Tags
Property features AI
Exterior
- Parking: One-car garage with garage door opener
- Utilities: Public sewer
- Home design: Single Family Residence; Residential property; Two-story
- Construction: Basement present (concrete, unfinished)
- Exterior features: Lot approximately 50 x 141; Zoned Residential High Density; Public sewer
Interior
- Kitchen: Dishwasher; Range; Refrigerator
- Bathrooms: Two full bathrooms
- Heating & cooling: Has heating; No central cooling
- Interior features: Eat-in kitchen; Window coverings; Concrete unfinished basement
- Laundry & utility: Gas water heater
Neighborhood map
What this means for you Summary
Snapshot
- This is a 4-bed/2.0-bath single-family listed at $140k. Condition is rated fair.
Deal economics
- At list price, monthly cash flow is $215 ($3k/yr) — positive.
- The deal already cash-flows at list — no discount required.
- Meets the 1% rule at list price ($1k rent vs $140k).
- Recommended offer: $136k (3.0% below list) — sets the bar for market timing.
Location & tenants
- Location reads 79/100 on livability (#4 in ND, #2,032 nationally) — a middle-class / working-renter tenant base. Strengths: crime A+, cost of living A+, housing A+; Watch: amenities F, commute F.
- Beach 3 (rural): math 40% / reading 40% proficiency, ranked #107 of 169 in ND (top 63%) — families likely to look elsewhere, expect single-tenant / working-renter base with shorter leases.
- Market conditions: 21 active listings in the ZIP; 5 units permitted in Golden Valley County in 2024 (0 in 5+ unit buildings).
Forward outlook
- In year one you build about $5k of equity ($967 loan paydown + $4k appreciation (3.0% local appreciation)).
- Golden Valley County population projected at +51% by 2050 — long-run rental-demand tailwind backs the buy-and-hold thesis.
- At projected returns (3.0% appreciation + 3.0% rent growth), your $39k cash investment doubles in ~5 years — after that, you're playing with house money.
- By year 7, paydown + projected appreciation supports a ~$33k cash-out refi (75% LTV) — recoverable capital for the next deal without selling this one.
Negotiation context
- It's been on market 35 days — a 3% lower offer ($136k) is reasonable based on typical stale-listing flexibility.
Risks & watch-outs
- Watch-outs: built in 1910 — expect roof / HVAC / electrical / plumbing capex.
Questions for the listing agent
- It's been on market 35 days. Have you received any prior offers? Is the seller open to a 3% concession, seller financing, or rate buy-down credit?
- Have any recent inspections been done? Can we get a copy of the seller's disclosures and any deferred-maintenance estimates?
- Built in 1910 — when were the roof, HVAC, electrical panel, plumbing, and water heater last replaced?
- Is there a deadline driving the sale (1031 exchange, divorce, estate, relocation)? That informs how much negotiation room exists.
- What's the average days-on-market for RENTAL listings here right now (not sales)? A rising rental-DOM trend means longer vacancies and softer asking-rent achievability than the comps imply.
- What's the recent tenant-quality profile in this submarket — average credit score on applications, eviction rate, late-payment / NSF rate, and stable-employment percentage? A property-management company in the area should have these aggregated.
- How much new for-sale + rental construction is in the pipeline within 1–3 miles? Heavy new supply typically softens prices + rents 12–24 months out; constrained supply supports both.
Investment metrics
- 1% rule
- 1.07% ✓
- Cap rate
- 8.13%
- Cash-on-cash
- 6.57%
- DSCR
- 1.29
- GRM
- 7.8
CMA / ARV
- ARV (on-the-fly)
- $151,320
- Comps found
- 3
Show comp detail 3 sales within ~0.75 mi
| Address | Dist | Beds/Ba | Sqft | Sold | Price | $/sf | Match |
|---|---|---|---|---|---|---|---|
| 111 3 Ave SW | 0.26mi | 3/2.5 (-1) | 1,640 (+5%) | 8mo | $177,000 | $108 | 66 |
| 176 1st St NE | 0.34mi | 3/1.5 (-1) | 1,488 (-5%) | 7mo | $117,000 | $79 | 64 |
| 555 1st Ave SW | 0.18mi | 3/2.0 (-1) | 1,735 (+11%) | 18mo | $169,000 | $97 | 52 |
Match score weights: distance 35% · size 25% · config 20% · recency 20%. Top-matched comps best support the ARV.
Projected returns pro-forma
3.0% appreciation · 3.0% rent growth · sell at horizon
- IRR
- 13.6%
- Equity multiple
- 1.78×
- Total profit
- $30,541
- Equity at exit
- $62,905
- IRR
- 15.5%
- Equity multiple
- 3.29×
- Total profit
- $89,625
- Equity at exit
- $96,944
Cash invested: $39,172 (down + closing). Projections, not guarantees.
Landlord ↔ Tenant lean methodology
- Overall (STATE)
- 82 Strongly Landlord-Friendly
- State North Dakota
- 82 Strongly Landlord-Friendly · R+20
- County
- — inherits STATE
- City
- — inherits STATE
ZIP-level market 58621
- Active inventory
- 21
- Price-to-rent
- 7.8×
Monthly cashflow live
- Estimated rent
- $1,495 medium interval (Pro) →
- Mortgage (P&I)
- −$734
- Tax est. 1.5%
- −$175 /mo · $2,098/yr
- Insurance
- −$58
- HOA
- −$0
- Vacancy / Maint / Mgmt
- −$314
- Net cashflow
- $215
Break-even live
UW: 25.0% down · 7.5% · 30yr · 1.5% tax · 5.0% vac · 8.0% maint · 8.0% mgmt
Financing live
Cash to close
- Down payment
- $34,975
- Closing costs
- $4,197
- Reserves months
- —
- Total cash needed
- —
Loan-product check · same deal, 3 products live
Conventional
25% down · 7.5% · 30yr
- Down + closing
- —
- Monthly P&I
- —
- Monthly cashflow
- —
- DSCR
- —
- Eligible?
- —
Personal DTI + credit; lowest rate.
DSCR
20% down · 8.5% · 30yr
- Down + closing
- —
- Monthly P&I
- —
- Monthly cashflow
- —
- DSCR
- —
- Eligible?
- —
No personal income docs; deal must DSCR.
Hard money
10% down · 12.0% · 12mo
- Down + closing
- —
- Monthly P&I
- —
- Monthly cashflow
- —
- DSCR
- —
- Eligible?
- —
Short-term bridge; refi at stabilization.
Listing history 16 events
-
2026-06-18days on market $139,900 Active 35 DOM
-
2026-06-17days on market $139,900 Active 34 DOM
-
2026-06-16days on market $139,900 Active 33 DOM
-
2026-06-15days on market $139,900 Active 32 DOM
-
2026-06-14days on market $139,900 Active 30 DOM
-
2026-06-13days on market $139,900 Active 29 DOM
-
2026-06-10days on market $139,900 Active 27 DOM
-
2026-06-09days on market $139,900 Active 26 DOM
-
2026-06-08days on market $139,900 Active 25 DOM
-
2026-06-07days on market $139,900 Active 24 DOM
-
2026-06-03days on market $139,900 Active 20 DOM
-
2026-06-02days on market $139,900 Active 19 DOM
-
2026-06-01days on market $139,900 Active 18 DOM
-
2026-05-31days on market $139,900 Active 17 DOM
-
2026-05-31days on market $139,900 Active 16 DOM
-
2026-05-13$139,900 Active
ⓘ Source: listings_history table (triggers on properties + properties_extension) + one-shot
backfill from property_details.listing_events for pre-trigger history.
Climate risk First Street
- Flood 1/10 Low 0% chance over 30 yrs
- Wildfire 4/10 Moderate
- Heat 2/10 Low 7 d/yr ≥96°F today · 14 d/yr by 30 yrs out
- Wind 2/10 Low
- Air quality 3/10 Moderate 3 unhealthy d/yr today · 3 by 30 yrs out
Nearby sold comps map
Loading sold comps map…
Walkable amenities ~0.75 mi
Loading nearby amenities…
Taxation est. · year 1
- Rental income
- $17,945
- − Mortgage interest
- −$7,837
- − Property taxes
- −$2,098
- − Insurance
- −$700
- − Repairs & maintenance
- −$1,436
- − Management
- −$1,436
- − Depreciation
- −$4,070
- Taxable income
- $369
- Est. tax owed @ 24.0%
- −$89
- After-tax cash flow
- $2,486/yr
For passive investors: Depreciation is non-cash, so a rental often shows a tax loss while cash-flowing — sheltering income. Rental losses are passive: they offset passive income freely, and up to $25,000/yr can offset ordinary (W-2) income if you actively participate and your MAGI is under $100k (phasing out to $0 by $150k); unused losses carry forward. On sale, claimed depreciation is recaptured at up to 25%, and gains may owe capital-gains tax (a 1031 exchange can defer both). Figures are a year-1 estimate at your 24.0% rate — not tax advice; consult a CPA.
Condition & rehab AI · 13 photos
This home requires significant exterior and interior repairs, including painting, siding repair, and flooring replacement. Upgrading these areas will significantly increase its value for resale or rental.
Repairs flagged
- Major Exterior paint — Peeling paint indicates significant damage
- Major Siding — Weathered siding suggests structural issues
- Major Interior walls — Peeling paint and visible wear
- Major Flooring — Worn carpet and flooring need replacement
Value-add opportunities
- Resale Painting and updating exterior siding — Fresh paint and siding will attract buyers
- Rental Flooring replacement — New flooring will make the home more appealing to renters
- Both Interior painting and updating walls — Fresh paint and updated walls will improve both resale and rental value
Renovation cost estimate screening
| Repair item | Severity | Est. cost |
|---|---|---|
| Exterior paint · Peeling paint indicates significant damage | Major | $15,000–50,000 |
| Siding · Weathered siding suggests structural issues | Major | $15,000–50,000 |
| Interior walls · Peeling paint and visible wear | Major | $15,000–50,000 |
| Flooring · Worn carpet and flooring need replacement | Major | $15,000–50,000 |
| Total estimated repair cost · 4 items | $60,000–200,000 |
Value-add ROI direction
- Resale Painting and updating exterior siding — Fresh paint and siding will attract buyers ↑
- Rental Flooring replacement — New flooring will make the home more appealing to renters ↑
- Both Interior painting and updating walls — Fresh paint and updated walls will improve both resale and rental value ↑
ⓘ Cost ranges are severity-bucket heuristics (US national rule-of-thumb). Get contractor quotes + a written scope before underwriting a rehab budget.
Schools (NCES district)
- District
- Beach 3
- NCES district ID
- 3802380
- Math proficiency
- 40% ▬ 0.00%
- Reading proficiency
- 40% ▬ 0.00%
- Median HH income
- $38,333
- Composite
- 35.81/100
- National rank
- #9624
- State rank
- #107 of 169 in ND
Livability — Beach
- Score
- 79/100
- State rank
- #4
- US rank
- #2032
Category grades
Schools grade is shown separately in the Schools card above.
Census & demographics
- Census place
- Beach, ND
- Population (ZIP)
- 1,203
Population outlook (Golden Valley County) Hauer SSP2
- Today (2025)
- 2,209 people
- By 2030
- 2,428 · +9.9%
- By 2040
- 2,878 · +30.3%
- By 2050
- 3,342 · +51.3%
- By 2075
- 4,620 · +109.1%
- By 2100
- 5,663 · +156.4%
Race, ethnicity, and origin ACS 2023
- Neighborhood character
- Predominantly White (88%)
- Race & ethnicity
- White 88% Two or more races 11%
- Common ancestry
- Portuguese 7% Romanian 7% Lithuanian 3%
- Foreign-born
- 1% · Canada
- Languages at home
- 98% English-only · Other Asian/Pacific 1% Spanish 1%
Political lean MEDSL · Golden Valley
- 2024 margin
- Solid R (+73.7) · D 12.4% · R 86.1% · Other 1.5%
- 2008→2024 swing
- -24.3pp toward R · 2008: -49.4pp · 2024: -73.7pp
- All cycles
- 2024: R+73.7 2020: R+71.5 2016: R+73.7 2012: R+62.7 2008: R+49.4
Not yet ingested
- Civics
- —
Market trends
- HPI YoY
- —
- Current HPI
- —
- Rent YoY
- —
- Metro
- —
- State GDP YoY
- ▲ 2.09%
- F500 in state
- 2
Industry mix (Fortune 500 HQ in ND)
| Industry | F500 HQs | Revenue |
|---|---|---|
| Utilities / Construction | 1 | $6B |
|
||
Price history
1 event — show timeline
- 2026-05-13 Listed $139,900 Badlands BOR MLS
Cash-flow waterfall
monthlySold comps — $/sqft
last 12 mo · ≤1 miLoading sold comps…