 6-Plex
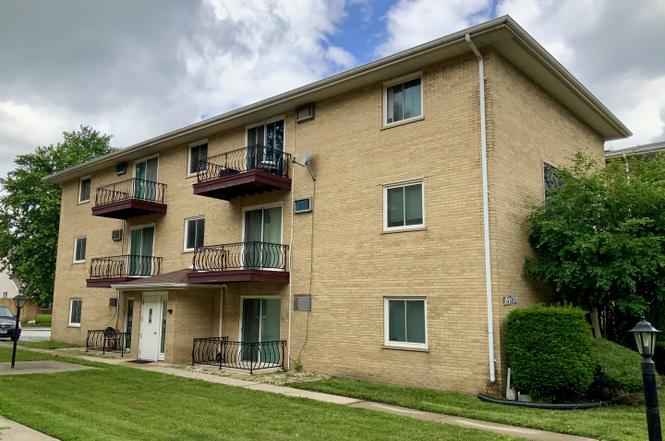
17760 Rosewood Dr · Lansing, IL
Flood risk 1/10 · Minimal
- FEMA flood zone
- X (unshaded)
- Chance of flooding over 30 yrs
- 0.0%
- Est. flood insurance / yr
- $473 – $860
Fire risk 1/10 · Minimal
- Est. fire insurance / yr
- $804 – $1,492
Heat risk 3/10 · Minor
- Hot days now (above 103°F)
- 7 days/yr
- Hot days in 30 yrs
- 15 days/yr
Wind risk 2/10 · Minimal
- Chance of severe wind over 30 yrs
- 0.0%
Air-quality risk 4/10 · Minor
- Unhealthy air days now
- 4 days/yr
- Unhealthy air days in 30 yrs
- 5 days/yr
Risk factors via First Street. Map © Google.
Why this score? — see what drove the C- grade
The composite is a weighted blend of 9 inputs, each scored 0–100. Each bar is that input's sub-score; the figure is the points it added to the 100-point composite (weight × sub-score).
- Cash flow +19.8/30.0
- 1% rule +7.5/10.0
- ARV discount +7.5/15.0
- DSCR +6.3/10.0
- Livability +3.7/5.0
- Rent growth +2.5/5.0
- Condition / age +2.5/5.0
- Schools +1.0/10.0
- Appreciation +0.0/10.0
$650,000
🖨 Deal sheet (PDF) 📄 Offer letter ✓ Due diligence
Multi-family units
County records classify this as Multi-Family (5+ Unit). Listing-text estimate: 6 units. confirmed
5+ unit building — per-unit beds/baths from public records are typically unavailable; the breakdown below (if shown) is an estimate from the listing text.
Listing remarks
THIS IS A GREAT ALL BRICK 6 UNIT BUILDING WITH MANY UPDATES WITH IN THE LAST COUPLE OF YEARS. THE OWNER HAS MAINTAINED ALL THE UNITS IN GREAT SHAPE. THE BUILDING IS ALL ELECTRIC. THE TENANTS PAY THEIR OWN HEAT AND ELECTRIC. ALL UNITS HAVE A WALL SLEEVE AIR CONDITIONER. THE OWNER PAYS THE WATER, TRASH EXPENSE, COMMON ELECTRIC AND GROUND MAINTENANCE. ALL THE APPLIANCES BELONG TO THE OWNER AND WILL TRANSFER TO BUYER. THE BUILDING HAS A COIN WASHER AND DRYER IN THE LAUNDRY ROOM.
Key facts
- All brick
- 7,995 sq ft lot
- Built 1974
Tags
Property features AI
Finance
- Other: Possession subject to tenants' rights
- Financial info: Total monthly income: $8,050; Gross income: $96,600; Gross rent multiplier: 6.72; Unit monthly rents range from $1,150 to $1,450; Owner-projected water/sewer expense: $1,900; Electric expense: $900; Trash expense: $1,000; Insurance expense: $4,711
Exterior
- Utilities: Electric service with circuit breakers
- Home design: Multi-family building (5+ units); Contains 6 units
- Construction: Brick construction; Composition roof; Concrete perimeter foundation; Built before 1978
- Exterior features: Lot approximately 53 x 147 (per county records); Zoned MULTI
Interior
- Kitchen: Ranges: 6 total
- Bedrooms: Five 2-bedroom units; One 1-bedroom unit
- Bathrooms: Each unit has one full bathroom
- Heating & cooling: Electric heat with separate systems per unit; Wall sleeve air conditioners (6 window/AC units)
- Interior features: Leases and month-to-month tenancy
- Laundry & utility: One washer; One dryer; Washer/dryer not leased
Neighborhood map
What this means for you Summary
Snapshot
- This is a 6 × 1-bed/1.0-bath units multifamily listed at $650k.
Deal economics
- At list price, monthly cash flow is $768 ($9k/yr) — positive. Per door: $128/mo.
- The deal already cash-flows at list — no discount required.
- Meets the 1% rule at list price ($8k rent vs $650k).
- Cap rate 7.7% vs local median 5.8% in Lansing — top-decile yield for the area; either an underpriced asset or a hidden risk that comps aren't pricing in. Stress-test before assuming the spread holds.
Location & tenants
- Location reads 73/100 on livability (#296 in IL) — a middle-class / working-renter tenant base. Strengths: commute A+, cost of living A+, housing A+; Watch: crime D+, health & safety D+, amenities F.
- Thornton Fractional Twp Hsd 215 (suburban): math 9% / reading 13% proficiency, ranked #563 of 620 in IL (top 91%) — low school quality limits family demand, transient renter base, plan for 1-2y turnover.
- Zoned schools: Oak Glen Elem School (math 12% / reading 17%, grade F, #1,278 of 2,056 statewide, top 65%, 529 students, 0% FRL); Memorial Jr High School (math 9% / reading 20%, grade F, #517 of 665 statewide, top 79%, 860 students, 0% FRL); Thornton Fractnl So High School (math 11% / reading 14%, grade F, #504 of 693 statewide, top 73%, 1,927 students, 0% FRL).
- Market conditions: 136 active listings in the ZIP; solid renter incomes; 6,272 units permitted in Cook County in 2024 (4,658 in 5+ unit buildings).
- At $8,131/mo this rent would consume 129% of the median local household income ($76k/yr) (locally 830% of renters already pay >50% of income on rent) — very limited rent-growth headroom before tenants either downsize or default.
Forward outlook
- Local home prices are declining (-3.0%/yr); year-one equity from $4k of loan paydown is wiped out by about $20k of value loss. Plan a longer hold.
Negotiation context
- Only 11 days on market — expect competitive offers; lowballing is unlikely to land.
Risks & watch-outs
- Watch-outs: property tax is 3.6% of price.
Questions for the listing agent
- Can we see the unit-by-unit rent roll, current vacancy, and any below-market leases? What's the average tenancy length?
- What capital expenditures (roof, boiler, parking lot, exteriors) have been made in the last 5 years, and what's planned in the next 2?
- Built in 1974 — when were the roof, HVAC, electrical panel, plumbing, and water heater last replaced?
- Property tax is high relative to price — has the assessment been appealed recently, and will the sale trigger a re-assessment?
- Is there a deadline driving the sale (1031 exchange, divorce, estate, relocation)? That informs how much negotiation room exists.
- Schools are D-rated, which usually means shorter tenancies and higher turnover. Who's the typical renter profile here, and what's been the actual vacancy rate?
- Crime grade is D in this area — have there been break-ins, vandalism, or insurance claims at this property in the last 3 years? What carrier currently insures it and at what premium?
- What's the average days-on-market for RENTAL listings here right now (not sales)? A rising rental-DOM trend means longer vacancies and softer asking-rent achievability than the comps imply.
- What's the recent tenant-quality profile in this submarket — average credit score on applications, eviction rate, late-payment / NSF rate, and stable-employment percentage? A property-management company in the area should have these aggregated.
- How much new apartment / multifamily construction is in the pipeline within 1–3 miles? Heavy new supply (>2% of stock underway) typically softens rents 12–24 months out; light construction supports rent growth.
Investment metrics
- 1% rule
- 1.25% ✓
- Cap rate
- 7.71%
- Cash-on-cash
- 5.07%
- DSCR
- 1.23
- GRM
- 6.7
CMA / ARV
No comps found within radius.
Projected returns pro-forma
-3.0% appreciation · 3.0% rent growth · sell at horizon
- IRR
- -8.3%
- Equity multiple
- 0.69×
- Total profit
- $-55,555
- Equity at exit
- $96,917
- IRR
- 1.4%
- Equity multiple
- 1.10×
- Total profit
- $18,037
- Equity at exit
- $56,200
Cash invested: $182,000 (down + closing). Projections, not guarantees.
Landlord ↔ Tenant lean methodology
- Overall (STATE)
- 43 Moderately Tenant-Leaning
- State Illinois
- 43 Moderately Tenant-Leaning · D+7
- County
- — inherits STATE
- City
- — inherits STATE
ZIP-level market 60438
- Active inventory
- 136
- Price-to-rent
- 40.0×
Monthly cashflow live
- Estimated rent
- $8,131 high interval (Pro) →
- Mortgage (P&I)
- −$3,409
- Tax from tax record
- −$1,976 /mo · $23,708/yr
- Insurance
- −$271
- HOA
- −$0
- Lot rent
- −$0
- Vacancy / Maint / Mgmt
- −$1,708
- Net cashflow
- $768
Break-even live
Sensitivity live
| Price | -10% $1,136 | -5% $952 | +0% $768 | +5% $584 | +10% $400 |
|---|---|---|---|---|---|
| Rent | -10% $126 | -5% $447 | +0% $768 | +5% $1,089 | +10% $1,411 |
| Rate | -1.0pp $1,096 | -0.5pp $934 | base $768 | +0.5pp $600 | +1.0pp $429 |
6-unit breakdown (identical units grouped — click to expand)
| Units | Beds | Baths | Est. rent |
|---|---|---|---|
| 6× units | 1 | 1 | $8,130 |
| #1 | 1 | 1 | $1,355 |
| #2 | 1 | 1 | $1,355 |
| #3 | 1 | 1 | $1,355 |
| #4 | 1 | 1 | $1,355 |
| #5 | 1 | 1 | $1,355 |
| #6 | 1 | 1 | $1,355 |
| Total (6 units) | $8,131 | ||
UW: 25.0% down · 7.5% · 30yr · 1.5% tax · 5.0% vac · 8.0% maint · 8.0% mgmt
Financing live
Cash to close
- Down payment
- $162,500
- Closing costs
- $19,500
- Reserves months
- —
- Total cash needed
- —
Loan-product check · same deal, 3 products live
Conventional
25% down · 7.5% · 30yr
- Down + closing
- —
- Monthly P&I
- —
- Monthly cashflow
- —
- DSCR
- —
- Eligible?
- —
Personal DTI + credit; lowest rate.
DSCR
20% down · 8.5% · 30yr
- Down + closing
- —
- Monthly P&I
- —
- Monthly cashflow
- —
- DSCR
- —
- Eligible?
- —
No personal income docs; deal must DSCR.
Hard money
10% down · 12.0% · 12mo
- Down + closing
- —
- Monthly P&I
- —
- Monthly cashflow
- —
- DSCR
- —
- Eligible?
- —
Short-term bridge; refi at stabilization.
Listing history 8 events
-
2026-06-22days on market $650,000 Active 11 DOM
-
2026-06-21days on market $650,000 Active 10 DOM
-
2026-06-18days on market $650,000 Active 7 DOM
-
2026-06-17days on market $650,000 Active 6 DOM
-
2026-06-16days on market $650,000 Active 5 DOM
-
2026-06-15statusdays on market $650,000 Active 4 DOM
-
2026-06-13remarks 479-char remark
-
2026-06-13$650,000 Temporarily No Showings 2 DOM
ⓘ Source: listings_history table (triggers on properties + properties_extension) + one-shot
backfill from property_details.listing_events for pre-trigger history.
Tax reassessment forecast IL · Partial reset (capped growth)
- Current annual tax
- $23,708 · $1,976/mo
- Projected year-2 tax
- $23,708 · $1,976/mo
- Expected delta
- $0/yr ($0/mo · 0.0%)
ⓘ Screening estimate from a state-policy table — verify with the county assessor before closing.
Climate risk First Street
- Flood 1/10 Low FEMA zone X (unshaded) · 0% chance over 30 yrs
- Wildfire 1/10 Low
- Heat 3/10 Moderate 7 d/yr ≥103°F today · 15 d/yr by 30 yrs out
- Wind 2/10 Low 0% chance of damaging wind over 30 yrs
- Air quality 4/10 Moderate 4 unhealthy d/yr today · 5 by 30 yrs out
Nearby sold comps map
Loading sold comps map…
Walkable amenities ~0.75 mi
Loading nearby amenities…
Taxation est. · year 1
- Rental income
- $97,572
- − Mortgage interest
- −$36,410
- − Property taxes
- −$23,708
- − Insurance
- −$3,250
- − Repairs & maintenance
- −$7,806
- − Management
- −$7,806
- − Depreciation
- −$18,909
- Taxable loss
- −$317
- Est. tax savings @ 24.0%
- +$76
- After-tax cash flow
- $9,296/yr
For passive investors: Depreciation is non-cash, so a rental often shows a tax loss while cash-flowing — sheltering income. Rental losses are passive: they offset passive income freely, and up to $25,000/yr can offset ordinary (W-2) income if you actively participate and your MAGI is under $100k (phasing out to $0 by $150k); unused losses carry forward. On sale, claimed depreciation is recaptured at up to 25%, and gains may owe capital-gains tax (a 1031 exchange can defer both). Figures are a year-1 estimate at your 24.0% rate — not tax advice; consult a CPA.
Schools (NCES district)
- District
- Thornton Fractional Twp Hsd 215
- NCES district ID
- 1738940
- Math proficiency
- 9% ▼ -3.00%
- Reading proficiency
- 13% ▼ -3.00%
- Median HH income
- $48,207
- Composite
- 10.27/100
- National rank
- #9793
- State rank
- #563 of 620 in IL
Livability — Lansing
- Score
- 73/100
- State rank
- #296
- US rank
- #5698
Category grades
Schools grade is shown separately in the Schools card above.
Census & demographics
- Census place
- Lansing, IL
- County
- Cook County · 4,486,803 people
- City population
- 28,806
- Metro
- Chicago-Naperville-Elgin, IL-IN-WI
- Population (ZIP)
- 28,806
- Household income
- $75,681
- Rent vs Own
- Severe rent burden
- 830.0
Population outlook (Cook County) Hauer SSP2
- Today (2025)
- 5,347,519 people
- By 2030
- 5,357,703 · +0.2%
- By 2040
- 5,324,924 · -0.4%
- By 2050
- 5,230,762 · -2.2%
- By 2075
- 4,785,735 · -10.5%
- By 2100
- 4,188,836 · -21.7%
Race, ethnicity, and origin ACS 2023
- Neighborhood character
- Diverse neighborhood (Simpson 0.65)
- Race & ethnicity
- Black 51% White 25% Hispanic / Latino 18% Two or more races 7% Asian 2%
- Hispanic origin (detail)
- Mexican 15%
- Common ancestry
- Romanian 5% Iranian 3% Lithuanian 1%
- Foreign-born
- 10% · Canada
- Languages at home
- 83% English-only · Spanish 12% Vietnamese 1% French/Haitian/Cajun 1%
Political lean MEDSL · Cook
- 2024 margin
- Solid D (+42.0) · D 70.4% · R 28.4% · Other 1.2%
- 2008→2024 swing
- -11.4pp toward R · 2008: 53.4pp · 2024: 42.0pp
- All cycles
- 2024: D+42.0 2020: D+50.3 2016: D+53.0 2012: D+49.4 2008: D+53.4
Not yet ingested
- Civics
- —
Market trends
- HPI YoY
- ▼ -151.65%
- Current HPI
- 210.3398
- Rent YoY
- —
- Metro
- Chicago-Naperville-Elgin, IL-IN-WI
- State GDP YoY
- ▲ 1.59%
- F500 in state
- 60
Industry mix (Fortune 500 HQ in IL)
| Industry | F500 HQs | Revenue |
|---|---|---|
| Insurance | 4 | $201B |
|
||
| Consumer Goods | 4 | $87B |
|
||
| Industrial Machinery | 3 | $64B |
|
||
| Healthcare | 2 | $55B |
|
||
| Retail / Pharmacy | 1 | $148B |
|
||
| Agriculture / Food | 1 | $86B |
|
||
Price history
1 event — show timeline
- 2026-06-11 Listed $650,000 MRED as Distributed by MLS Grid
Property tax history
+4.7%/yrLatest (2023): $23,708 · +11.4% YoY. Source: county tax records.
Cash-flow waterfall
monthlySold comps — $/sqft
last 12 mo · ≤1 miLoading sold comps…