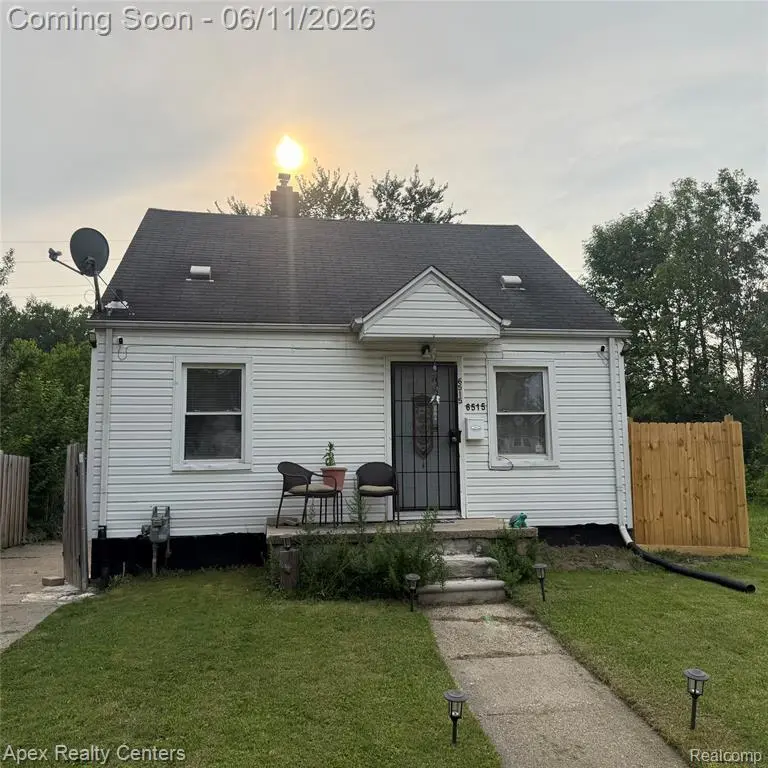
6515 Ashton Ave · Detroit, MI
Flood risk 1/10 · Minimal
- FEMA flood zone
- X (unshaded)
- Chance of flooding over 30 yrs
- 0.0%
- Est. flood insurance / yr
- $473 – $860
Fire risk 1/10 · Minimal
- Est. fire insurance / yr
- $784 – $1,456
Heat risk 3/10 · Minor
- Hot days now (above 97°F)
- 7 days/yr
- Hot days in 30 yrs
- 15 days/yr
Wind risk 2/10 · Minimal
- Chance of severe wind over 30 yrs
- —
Air-quality risk 3/10 · Minor
- Unhealthy air days now
- 2 days/yr
- Unhealthy air days in 30 yrs
- 4 days/yr
Risk factors via First Street. Map © Google.
Why this score? — see what drove the D+ grade
The composite is a weighted blend of 9 inputs, each scored 0–100. Each bar is that input's sub-score; the figure is the points it added to the 100-point composite (weight × sub-score).
- Cash flow +19.7/30.0
- ARV discount +7.5/15.0
- DSCR +6.2/10.0
- 1% rule +5.7/10.0
- Livability +3.7/5.0
- Condition / age +2.5/5.0
- Rent growth +1.9/5.0
- Schools +1.3/10.0
- Appreciation +0.0/10.0
$135,000
🖨 Deal sheet (PDF) 📄 Offer letter ✓ Due diligence
Listing remarks MLS
Well maintained Three Beds One bath Bungalow House, ready to move in and make it your own home, with the extra large second floor bedroom.
Key facts
- 5,227 sq ft lot
- Garage
- Built 1941
Property features AI
Exterior
- Parking: Detached 1-car garage
- Utilities: Public water; Natural gas heating; Forced air heating system
- Home design: Residential 2-story home; Originally built in 1941; Basement present; Below-grade finished area included
- Construction: Aluminum construction; Basement foundation; Built in 1941
- Exterior features: Aluminum exterior; Paved street access; Frontage approximately 40 feet
Interior
- Kitchen: Entry-level kitchen with ceramic flooring (approx. 10 x 14)
- Bedrooms: Second-level bedroom (9 x 12) with carpet; Entry-level bedroom (10 x 11) with wood flooring; Entry-level bedroom (approx. 10' wide) with wood flooring; Basement bedroom (8 x 10) with concrete floor
- Flooring: Carpet in one bedroom; Wood flooring in living room and two bedrooms; Ceramic flooring in kitchen and bathrooms; Concrete flooring in basement bedroom
- Bathrooms: Two full bathrooms; Entry-level bathroom with ceramic flooring; Basement bathroom with ceramic flooring (approx. 8 x 8)
- Heating & cooling: Forced air heating; Natural gas fuel
- Interior features: Finished basement; Total of 8 rooms
- Laundry & utility: Basement (finished) — utility/laundry area implied
Neighborhood map
What this means for you Summary
Snapshot
- This is a 4-bed/1.0-bath single-family listed at $135k.
Deal economics
- At list price, monthly cash flow is $157 ($2k/yr) — positive.
- The deal already cash-flows at list — no discount required.
- Meets the 1% rule at list price ($1k rent vs $135k).
- Cap rate 7.7% vs local median 10.2% in Detroit — below-typical yield; the buyer is paying a premium for something (appreciation thesis, condition, location) that the cap rate doesn't capture.
Location & tenants
- Location reads 73/100 on livability (#218 in MI) — a middle-class / working-renter tenant base. Strengths: amenities A+, commute A+, cost of living A+; Watch: schools F, crime F, employment F.
- Detroit Public Schools Community District (urban): math 10% / reading 24% proficiency, ranked #499 of 540 in MI (top 92%) — low school quality limits family demand, transient renter base, plan for 1-2y turnover; 90% free/reduced lunch — lower-income household profile, screen leases tightly.
- Market conditions: Rents soft (-2.3%/yr); 363 active listings in the ZIP; 1 comparable units currently listed for rent nearby; lower-income renter base — watch delinquency; 2,639 units permitted in Wayne County in 2024 (1,216 in 5+ unit buildings).
- At $1,448/mo this rent would consume 57% of the median local household income ($31k/yr) (locally 4144% of renters already pay >50% of income on rent) — very limited rent-growth headroom before tenants either downsize or default.
Forward outlook
- Local home prices are declining (-3.0%/yr); year-one equity from $933 of loan paydown is wiped out by about $4k of value loss. Plan a longer hold.
- Wayne County population projected at -17% by 2050 — secular population decline; favor cash flow + early exit over multi-decade hold.
Negotiation context
- Only 8 days on market — expect competitive offers; lowballing is unlikely to land.
- 10 sale attempts since 21y ago; this cycle's ask is 59% above the opening price — seller raised mid-cycle; expect resistance to lowballs.
- Current owner paid $84k; list at $135k implies a 61% gain — meaningful room to come down on a strong offer.
Risks & watch-outs
- Watch-outs: built in 1941 — expect roof / HVAC / electrical / plumbing capex.
Questions for the listing agent
- Built in 1941 — when were the roof, HVAC, electrical panel, plumbing, and water heater last replaced?
- Is there a deadline driving the sale (1031 exchange, divorce, estate, relocation)? That informs how much negotiation room exists.
- Schools are F-rated, which usually means shorter tenancies and higher turnover. Who's the typical renter profile here, and what's been the actual vacancy rate?
- Crime grade is F in this area — have there been break-ins, vandalism, or insurance claims at this property in the last 3 years? What carrier currently insures it and at what premium?
- The area grade is low — what's the realistic commute time and amenity access for the typical tenant pool here? Any planned neighborhood developments (good or bad) we should know about?
- What's the average days-on-market for RENTAL listings here right now (not sales)? A rising rental-DOM trend means longer vacancies and softer asking-rent achievability than the comps imply.
- What's the recent tenant-quality profile in this submarket — average credit score on applications, eviction rate, late-payment / NSF rate, and stable-employment percentage? A property-management company in the area should have these aggregated.
- How much new for-sale + rental construction is in the pipeline within 1–3 miles? Heavy new supply typically softens prices + rents 12–24 months out; constrained supply supports both.
Investment metrics
- 1% rule
- 1.07% ✓
- Cap rate
- 7.69%
- Cash-on-cash
- 4.98%
- DSCR
- 1.22
- GRM
- 7.8
CMA / ARV
- ARV (on-the-fly)
- $52,416
- Comps found
- 6
Show comp detail 6 sales within ~0.75 mi
| Address | Dist | Beds/Ba | Sqft | Sold | Price | $/sf | Match |
|---|---|---|---|---|---|---|---|
| 6339 Warwick St | 0.53mi | 3/1.0 (-1) | 725 (+8%) | 8mo | $75,000 | $103 | 51 |
| 7375 Brace St | 0.56mi | 3/1.0 (-1) | 711 (+6%) | 10mo | $18,500 | $26 | 50 |
| 6167 Faust Ave | 0.38mi | 3/1.0 (-1) | 730 (+9%) | 19mo | $55,000 | $75 | 48 |
| 7401 Greenview Ave | 0.55mi | 3/1.5 (-1) | 720 (+7%) | 21mo | $45,000 | $63 | 38 |
| 6394 Westwood St | 0.67mi | 3/1.0 (-1) | 770 (+15%) | 2mo | $90,000 | $117 | 38 |
| 6374 Grandville Ave | 0.61mi | 3/1.0 (-1) | 720 (+7%) | 22mo | $56,000 | $78 | 36 |
Match score weights: distance 35% · size 25% · config 20% · recency 20%. Top-matched comps best support the ARV.
Projected returns pro-forma
-3.0% appreciation · 0.0% rent growth · sell at horizon
- IRR
- -12.1%
- Equity multiple
- 0.58×
- Total profit
- $-16,065
- Equity at exit
- $20,129
- IRR
- -8.5%
- Equity multiple
- 0.54×
- Total profit
- $-17,292
- Equity at exit
- $11,672
Cash invested: $37,800 (down + closing). Projections, not guarantees.
Landlord ↔ Tenant lean methodology
- Overall (STATE)
- 62 Landlord-Friendly
- State Michigan
- 62 Landlord-Friendly · EVEN
- County
- — inherits STATE
- City
- — inherits STATE
ZIP-level market 48228
- Rents YoY
- -2.3%
- Active inventory
- 363
- Price-to-rent
- 7.8×
Monthly cashflow live
- Estimated rent
- $1,448 medium interval (Pro) →
- Mortgage (P&I)
- −$708
- Tax from tax record
- −$223 /mo · $2,676/yr
- Insurance
- −$56
- HOA
- −$0
- Vacancy / Maint / Mgmt
- −$304
- Net cashflow
- $157
Break-even live
Sensitivity live
| Price | -10% $233 | -5% $195 | +0% $157 | +5% $119 | +10% $81 |
|---|---|---|---|---|---|
| Rent | -10% $43 | -5% $100 | +0% $157 | +5% $214 | +10% $271 |
| Rate | -1.0pp $225 | -0.5pp $191 | base $157 | +0.5pp $122 | +1.0pp $86 |
UW: 25.0% down · 7.5% · 30yr · 1.5% tax · 5.0% vac · 8.0% maint · 8.0% mgmt
Financing live
Cash to close
- Down payment
- $33,750
- Closing costs
- $4,050
- Reserves months
- —
- Total cash needed
- —
Loan-product check · same deal, 3 products live
Conventional
25% down · 7.5% · 30yr
- Down + closing
- —
- Monthly P&I
- —
- Monthly cashflow
- —
- DSCR
- —
- Eligible?
- —
Personal DTI + credit; lowest rate.
DSCR
20% down · 8.5% · 30yr
- Down + closing
- —
- Monthly P&I
- —
- Monthly cashflow
- —
- DSCR
- —
- Eligible?
- —
No personal income docs; deal must DSCR.
Hard money
10% down · 12.0% · 12mo
- Down + closing
- —
- Monthly P&I
- —
- Monthly cashflow
- —
- DSCR
- —
- Eligible?
- —
Short-term bridge; refi at stabilization.
Rent comps 1 comps
| Address | Beds | Baths | Sqft | Rent | $/sqft | DOM | Units | Dist |
|---|---|---|---|---|---|---|---|---|
| 7635 Evergreen Ave Detroit, MI | 3.0 | 1.0 | 690 | $1,350 | $1.96 | 44d | 1 | 1.13mi |
Listing history 9 events
-
2026-06-18days on market $135,000 Active 8 DOM
-
2026-06-17days on market $135,000 Active 7 DOM
-
2026-06-16days on market $135,000 Active 6 DOM
-
2026-06-15days on market $135,000 Active 5 DOM
-
2026-06-13days on market $135,000 Active 3 DOM
-
2026-06-13remarks 264-char remark
-
2026-06-13statusdays on market $135,000 Active 2 DOM
-
2026-06-10remarks 261-char remark
-
2026-06-10$135,000 Coming Soon 1 DOM
ⓘ Source: listings_history table (triggers on properties + properties_extension) + one-shot
backfill from property_details.listing_events for pre-trigger history.
Tax reassessment forecast MI · Partial reset (capped growth)
- Current annual tax
- $2,676 · $223/mo
- Projected year-2 tax
- $2,676 · $223/mo
- Expected delta
- $0/yr ($0/mo · 0.0%)
ⓘ Screening estimate from a state-policy table — verify with the county assessor before closing.
Climate risk First Street
- Flood 1/10 Low FEMA zone X (unshaded) · 0% chance over 30 yrs
- Wildfire 1/10 Low
- Heat 3/10 Moderate 7 d/yr ≥97°F today · 15 d/yr by 30 yrs out
- Wind 2/10 Low
- Air quality 3/10 Moderate 2 unhealthy d/yr today · 4 by 30 yrs out
Nearby sold comps map
Loading sold comps map…
Walkable amenities ~0.75 mi
Loading nearby amenities…
Taxation est. · year 1
- Rental income
- $17,381
- − Mortgage interest
- −$7,562
- − Property taxes
- −$2,676
- − Insurance
- −$675
- − Repairs & maintenance
- −$1,390
- − Management
- −$1,390
- − Depreciation
- −$3,927
- Taxable loss
- −$241
- Est. tax savings @ 24.0%
- +$58
- After-tax cash flow
- $1,942/yr
For passive investors: Depreciation is non-cash, so a rental often shows a tax loss while cash-flowing — sheltering income. Rental losses are passive: they offset passive income freely, and up to $25,000/yr can offset ordinary (W-2) income if you actively participate and your MAGI is under $100k (phasing out to $0 by $150k); unused losses carry forward. On sale, claimed depreciation is recaptured at up to 25%, and gains may owe capital-gains tax (a 1031 exchange can defer both). Figures are a year-1 estimate at your 24.0% rate — not tax advice; consult a CPA.
Schools (NCES district)
- District
- Detroit Public Schools Community District
- NCES district ID
- 2601103
- Math proficiency
- 10% ▼ -2.00%
- Reading proficiency
- 24% ▲ 6.00%
- Median HH income
- $25,815
- Composite
- 13.06/100
- National rank
- #9564
- State rank
- #499 of 540 in MI
Livability — Detroit
- Score
- 73/100
- State rank
- #218
- US rank
- #5427
Category grades
Schools grade is shown separately in the Schools card above.
Census & demographics
- Census place
- Detroit, MI
- County
- Wayne County · 1,562,939 people
- City population
- 572,865
- Metro
- Detroit-Warren-Dearborn, MI
- Population (ZIP)
- 50,117
- Household income
- $30,680
- Rent vs Own
- Severe rent burden
- 4144.0
Population outlook (Wayne County) Hauer SSP2
- Today (2025)
- 1,675,273 people
- By 2030
- 1,620,300 · -3.3%
- By 2040
- 1,502,341 · -10.3%
- By 2050
- 1,384,039 · -17.4%
- By 2075
- 1,124,592 · -32.9%
- By 2100
- 881,193 · -47.4%
Race, ethnicity, and origin ACS 2023
- Neighborhood character
- Predominantly Black (71%)
- Race & ethnicity
- Black 71% White 16% Two or more races 7% Hispanic / Latino 6%
- Hispanic origin (detail)
- Mexican 3% Puerto Rican 2%
- Common ancestry
- Arab 2% Romanian 2% Lithuanian 1%
- Foreign-born
- 11% · Canada
- Languages at home
- 82% English-only · Arabic 11% Spanish 5%
Political lean MEDSL · Wayne
- 2024 margin
- Strong D (+29.0) · D 62.7% · R 33.7% · Other 3.6%
- 2008→2024 swing
- -20.5pp toward R · 2008: 49.5pp · 2024: 29.0pp
- All cycles
- 2024: D+29.0 2020: D+38.1 2016: D+37.3 2012: D+46.9 2008: D+49.5
Not yet ingested
- Civics
- —
Market trends
- HPI YoY
- ▼ -160.81%
- Current HPI
- 168.6843
- Rent YoY
- ▼ -2.30%
- Metro
- Detroit-Warren-Dearborn, MI
- State GDP YoY
- ▲ 1.37%
- F500 in state
- 28
Industry mix (Fortune 500 HQ in MI)
| Industry | F500 HQs | Revenue |
|---|---|---|
| Automotive Parts | 3 | $48B |
|
||
| Automotive | 2 | $372B |
|
||
| Chemicals | 1 | $45B |
|
||
| Automotive Retail | 1 | $29B |
|
||
| Healthcare / Medical Devices | 1 | $23B |
|
||
| Automotive Technology | 1 | $20B |
|
||
Price history
+58.8% since first listed26 events — show timeline
- 2026-06-09 Coming Soon $135,000 MiRealSource-MiMLS
- 2024-05-21 Sold (Public Records) $84,000 Public Records
- 2024-05-16 Sold (MLS) $84,000 MiRealSource-MiMLS
- 2024-05-16 Sold (MLS) $84,000 REALCOMP
- 2024-04-27 Pending — MiRealSource-MiMLS
- 2024-04-27 Pending — REALCOMP
- 2024-04-17 Listed $84,900 MiRealSource-MiMLS
- 2024-04-17 Listed $84,900 REALCOMP
- 2023-11-15 Pending — MiRealSource-MiMLS
- 2023-11-15 Pending — REALCOMP
- 2023-11-15 Listing Removed — MiRealSource-MiMLS
- 2023-11-15 Listing Removed — REALCOMP
- 2023-11-02 Relisted — MiRealSource-MiMLS
- 2023-11-02 Relisted — REALCOMP
- 2023-10-13 Pending — MiRealSource-MiMLS
- 2023-10-13 Pending — REALCOMP
- 2023-09-21 Listed $85,000 MiRealSource-MiMLS
- 2023-09-21 Listed $85,000 REALCOMP
- 2008-06-17 Sold (MLS) $10,700 REALCOMP
- 2008-03-29 Listed $12,900 REALCOMP
- 2008-03-13 Listing Removed — REALCOMP
- 2008-01-22 Listed $27,900 REALCOMP
- 2006-03-09 Listing Removed — REALCOMP
- 2005-10-13 Listed $69,900 REALCOMP
- 2005-09-28 Listing Removed — REALCOMP
- 2005-05-31 Listed $85,000 REALCOMP
Property tax history
+5.7%/yrLatest (2025): $2,676 · +162.7% YoY. Source: county tax records.
Cash-flow waterfall
monthlySold comps — $/sqft
last 12 mo · ≤1 miLoading sold comps…