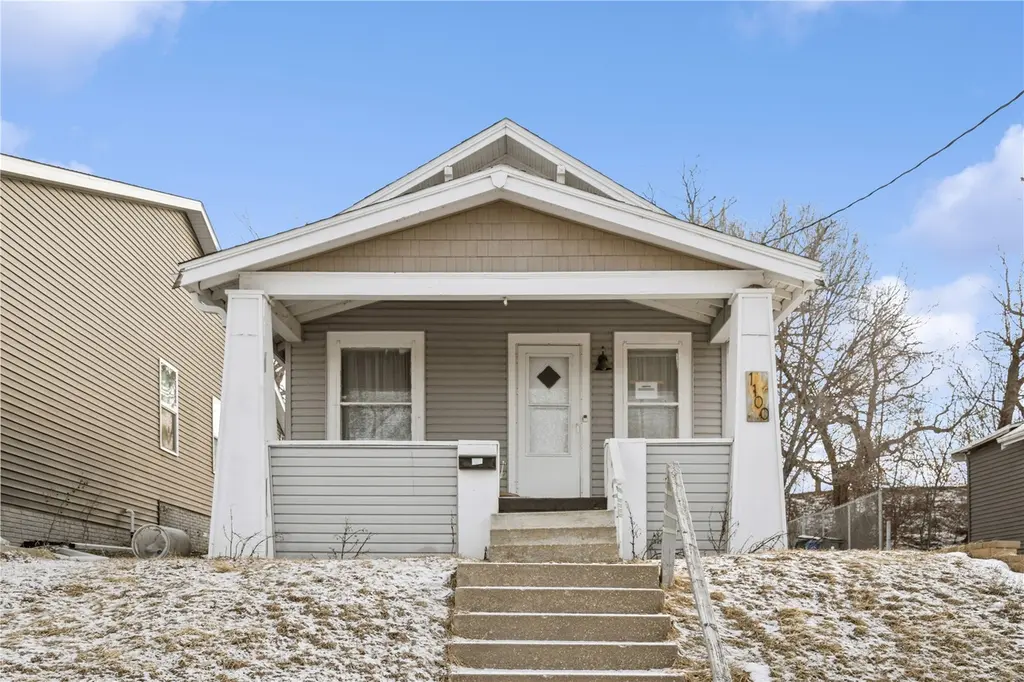
1100 15th St SE · Cedar Rapids, IA
Flood risk 1/10 · Minimal
- FEMA flood zone
- X (unshaded)
- Chance of flooding over 30 yrs
- 0.0%
- Est. flood insurance / yr
- $473 – $860
Fire risk 2/10 · Minimal
- Est. fire insurance / yr
- $902 – $1,676
Heat risk 3/10 · Minor
- Hot days now (above 103°F)
- 7 days/yr
- Hot days in 30 yrs
- 15 days/yr
Wind risk 2/10 · Minimal
- Chance of severe wind over 30 yrs
- —
Air-quality risk 2/10 · Minimal
- Unhealthy air days now
- 1 days/yr
- Unhealthy air days in 30 yrs
- 2 days/yr
Risk factors via First Street. Map © Google.
Why this score? — see what drove the B- grade
The composite is a weighted blend of 9 inputs, each scored 0–100. Each bar is that input's sub-score; the figure is the points it added to the 100-point composite (weight × sub-score).
- Cash flow +25.6/30.0
- DSCR +8.5/10.0
- Appreciation +7.1/10.0
- 1% rule +6.9/10.0
- Schools +4.7/10.0
- Livability +3.9/5.0
- ARV discount +3.6/15.0
- Rent growth +2.5/5.0
- Condition / age +2.5/5.0
$107,000
🖨 Deal sheet 📄 Offer letter ✓ Due diligence
Listing remarks MLS
Totally move in ready and oh-so-cute! Tiny house lovers unite!!! This home offers many updates including a new kitchen and bath, refinished hardwoods throughout, newer roof and siding, new light fixtures and paint throughout. Conveniently located near NewBo, downtown, the medical district, I-380, and shopping and dining options galore. Check this one out today!
Key facts
- 5,520 sq ft lot
- Built 1920
- Listed 136 days
Neighborhood map
What this means for you Summary
Snapshot
- This is a 2-bed/1.0-bath single-family listed at $107k.
Deal economics
- At list price, monthly cash flow is $254 ($3k/yr) — positive.
- The deal already cash-flows at list — no discount required.
- Meets the 1% rule at list price ($1k rent vs $107k).
- Recommended offer: $94k (12.0% below list) — sets the bar for market timing.
- Cap rate 9.1% vs local median 3.5% in Cedar Rapids — top-decile yield for the area; either an underpriced asset or a hidden risk that comps aren't pricing in. Stress-test before assuming the spread holds.
Location & tenants
- Location reads 78/100 on livability (#134 in IA, #2,474 nationally) — a middle-class / working-renter tenant base. Strengths: cost of living A+, housing A+, health & safety A+; Watch: crime C-, commute F.
- Cedar Rapids Community School District (urban): math 50% / reading 59% proficiency, ranked #265 of 289 in IA (top 92%) — acceptable for families but not a draw, mixed tenant base, ~2y average lease.
- Market conditions: 13 active listings in the ZIP; 2 comparable units currently listed for rent nearby; lower-income renter base — watch delinquency; 1,023 units permitted in Linn County in 2024 (456 in 5+ unit buildings).
- This rent runs 43% of the median local income ($35k/yr) — at the standard rent-burdened threshold; future hikes will face affordability resistance.
Forward outlook
- In year one you build about $5k of equity ($740 loan paydown + $4k appreciation (4.1% local appreciation)).
- Linn County population projected at +16% by 2050 — long-run rental-demand tailwind backs the buy-and-hold thesis.
- At projected returns (4.1% appreciation + 3.0% rent growth), your $30k cash investment doubles in ~4 years — after that, you're playing with house money.
- By year 7, paydown + projected appreciation supports a ~$33k cash-out refi (75% LTV) — recoverable capital for the next deal without selling this one.
Negotiation context
- It's been on market 137 days — a 12% lower offer ($94k) is reasonable based on typical stale-listing flexibility.
- 4 sale attempts since 5y ago with the ask held roughly flat each time — persistent listings suggest the price (not the market) is what's stuck; bring a comps-based counter.
- Current owner paid $90k; 18% above their basis — modest negotiation headroom, anchor on the comps not their cost.
Risks & watch-outs
- Watch-outs: built in 1920 — expect roof / HVAC / electrical / plumbing capex.
Questions for the listing agent
- It's been on market 137 days. Have you received any prior offers? Is the seller open to a 12% concession, seller financing, or rate buy-down credit?
- Built in 1920 — when were the roof, HVAC, electrical panel, plumbing, and water heater last replaced?
- Why hasn't it sold? Are there any deal-killer items the seller is aware of (foundation, flood, title, zoning, code violations)?
- Is there a deadline driving the sale (1031 exchange, divorce, estate, relocation)? That informs how much negotiation room exists.
- Schools are B-rated — typically a magnet for longer-tenancy family renters. What's the average tenant stay here, and is there a school-zone premium baked into asking?
- What's the average days-on-market for RENTAL listings here right now (not sales)? A rising rental-DOM trend means longer vacancies and softer asking-rent achievability than the comps imply.
- What's the recent tenant-quality profile in this submarket — average credit score on applications, eviction rate, late-payment / NSF rate, and stable-employment percentage? A property-management company in the area should have these aggregated.
- How much new for-sale + rental construction is in the pipeline within 1–3 miles? Heavy new supply typically softens prices + rents 12–24 months out; constrained supply supports both.
Investment metrics
- 1% rule
- 1.19% ✓
- Cap rate
- 9.14%
- Cash-on-cash
- 10.17%
- DSCR
- 1.45
- GRM
- 7.0
CMA / ARV
- ARV (median comp)
- $98,426
- List price
- $107,000
- Delta
- 8.71%
- Verdict
- FAIR
- Comps
- 16 within 1.0 mi
Show comp detail 9 sales within ~0.75 mi
| Address | Dist | Beds/Ba | Sqft | Sold | Price | $/sf | Match |
|---|---|---|---|---|---|---|---|
| 1020 9th St SE | 0.15mi | 2/1.0 | 708 (-2%) | 14mo | $80,000 | $113 | 78 |
| 1032 9th St SE | 0.14mi | 1/1.0 (-1) | 740 (+3%) | 8mo | $112,500 | $152 | 77 |
| 617 19th St St SE | 0.50mi | 2/1.0 | 720 (-0%) | 8mo | $48,500 | $67 | 70 |
| 1808 6th Ave Ave SE | 0.51mi | 2/1.0 | 720 (-0%) | 9mo | $120,000 | $167 | 69 |
| 1547 8th Avenue Ave SE | 0.28mi | 2/1.0 | 690 (-4%) | 14mo | $60,000 | $87 | 68 |
| 1915 Higley Ave SE | 0.41mi | 2/1.0 | 748 (+4%) | 10mo | $110,000 | $147 | 66 |
| 813 18th St SE | 0.37mi | 2/1.0 | 816 (+13%) | 0mo | $148,550 | $182 | 61 |
| 414 18th St SE | 0.59mi | 1/1.0 (-1) | 660 (-8%) | 5mo | $85,000 | $129 | 49 |
| 1706 5th Ave SE | 0.53mi | 1/1.5 (-1) | 678 (-6%) | 15mo | $77,500 | $114 | 45 |
Match score weights: distance 35% · size 25% · config 20% · recency 20%. Top-matched comps best support the ARV.
Projected returns pro-forma
4.14% appreciation · 3.0% rent growth · sell at horizon
- IRR
- 19.7%
- Equity multiple
- 2.19×
- Total profit
- $35,709
- Equity at exit
- $55,161
- IRR
- 20.1%
- Equity multiple
- 4.23×
- Total profit
- $96,722
- Equity at exit
- $90,954
Cash invested: $29,960 (down + closing). Projections, not guarantees.
Landlord ↔ Tenant lean methodology
- Overall (STATE)
- 83 Strongly Landlord-Friendly
- State Iowa
- 83 Strongly Landlord-Friendly · R+6
- County
- — inherits STATE
- City
- — inherits STATE
ZIP-level market 52401
- Home prices YoY
- 2.2%
- Active inventory
- 13
- Price-to-rent
- 7.0×
Monthly cashflow live
- Estimated rent
- $1,268 medium interval (Pro) →
- Mortgage (P&I)
- −$561
- Tax from tax record
- −$142 /mo · $1,708/yr
- Insurance
- −$45
- HOA
- −$0
- Vacancy / Maint / Mgmt
- −$266
- Net cashflow
- $254
Break-even live
UW: 25.0% down · 7.5% · 30yr · 1.5% tax · 5.0% vac · 8.0% maint · 8.0% mgmt
Financing live
Cash to close
- Down payment
- $26,750
- Closing costs
- $3,210
- Reserves months
- —
- Total cash needed
- —
Loan-product check · same deal, 3 products live
Conventional
25% down · 7.5% · 30yr
- Down + closing
- —
- Monthly P&I
- —
- Monthly cashflow
- —
- DSCR
- —
- Eligible?
- —
Personal DTI + credit; lowest rate.
DSCR
20% down · 8.5% · 30yr
- Down + closing
- —
- Monthly P&I
- —
- Monthly cashflow
- —
- DSCR
- —
- Eligible?
- —
No personal income docs; deal must DSCR.
Hard money
10% down · 12.0% · 12mo
- Down + closing
- —
- Monthly P&I
- —
- Monthly cashflow
- —
- DSCR
- —
- Eligible?
- —
Short-term bridge; refi at stabilization.
Rent comps 2 comps
| Address | Beds | Baths | Sqft | Rent | $/sqft | DOM | Units | Dist |
|---|---|---|---|---|---|---|---|---|
| 906 10th St SE Cedar Rapids, IA | 1.0–2.0 | 1.0–2.0 | 890 | $1,300 | $1.46 | 13d | 6 | 0.22mi |
| 400 2nd St SW Cedar Rapids, IA | 1.0 | 1.0 | 615 | $1,195 | $1.94 | 20d | 1 | 1.23mi |
Listing history 27 events
-
2026-06-19days on market $107,000 Active 137 DOM
-
2026-06-18days on market $107,000 Active 136 DOM
-
2026-06-17days on market $107,000 Active 135 DOM
-
2026-06-16days on market $107,000 Active 134 DOM
-
2026-06-15days on market $107,000 Active 133 DOM
-
2026-06-14days on market $107,000 Active 131 DOM
-
2026-06-13days on market $107,000 Active 130 DOM
-
2026-06-10days on market $107,000 Active 128 DOM
-
2026-06-09days on market $107,000 Active 127 DOM
-
2026-06-08days on market $107,000 Active 126 DOM
-
2026-06-07days on market $107,000 Active 125 DOM
-
2026-06-05days on market $107,000 Active 122 DOM
-
2026-06-03days on market $107,000 Active 121 DOM
-
2026-06-02days on market $107,000 Active 120 DOM
-
2026-06-01days on market $107,000 Active 119 DOM
-
2026-05-31days on market $107,000 Active 118 DOM
-
2026-05-30days on market $107,000 Active 117 DOM
-
2026-02-10price $107,000
-
2026-02-02$110,000 Active
-
2022-08-05soldstatus $90,500 Closed 363-char remark
Show marketing remark (363 chars)
Totally move in ready and oh-so-cute! Tiny house lovers unite!!! This home offers many updates including a new kitchen and bath, refinished hardwoods throughout, newer roof and siding, new light fixtures and paint throughout. Conveniently located near NewBo, downtown, the medical district, I-380, and shopping and dining options galore. Check this one out today!
-
2022-08-05soldstatus $90,500
Show marketing remark (363 chars)
Totally move in ready and oh-so-cute! Tiny house lovers unite!!! This home offers many updates including a new kitchen and bath, refinished hardwoods throughout, newer roof and siding, new light fixtures and paint throughout. Conveniently located near NewBo, downtown, the medical district, I-380, and shopping and dining options galore. Check this one out today!
-
2022-07-03historical 363-char remark
Show marketing remark (363 chars)
Totally move in ready and oh-so-cute! Tiny house lovers unite!!! This home offers many updates including a new kitchen and bath, refinished hardwoods throughout, newer roof and siding, new light fixtures and paint throughout. Conveniently located near NewBo, downtown, the medical district, I-380, and shopping and dining options galore. Check this one out today!
-
2022-05-23$89,000 363-char remark
Show marketing remark (363 chars)
Totally move in ready and oh-so-cute! Tiny house lovers unite!!! This home offers many updates including a new kitchen and bath, refinished hardwoods throughout, newer roof and siding, new light fixtures and paint throughout. Conveniently located near NewBo, downtown, the medical district, I-380, and shopping and dining options galore. Check this one out today!
-
2021-07-09soldstatus $17,500
-
2021-07-09soldstatus $17,500
-
2021-05-24$13,700
-
2021-05-24$13,700
ⓘ Source: listings_history table (triggers on properties + properties_extension) + one-shot
backfill from property_details.listing_events for pre-trigger history.
Tax reassessment forecast IA · Partial reset (capped growth)
- Current annual tax
- $1,708 · $142/mo
- Projected year-2 tax
- $1,708 · $142/mo
- Expected delta
- $0/yr ($0/mo · 0.0%)
ⓘ Screening estimate from a state-policy table — verify with the county assessor before closing.
Climate risk First Street
- Flood 1/10 Low FEMA zone X (unshaded) · 0% chance over 30 yrs
- Wildfire 2/10 Low
- Heat 3/10 Moderate 7 d/yr ≥103°F today · 15 d/yr by 30 yrs out
- Wind 2/10 Low
- Air quality 2/10 Low 1 unhealthy d/yr today · 2 by 30 yrs out
Nearby sold comps map
Loading sold comps map…
Walkable amenities ~0.75 mi
Loading nearby amenities…
Taxation est. · year 1
- Rental income
- $15,219
- − Mortgage interest
- −$5,994
- − Property taxes
- −$1,708
- − Insurance
- −$535
- − Repairs & maintenance
- −$1,218
- − Management
- −$1,218
- − Depreciation
- −$3,113
- Taxable income
- $1,434
- Est. tax owed @ 24.0%
- −$344
- After-tax cash flow
- $2,702/yr
For passive investors: Depreciation is non-cash, so a rental often shows a tax loss while cash-flowing — sheltering income. Rental losses are passive: they offset passive income freely, and up to $25,000/yr can offset ordinary (W-2) income if you actively participate and your MAGI is under $100k (phasing out to $0 by $150k); unused losses carry forward. On sale, claimed depreciation is recaptured at up to 25%, and gains may owe capital-gains tax (a 1031 exchange can defer both). Figures are a year-1 estimate at your 24.0% rate — not tax advice; consult a CPA.
Schools (NCES district)
- District
- Cedar Rapids Community School District
- NCES district ID
- 1906540
- Math proficiency
- 50% ▼ -12.00%
- Reading proficiency
- 59% ▼ -6.00%
- Median HH income
- $53,568
- Composite
- 46.82/100
- National rank
- #2378
- State rank
- #265 of 289 in IA
Livability — Cedar Rapids
- Score
- 78/100
- State rank
- #134
- US rank
- #2474
Category grades
Schools grade is shown separately in the Schools card above.
Census & demographics
- Census place
- Cedar Rapids, IA
- County
- Linn County · 179,860 people
- City population
- 137,154
- Metro
- Cedar Rapids, IA
- Population (ZIP)
- 2,181
- Household income
- $35,060
- Rent vs Own
- Severe rent burden
- 324.0
Population outlook (Linn County) Hauer SSP2
- Today (2025)
- 239,589 people
- By 2030
- 248,587 · +3.8%
- By 2040
- 264,817 · +10.5%
- By 2050
- 278,685 · +16.3%
- By 2075
- 311,754 · +30.1%
- By 2100
- 336,773 · +40.6%
Race, ethnicity, and origin ACS 2023
- Neighborhood character
- Predominantly White (66%)
- Race & ethnicity
- White 66% Black 19% Hispanic / Latino 7% Two or more races 6% Asian 3%
- Hispanic origin (detail)
- Mexican 5%
- Common ancestry
- Slovak 3% Portuguese 2% Lithuanian 2%
- Foreign-born
- 12% · Canada, China
- Languages at home
- 85% English-only · Spanish 4% Other Indo-European 3% French/Haitian/Cajun 2%
Political lean MEDSL · Linn
- 2024 margin
- Lean D (+9.9) · D 54.2% · R 44.3% · Other 1.4%
- 2008→2024 swing
- -11.6pp toward R · 2008: 21.5pp · 2024: 9.9pp
- All cycles
- 2024: D+9.9 2020: D+13.7 2016: D+9.0 2012: D+17.6 2008: D+21.5
Not yet ingested
- Civics
- —
Market trends
- HPI YoY
- ▲ 4.14%
- Current HPI
- 194.6053
- Rent YoY
- —
- Metro
- Cedar Rapids, IA
- State GDP YoY
- ▲ 2.48%
- F500 in state
- 4
Industry mix (Fortune 500 HQ in IA)
| Industry | F500 HQs | Revenue |
|---|---|---|
| Financial Services | 1 | $16B |
|
||
| Retail / Convenience | 1 | $15B |
|
||
Price history
+681.0% since first listed10 events — show timeline
- 2026-02-10 Price Changed $107,000 CRAAR, CDRMLS
- 2026-02-02 Listed $110,000 CRAAR, CDRMLS
- 2022-08-05 Sold (Public Records) $90,500 Public Records
- 2022-08-05 Sold (MLS) $90,500 CRAAR, CDRMLS
- 2022-07-03 Delisted — CRAAR, CDRMLS
- 2022-05-23 Listed $89,000 CRAAR, CDRMLS
- 2021-07-09 Sold (MLS) $17,500 RMLSA as Distributed by MLS Grid
- 2021-07-09 Sold (MLS) $17,500 MRED as Distributed by MLS Grid
- 2021-05-24 Listed $13,700 RMLSA as Distributed by MLS Grid
- 2021-05-24 Listed $13,700 MRED as Distributed by MLS Grid
Property tax history
+7.6%/yrLatest (2025): $1,708 · +6.9% YoY. Source: county tax records.
Cash-flow waterfall
monthlySold comps — $/sqft
last 12 mo · ≤1 miLoading sold comps…