478 W Wellington St · Carthage, TX
Flood risk 1/10 · Minimal
- FEMA flood zone
- X
- Chance of flooding over 30 yrs
- 0.0%
- Est. flood insurance / yr
- $507 – $1,088
Fire risk 4/10 · Minor
- Est. fire insurance / yr
- $1,222 – $2,270
Heat risk 7/10 · Major
- Hot days now (above 111°F)
- 7 days/yr
- Hot days in 30 yrs
- 24 days/yr
Wind risk 6/10 · Moderate
- Chance of severe wind over 30 yrs
- 70.0%
Air-quality risk 2/10 · Minimal
- Unhealthy air days now
- 0 days/yr
- Unhealthy air days in 30 yrs
- 1 days/yr
Risk factors via First Street. Map © Google.
Why this score? — see what drove the C grade
The composite is a weighted blend of 9 inputs, each scored 0–100. Each bar is that input's sub-score; the figure is the points it added to the 100-point composite (weight × sub-score).
- Cash flow +23.5/30.0
- DSCR +7.6/10.0
- ARV discount +7.5/15.0
- 1% rule +6.4/10.0
- Livability +3.6/5.0
- Schools +3.5/10.0
- Rent growth +2.5/5.0
- Condition / age +2.5/5.0
- Appreciation +0.0/10.0
$99,000
🖨 Deal sheet 📄 Offer letter ✓ Due diligence
Listing remarks
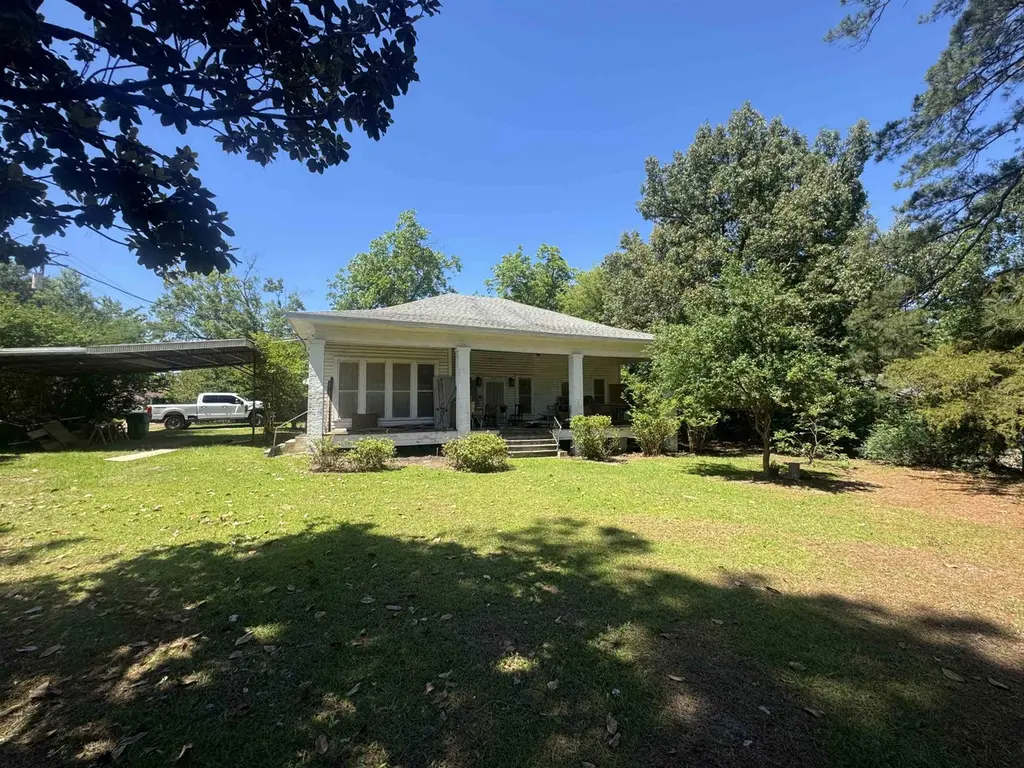
Step into the timeless character of this classic colonial-style home full of charm, space, and potential. Much of the work has been done making this a fantastic opportunity for someone looking to add the finishing touches and make it their own. Featuring beautiful architectural character, spacious living area, and a welcoming front porch, this home offers the perfect blend of historic appeal and renovation opportunity. Numerous updates have been made, including new electrical, plumbing, sheetrock, shiplap, cabinets on site that are ready for assemble, 2 mini split systems, ceilings fans, new 200 amp service, and new water heaters. Whether you are looking for a personal residence, investment
Key facts
- Colonial style home
- New plumbing
- New water heaters
Tags
Property features AI
Exterior
- Parking: Detached 2-car garage
- Utilities: Public water; Public sewer; Natural gas available
- Home design: Single-family residence; Residential property
- Construction: Composition roof
- Exterior features: Covered patio/porch; Corner, level lot
Interior
- Bedrooms: Total of 5 rooms (includes bedrooms and living spaces)
- Bathrooms: 1 full bathroom; 1 half bathroom
- Interior features: Gas and electric water heaters
Neighborhood map
What this means for you Summary
Snapshot
- This is a 2-bed/1.5-bath single-family listed at $99k.
Deal economics
- At list price, monthly cash flow is $185 ($2k/yr) — positive.
- The deal already cash-flows at list — no discount required.
- Meets the 1% rule at list price ($1k rent vs $99k).
- Recommended offer: $96k (3.0% below list) — sets the bar for market timing.
Location & tenants
- Location reads 72/100 on livability (#258 in TX) — a middle-class / working-renter tenant base. Strengths: cost of living A+, housing A+, health & safety A+; Watch: schools D+, employment D+, crime F.
- Carthage ISD (town): math 41% / reading 41% proficiency, ranked #364 of 826 in TX (top 44%) — families likely to look elsewhere, expect single-tenant / working-renter base with shorter leases.
- Market conditions: 140 active listings in the ZIP; 6 units permitted in Panola County in 2024 (0 in 5+ unit buildings).
Forward outlook
- Local home prices are declining (-3.0%/yr); year-one equity from $684 of loan paydown is wiped out by about $3k of value loss. Plan a longer hold.
- Panola County population projected at -14% by 2050 — secular population decline; favor cash flow + early exit over multi-decade hold.
Negotiation context
- It's been on market 31 days — a 3% lower offer ($96k) is reasonable based on typical stale-listing flexibility.
Risks & watch-outs
- Watch-outs: built in 1922 — expect roof / HVAC / electrical / plumbing capex.
- Climate carrying-cost: major wind risk, 70% chance of damaging wind over 30y; extreme-heat days projected 7→24/yr by 2055 (HVAC capex compounding) — expect insurance premiums to compound above CPI over the hold.
Questions for the listing agent
- It's been on market 31 days. Have you received any prior offers? Is the seller open to a 3% concession, seller financing, or rate buy-down credit?
- Built in 1922 — when were the roof, HVAC, electrical panel, plumbing, and water heater last replaced?
- Is there a deadline driving the sale (1031 exchange, divorce, estate, relocation)? That informs how much negotiation room exists.
- Schools are D-rated, which usually means shorter tenancies and higher turnover. Who's the typical renter profile here, and what's been the actual vacancy rate?
- Crime grade is F in this area — have there been break-ins, vandalism, or insurance claims at this property in the last 3 years? What carrier currently insures it and at what premium?
- What's the average days-on-market for RENTAL listings here right now (not sales)? A rising rental-DOM trend means longer vacancies and softer asking-rent achievability than the comps imply.
- What's the recent tenant-quality profile in this submarket — average credit score on applications, eviction rate, late-payment / NSF rate, and stable-employment percentage? A property-management company in the area should have these aggregated.
- How much new for-sale + rental construction is in the pipeline within 1–3 miles? Heavy new supply typically softens prices + rents 12–24 months out; constrained supply supports both.
Investment metrics
- 1% rule
- 1.14% ✓
- Cap rate
- 8.54%
- Cash-on-cash
- 8.02%
- DSCR
- 1.36
- GRM
- 7.3
CMA / ARV
No comps found within radius.
Projected returns pro-forma
-3.0% appreciation · 3.0% rent growth · sell at horizon
- IRR
- -4.1%
- Equity multiple
- 0.85×
- Total profit
- $-4,220
- Equity at exit
- $14,761
- IRR
- 5.7%
- Equity multiple
- 1.42×
- Total profit
- $11,629
- Equity at exit
- $8,560
Cash invested: $27,720 (down + closing). Projections, not guarantees.
Landlord ↔ Tenant lean methodology
- Overall (STATE)
- 87 Strongly Landlord-Friendly
- State Texas
- 87 Strongly Landlord-Friendly · R+5
- County
- — inherits STATE
- City
- — inherits STATE
ZIP-level market 75633
- Home prices YoY
- -27.3%
- Active inventory
- 140
- Price-to-rent
- 7.3×
Monthly cashflow live
- Estimated rent
- $1,125 medium interval (Pro) →
- Mortgage (P&I)
- −$519
- Tax from tax record
- −$143 /mo · $1,722/yr
- Insurance
- −$41
- HOA
- −$0
- Vacancy / Maint / Mgmt
- −$236
- Net cashflow
- $185
Break-even live
UW: 25.0% down · 7.5% · 30yr · 1.5% tax · 5.0% vac · 8.0% maint · 8.0% mgmt
Financing live
Cash to close
- Down payment
- $24,750
- Closing costs
- $2,970
- Reserves months
- —
- Total cash needed
- —
Loan-product check · same deal, 3 products live
Conventional
25% down · 7.5% · 30yr
- Down + closing
- —
- Monthly P&I
- —
- Monthly cashflow
- —
- DSCR
- —
- Eligible?
- —
Personal DTI + credit; lowest rate.
DSCR
20% down · 8.5% · 30yr
- Down + closing
- —
- Monthly P&I
- —
- Monthly cashflow
- —
- DSCR
- —
- Eligible?
- —
No personal income docs; deal must DSCR.
Hard money
10% down · 12.0% · 12mo
- Down + closing
- —
- Monthly P&I
- —
- Monthly cashflow
- —
- DSCR
- —
- Eligible?
- —
Short-term bridge; refi at stabilization.
Listing history 16 events
-
2026-06-18days on market $99,000 Active 31 DOM
-
2026-06-17days on market $99,000 Active 30 DOM
-
2026-06-16days on market $99,000 Active 29 DOM
-
2026-06-15days on market $99,000 Active 28 DOM
-
2026-06-13days on market $99,000 Active 26 DOM
-
2026-06-12days on market $99,000 Active 25 DOM
-
2026-06-09pricedays on market $99,000 Active 22 DOM
-
2026-06-08days on market $119,000 Active 21 DOM
-
2026-06-08days on market $119,000 Active 20 DOM
-
2026-06-07days on market $119,000 Active 19 DOM
-
2026-06-03days on market $119,000 Active 16 DOM
-
2026-06-02days on market $119,000 Active 15 DOM
-
2026-06-01days on market $119,000 Active 14 DOM
-
2026-05-31days on market $119,000 Active 13 DOM
-
2026-05-16$119,000 Active
-
2021-03-23soldstatus
ⓘ Source: listings_history table (triggers on properties + properties_extension) + one-shot
backfill from property_details.listing_events for pre-trigger history.
Tax reassessment forecast TX · Resets to sale price
- Current annual tax
- $1,722 · $143/mo
- Projected year-2 tax
- $1,812 · $151/mo
- Expected delta
- +$90/yr (+$8/mo · 5.2%)
ⓘ Screening estimate from a state-policy table — verify with the county assessor before closing.
Climate risk First Street
- Flood 1/10 Low FEMA zone X · 0% chance over 30 yrs
- Wildfire 4/10 Moderate
- Heat 7/10 Severe 7 d/yr ≥111°F today · 24 d/yr by 30 yrs out
- Wind 6/10 Major 70% chance of damaging wind over 30 yrs
- Air quality 2/10 Low 0 unhealthy d/yr today · 1 by 30 yrs out
Nearby sold comps map
Loading sold comps map…
Walkable amenities ~0.75 mi
Loading nearby amenities…
Taxation est. · year 1
- Rental income
- $13,505
- − Mortgage interest
- −$5,546
- − Property taxes
- −$1,722
- − Insurance
- −$495
- − Repairs & maintenance
- −$1,080
- − Management
- −$1,080
- − Depreciation
- −$2,880
- Taxable income
- $702
- Est. tax owed @ 24.0%
- −$168
- After-tax cash flow
- $2,054/yr
For passive investors: Depreciation is non-cash, so a rental often shows a tax loss while cash-flowing — sheltering income. Rental losses are passive: they offset passive income freely, and up to $25,000/yr can offset ordinary (W-2) income if you actively participate and your MAGI is under $100k (phasing out to $0 by $150k); unused losses carry forward. On sale, claimed depreciation is recaptured at up to 25%, and gains may owe capital-gains tax (a 1031 exchange can defer both). Figures are a year-1 estimate at your 24.0% rate — not tax advice; consult a CPA.
Schools (NCES district)
- District
- Carthage ISD
- NCES district ID
- 4813110
- Math proficiency
- 41% ▼ -3.00%
- Reading proficiency
- 41% ▼ -3.00%
- Median HH income
- $48,546
- Composite
- 35.19/100
- National rank
- #4997
- State rank
- #364 of 826 in TX
Livability — Carthage
- Score
- 72/100
- State rank
- #258
- US rank
- #6081
Category grades
Schools grade is shown separately in the Schools card above.
Census & demographics
- Census place
- Carthage, TX
- Population (ZIP)
- 12,999
Population outlook (Panola County) Hauer SSP2
- Today (2025)
- 23,273 people
- By 2030
- 22,845 · -1.8%
- By 2040
- 21,652 · -7.0%
- By 2050
- 20,107 · -13.6%
- By 2075
- 15,709 · -32.5%
- By 2100
- 11,013 · -52.7%
Race, ethnicity, and origin ACS 2023
- Neighborhood character
- Predominantly White (68%)
- Race & ethnicity
- White 68% Two or more races 15% Hispanic / Latino 14% Black 11%
- Hispanic origin (detail)
- Mexican 12%
- Common ancestry
- Lithuanian 5% Serbian 2% Slovak 2%
- Foreign-born
- 6% · Canada, Vietnam
- Languages at home
- 87% English-only · Spanish 11% Vietnamese 1% French/Haitian/Cajun 1%
Political lean MEDSL · Panola
- 2024 margin
- Solid R (+66.4) · D 16.7% · R 83.1%
- 2008→2024 swing
- -17.5pp toward R · 2008: -48.9pp · 2024: -66.4pp
- All cycles
- 2024: R+66.4 2020: R+63.5 2016: R+63.5 2012: R+56.1 2008: R+48.9
Not yet ingested
- Civics
- —
Market trends
- HPI YoY
- ▼ -60.73%
- Current HPI
- 162.0275
- Rent YoY
- —
- Metro
- —
- State GDP YoY
- ▲ 3.95%
- F500 in state
- 110
Industry mix (Fortune 500 HQ in TX)
| Industry | F500 HQs | Revenue |
|---|---|---|
| Energy | 16 | $1,198B |
|
||
| Technology | 5 | $198B |
|
||
| Engineering / Construction | 4 | $72B |
|
||
| Energy Services | 3 | $60B |
|
||
| Utilities | 3 | $41B |
|
||
| Healthcare | 2 | $330B |
|
||
Price history
2 events — show timeline
- 2026-05-16 Listed $119,000 LAAR
- 2021-03-23 Sold (Public Records) — Public Records
Property tax history
+4.0%/yrLatest (2025): $1,722 · +5.4% YoY. Source: county tax records.
Cash-flow waterfall
monthlySold comps — $/sqft
last 12 mo · ≤1 miLoading sold comps…