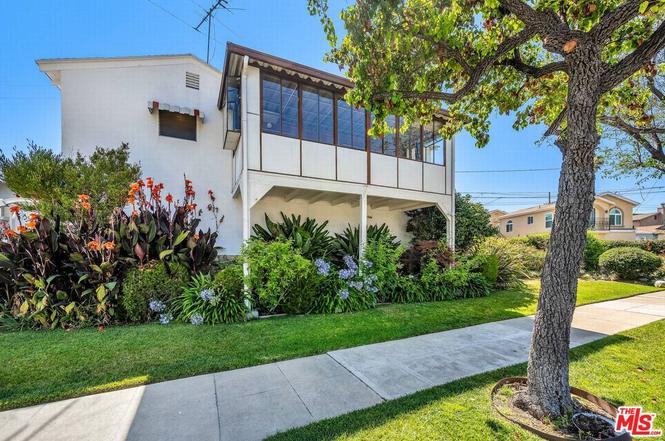
 Triplex
1301 N Cordova St · Burbank, CA
Flood risk 1/10 · Minimal
- FEMA flood zone
- X (unshaded)
- Chance of flooding over 30 yrs
- 0.0%
- Est. flood insurance / yr
- $507 – $1,088
Fire risk 1/10 · Minimal
- Est. fire insurance / yr
- $659 – $1,223
Heat risk 6/10 · Moderate
- Hot days now (above 97°F)
- 7 days/yr
- Hot days in 30 yrs
- 22 days/yr
Wind risk 1/10 · Minimal
- Chance of severe wind over 30 yrs
- —
Air-quality risk 6/10 · Moderate
- Unhealthy air days now
- 11 days/yr
- Unhealthy air days in 30 yrs
- 11 days/yr
Risk factors via First Street. Map © Google.
Why this score? — see what drove the C grade
The composite is a weighted blend of 9 inputs, each scored 0–100. Each bar is that input's sub-score; the figure is the points it added to the 100-point composite (weight × sub-score).
- Cash flow +23.6/30.0
- DSCR +7.6/10.0
- ARV discount +7.5/15.0
- 1% rule +6.1/10.0
- Schools +4.5/10.0
- Livability +3.7/5.0
- Rent growth +2.9/5.0
- Condition / age +2.2/5.0
- Appreciation +0.0/10.0
$1,049,000
🖨 Deal sheet 📄 Offer letter ✓ Due diligence
Multi-family units
County records classify this as Multi-Family (2-4 Unit). Listing-text estimate: 3 units. confirmed
Listing remarks
Amazing opportunity to remodel a great triplex fixer in PRIME Burbank to flip or to collect market rents in a thriving rental market! Delivered completely VACANT, this rare offering is ideal for investors, owner-users, or buyers looking to live in one unit while rental income from the others helps offset the mortgage. The property features a 2 bed/1 bath unit, a 1 bed/1 bath unit, and an upstairs 1 bed/1 bath unit with a huge sunroom/family room and beautiful mountain views. Each unit is separately metered for gas and electric, and each has its own water heater. Additional highlights include a separate laundry room for Units A and B, laundry hookups in the garage for Unit C, and three separ
Key facts
- Laundry hookups
- Mountain views
- 5,768 sq ft lot
Tags
Property features AI
Finance
- Other: Property listed as a fixer
- Financial info: Gross income: $99,000; Net operating income: $94,000; Total annual expenses: $5,000; Gross rent multiplier: 10.6; Vacancy rate listed as 100%; Units are rented (scheduled rents): Unit 1 $3,000, Unit 2 $2,750, Unit 3 $2,500
- HOA & community: Complex contains 3 units
Exterior
- Parking: Attached and detached garage options; Driveway; Total of 4 garage spaces; 4 total parking spaces
- Utilities: Owner pays water and gardener; Tenants pay electric and gas
- Home design: Residential income property (triplex); Two-level building; Single building with 3 units
- Construction: Has water heaters
- Exterior features: Landscaped lot; Gazebo; Mountain view; Alley access
Interior
- Kitchen: Microwave (included)
- Bedrooms: Unit 1: 2 bedrooms (main level); Unit 2: 1 bedroom; Unit 3: 1 bedroom
- Bathrooms: Unit 1: 1 bathroom; Unit 2: 1 bathroom; Unit 3: 1 bathroom
- Heating & cooling: Wall/window air conditioning units; Floor furnace heating; Wall heating (electric/other)
- Interior features: Main-level entry; Microwave; Laundry room
- Laundry & utility: Dedicated laundry room
Neighborhood map
What this means for you Summary
Snapshot
- This is a 3 × 4-bed/3.0-bath units multifamily listed at $1.05M. Condition is rated fair.
Deal economics
- At list price, monthly cash flow is $2k ($24k/yr) — positive. Per door: $660/mo.
- The deal already cash-flows at list — no discount required.
- Meets the 1% rule at list price ($12k rent vs $1.05M).
- Cap rate 8.6% vs local median 1.8% in Burbank — top-decile yield for the area; either an underpriced asset or a hidden risk that comps aren't pricing in. Stress-test before assuming the spread holds.
Location & tenants
- Location reads 73/100 on livability (#174 in CA) — a middle-class / working-renter tenant base. Strengths: amenities A+, employment A, commute A-; Watch: health & safety C-, crime F, cost of living F.
- Burbank Unified (urban): math 43% / reading 60% proficiency, ranked #128 of 517 in CA (top 25%) — acceptable for families but not a draw, mixed tenant base, ~2y average lease.
- Market conditions: Rents rising (+1.7%/yr); 57 active listings in the ZIP; solid renter incomes; 19,697 units permitted in Los Angeles County in 2024 (9,426 in 5+ unit buildings).
- At $11,684/mo this rent would consume 128% of the median local household income ($110k/yr) (locally 1749% of renters already pay >50% of income on rent) — very limited rent-growth headroom before tenants either downsize or default.
Forward outlook
- Local home prices are declining (-3.0%/yr); year-one equity from $7k of loan paydown is wiped out by about $31k of value loss. Plan a longer hold.
- Los Angeles County population projected at +9% by 2050 — modest demand growth; plan on rents tracking national, not racing it.
Negotiation context
- Only 2 days on market — expect competitive offers; lowballing is unlikely to land.
Risks & watch-outs
- Watch-outs: built in 1948 — expect roof / HVAC / electrical / plumbing capex.
- Climate carrying-cost: extreme-heat days projected 7→22/yr by 2055 (HVAC capex compounding) — expect insurance premiums to compound above CPI over the hold.
Questions for the listing agent
- Can we see the unit-by-unit rent roll, current vacancy, and any below-market leases? What's the average tenancy length?
- What capital expenditures (roof, boiler, parking lot, exteriors) have been made in the last 5 years, and what's planned in the next 2?
- Have any recent inspections been done? Can we get a copy of the seller's disclosures and any deferred-maintenance estimates?
- Built in 1948 — when were the roof, HVAC, electrical panel, plumbing, and water heater last replaced?
- Is there a deadline driving the sale (1031 exchange, divorce, estate, relocation)? That informs how much negotiation room exists.
- Schools are B-rated — typically a magnet for longer-tenancy family renters. What's the average tenant stay here, and is there a school-zone premium baked into asking?
- Crime grade is F in this area — have there been break-ins, vandalism, or insurance claims at this property in the last 3 years? What carrier currently insures it and at what premium?
- What's the average days-on-market for RENTAL listings here right now (not sales)? A rising rental-DOM trend means longer vacancies and softer asking-rent achievability than the comps imply.
- What's the recent tenant-quality profile in this submarket — average credit score on applications, eviction rate, late-payment / NSF rate, and stable-employment percentage? A property-management company in the area should have these aggregated.
- How much new apartment / multifamily construction is in the pipeline within 1–3 miles? Heavy new supply (>2% of stock underway) typically softens rents 12–24 months out; light construction supports rent growth.
Investment metrics
- 1% rule
- 1.11% ✓
- Cap rate
- 8.56%
- Cash-on-cash
- 8.09%
- DSCR
- 1.36
- GRM
- 7.5
CMA / ARV
No comps found within radius.
Projected returns pro-forma
-3.0% appreciation · 1.73% rent growth · sell at horizon
- IRR
- -5.4%
- Equity multiple
- 0.80×
- Total profit
- $-58,383
- Equity at exit
- $156,409
- IRR
- 2.7%
- Equity multiple
- 1.18×
- Total profit
- $53,364
- Equity at exit
- $90,698
Cash invested: $293,720 (down + closing). Projections, not guarantees.
Landlord ↔ Tenant lean methodology
- Overall (STATE)
- 18 Strongly Tenant-Friendly
- State California
- 18 Strongly Tenant-Friendly · D+13
- County
- — inherits STATE
- City
- — inherits STATE
ZIP-level market 91505
- Rents YoY
- 1.7%
- Active inventory
- 57
- Price-to-rent
- 22.4×
Monthly cashflow live
- Estimated rent
- $11,684 high interval (Pro) →
- Mortgage (P&I)
- −$5,501
- Tax est. 1.5%
- −$1,311 /mo · $15,735/yr
- Insurance
- −$437
- HOA
- −$0
- Vacancy / Maint / Mgmt
- −$2,454
- Net cashflow
- $1,981
Break-even live
3-unit breakdown (identical units grouped — click to expand)
| Units | Beds | Baths | Est. rent |
|---|---|---|---|
| 3× units | 4 | 3 | $11,685 |
| #1 | 4 | 3 | $3,895 |
| #2 | 4 | 3 | $3,895 |
| #3 | 4 | 3 | $3,895 |
| Total (3 units) | $11,684 | ||
UW: 25.0% down · 7.5% · 30yr · 1.5% tax · 5.0% vac · 8.0% maint · 8.0% mgmt
Financing live
Cash to close
- Down payment
- $262,250
- Closing costs
- $31,470
- Reserves months
- —
- Total cash needed
- —
Loan-product check · same deal, 3 products live
Conventional
25% down · 7.5% · 30yr
- Down + closing
- —
- Monthly P&I
- —
- Monthly cashflow
- —
- DSCR
- —
- Eligible?
- —
Personal DTI + credit; lowest rate.
DSCR
20% down · 8.5% · 30yr
- Down + closing
- —
- Monthly P&I
- —
- Monthly cashflow
- —
- DSCR
- —
- Eligible?
- —
No personal income docs; deal must DSCR.
Hard money
10% down · 12.0% · 12mo
- Down + closing
- —
- Monthly P&I
- —
- Monthly cashflow
- —
- DSCR
- —
- Eligible?
- —
Short-term bridge; refi at stabilization.
Listing history 3 events
-
2026-06-18days on market $1,049,000 Active 2 DOM
-
2026-06-17remarks 699-char remark
-
2026-06-17$1,049,000 Active 1 DOM
ⓘ Source: listings_history table (triggers on properties + properties_extension) + one-shot
backfill from property_details.listing_events for pre-trigger history.
Climate risk First Street
- Flood 1/10 Low FEMA zone X (unshaded) · 0% chance over 30 yrs
- Wildfire 1/10 Low
- Heat 6/10 Major 7 d/yr ≥97°F today · 22 d/yr by 30 yrs out
- Wind 1/10 Low
- Air quality 6/10 Major 11 unhealthy d/yr today · 11 by 30 yrs out
Nearby sold comps map
Loading sold comps map…
Walkable amenities ~0.75 mi
Loading nearby amenities…
Taxation est. · year 1
- Rental income
- $140,208
- − Mortgage interest
- −$58,760
- − Property taxes
- −$15,735
- − Insurance
- −$5,245
- − Repairs & maintenance
- −$11,217
- − Management
- −$11,217
- − Depreciation
- −$30,516
- Taxable income
- $7,518
- Est. tax owed @ 24.0%
- −$1,804
- After-tax cash flow
- $21,967/yr
For passive investors: Depreciation is non-cash, so a rental often shows a tax loss while cash-flowing — sheltering income. Rental losses are passive: they offset passive income freely, and up to $25,000/yr can offset ordinary (W-2) income if you actively participate and your MAGI is under $100k (phasing out to $0 by $150k); unused losses carry forward. On sale, claimed depreciation is recaptured at up to 25%, and gains may owe capital-gains tax (a 1031 exchange can defer both). Figures are a year-1 estimate at your 24.0% rate — not tax advice; consult a CPA.
Condition & rehab AI · 12 photos
This triplex fixer-upper requires moderate renovations to bring it up to current standards, with a focus on updating the kitchen and bathrooms to improve both resale and rental value.
Repairs flagged
- Major kitchen cabinets — dated and worn
- Major bathroom fixtures — outdated and in poor condition
- Major interior walls — pink walls with peeling paint
Value-add opportunities
- Both paint interior walls — enhances curb appeal and interior aesthetics
- Both replace kitchen cabinets — modernizes the space and improves functionality
- Both update bathroom fixtures — modernizes the space and improves functionality
Renovation cost estimate screening
| Repair item | Severity | Est. cost |
|---|---|---|
| kitchen cabinets · dated and worn | Major | $15,000–50,000 |
| bathroom fixtures · outdated and in poor condition | Major | $15,000–50,000 |
| interior walls · pink walls with peeling paint | Major | $15,000–50,000 |
| Total estimated repair cost · 3 items | $45,000–150,000 |
Value-add ROI direction
- Both paint interior walls — enhances curb appeal and interior aesthetics ↑
- Both replace kitchen cabinets — modernizes the space and improves functionality ↑
- Both update bathroom fixtures — modernizes the space and improves functionality ↑
ⓘ Cost ranges are severity-bucket heuristics (US national rule-of-thumb). Get contractor quotes + a written scope before underwriting a rehab budget.
Schools (NCES district)
- District
- Burbank Unified
- NCES district ID
- 0606450
- Math proficiency
- 43% ▼ -8.00%
- Reading proficiency
- 60% ▼ -5.00%
- Median HH income
- $65,970
- Composite
- 45.49/100
- National rank
- #2612
- State rank
- #128 of 517 in CA
Livability — Burbank
- Score
- 73/100
- State rank
- #174
- US rank
- #5646
Category grades
Schools grade is shown separately in the Schools card above.
Census & demographics
- Census place
- Burbank, CA
- County
- Los Angeles County · 9,444,647 people
- City population
- 108,034
- Metro
- Los Angeles-Long Beach-Anaheim, CA
- Population (ZIP)
- 31,744
- Household income
- $109,953
- Rent vs Own
- Severe rent burden
- 1749.0
Population outlook (Los Angeles County) Hauer SSP2
- Today (2025)
- 10,940,515 people
- By 2030
- 11,256,481 · +2.9%
- By 2040
- 11,729,929 · +7.2%
- By 2050
- 11,948,407 · +9.2%
- By 2075
- 11,818,114 · +8.0%
- By 2100
- 10,842,928 · -0.9%
Race, ethnicity, and origin ACS 2023
- Neighborhood character
- Diverse neighborhood (Simpson 0.66)
- Race & ethnicity
- White 50% Hispanic / Latino 29% Two or more races 19% Asian 10% Black 3%
- Hispanic origin (detail)
- Mexican 20%
- Common ancestry
- Slovak 3% Romanian 2% Italian 2%
- Foreign-born
- 18% · Canada, China, South Korea
- Languages at home
- 73% English-only · Spanish 14% Other Indo-European 4% Other Asian/Pacific 3%
Political lean MEDSL · Los Angeles
- 2024 margin
- Solid D (+32.9) · D 64.8% · R 31.9% · Other 3.3%
- 2008→2024 swing
- -7.4pp toward R · 2008: 40.4pp · 2024: 32.9pp
- All cycles
- 2024: D+32.9 2020: D+44.2 2016: D+48.0 2012: D+40.0 2008: D+40.4
Not yet ingested
- Civics
- —
Market trends
- HPI YoY
- ▼ -1290.12%
- Current HPI
- 409.4762
- Rent YoY
- ▲ 1.73%
- Metro
- Los Angeles-Long Beach-Anaheim, CA
- State GDP YoY
- ▲ 3.21%
- F500 in state
- 116
Industry mix (Fortune 500 HQ in CA)
| Industry | F500 HQs | Revenue |
|---|---|---|
| Technology | 27 | $1,492B |
|
||
| Financial Services | 3 | $174B |
|
||
| Retail | 3 | $44B |
|
||
| Insurance | 3 | $26B |
|
||
| Media / Entertainment | 2 | $115B |
|
||
| Pharmaceuticals / Biotech | 2 | $62B |
|
||
Price history
1 event — show timeline
- 2026-06-16 Listed $1,049,000 TheMLS
Cash-flow waterfall
monthlySold comps — $/sqft
last 12 mo · ≤1 miLoading sold comps…