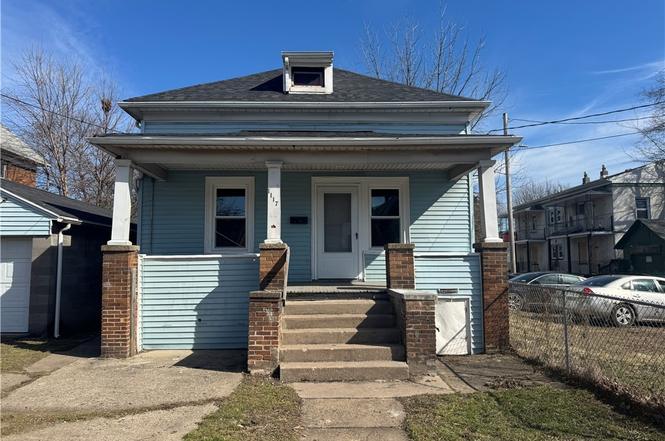
1117 13th St · Niagara Falls, NY
Flood risk 1/10 · Minimal
- FEMA flood zone
- X (unshaded)
- Chance of flooding over 30 yrs
- 0.0%
- Est. flood insurance / yr
- $473 – $860
Fire risk 3/10 · Minor
- Est. fire insurance / yr
- $691 – $1,283
Heat risk 3/10 · Minor
- Hot days now (above 94°F)
- 7 days/yr
- Hot days in 30 yrs
- 15 days/yr
Wind risk 1/10 · Minimal
- Chance of severe wind over 30 yrs
- —
Air-quality risk 3/10 · Minor
- Unhealthy air days now
- 2 days/yr
- Unhealthy air days in 30 yrs
- 3 days/yr
Risk factors via First Street. Map © Google.
Why this score? — see what drove the B grade
The composite is a weighted blend of 9 inputs, each scored 0–100. Each bar is that input's sub-score; the figure is the points it added to the 100-point composite (weight × sub-score).
- Cash flow +30.0/30.0
- 1% rule +10.0/10.0
- DSCR +10.0/10.0
- Appreciation +10.0/10.0
- Rent growth +4.7/5.0
- Livability +3.0/5.0
- Schools +2.5/10.0
- Condition / age +2.5/5.0
- ARV discount +0.0/15.0
$67,900
🖨 Deal sheet 📄 Offer letter ✓ Due diligence
Listing remarks MLS
Newly renovated home. New windows, new bathroom, new carpets and vinyl flooring. High ceilings and light fittings. Some new kitchen cabinets , new counter top and sink. Updated electrical panel. Large solid basement. Detached garage that opens out into the large backyard making for extra parking.
Key facts
- Fresh paint
- Newer flooring
- Newer windows
Tags
Neighborhood map
What this means for you Summary
Snapshot
- This is a 3-bed/1.5-bath single-family listed at $68k.
Deal economics
- At list price, monthly cash flow is $464 ($6k/yr) — positive.
- The deal already cash-flows at list — no discount required.
- Meets the 1% rule at list price ($1k rent vs $68k).
- Cap rate 14.5% vs local median 7.7% in Niagara Falls — top-decile yield for the area; either an underpriced asset or a hidden risk that comps aren't pricing in. Stress-test before assuming the spread holds.
Location & tenants
- Location reads 60/100 on livability (#956 in NY) — a middle-class / working-renter tenant base. Strengths: cost of living A+, housing A+; Watch: schools F, crime F, amenities F.
- Niagara Falls City School District (urban): math 26% / reading 34% proficiency, ranked #578 of 590 in NY (top 98%) — families likely to look elsewhere, expect single-tenant / working-renter base with shorter leases; 66% free/reduced lunch — lower-income household profile, screen leases tightly.
- Market conditions: Rents rising fast (+8.8%/yr); 164 active listings in the ZIP; 16 comparable units currently listed for rent nearby; rentals at typical pace (median 17d on market — plan ~3-4 weeks tenant-placement turnaround); lower-income renter base — watch delinquency; 167 units permitted in Niagara County in 2024 (0 in 5+ unit buildings).
- This rent runs 44% of the median local income ($35k/yr) — at the standard rent-burdened threshold; future hikes will face affordability resistance.
Forward outlook
- In year one you build about $7k of equity ($469 loan paydown + $7k appreciation (10.0% local appreciation)).
- Niagara County population projected at -19% by 2050 — secular population decline; favor cash flow + early exit over multi-decade hold.
- At projected returns (10.0% appreciation + 8.0% rent growth), your $19k cash investment doubles in ~2 years — after that, you're playing with house money.
- By year 5, paydown + projected appreciation supports a ~$34k cash-out refi (75% LTV) — recoverable capital for the next deal without selling this one.
Negotiation context
- Only 8 days on market — expect competitive offers; lowballing is unlikely to land.
- 2 sale attempts with the ask held roughly flat each time — persistent listings suggest the price (not the market) is what's stuck; bring a comps-based counter.
Risks & watch-outs
- Watch-outs: property tax is 2.7% of price; built in 1900 — expect roof / HVAC / electrical / plumbing capex.
Questions for the listing agent
- Built in 1900 — when were the roof, HVAC, electrical panel, plumbing, and water heater last replaced?
- Property tax is high relative to price — has the assessment been appealed recently, and will the sale trigger a re-assessment?
- Is there a deadline driving the sale (1031 exchange, divorce, estate, relocation)? That informs how much negotiation room exists.
- Schools are F-rated, which usually means shorter tenancies and higher turnover. Who's the typical renter profile here, and what's been the actual vacancy rate?
- Crime grade is F in this area — have there been break-ins, vandalism, or insurance claims at this property in the last 3 years? What carrier currently insures it and at what premium?
- What's the average days-on-market for RENTAL listings here right now (not sales)? A rising rental-DOM trend means longer vacancies and softer asking-rent achievability than the comps imply.
- What's the recent tenant-quality profile in this submarket — average credit score on applications, eviction rate, late-payment / NSF rate, and stable-employment percentage? A property-management company in the area should have these aggregated.
- How much new for-sale + rental construction is in the pipeline within 1–3 miles? Heavy new supply typically softens prices + rents 12–24 months out; constrained supply supports both.
Investment metrics
- 1% rule
- 1.86% ✓
- Cap rate
- 14.49%
- Cash-on-cash
- 29.27%
- DSCR
- 2.30
- GRM
- 4.5
CMA / ARV
- ARV (on-the-fly)
- $51,952
- Comps found
- 9
Show comp detail 9 sales within ~0.75 mi
| Address | Dist | Beds/Ba | Sqft | Sold | Price | $/sf | Match |
|---|---|---|---|---|---|---|---|
| 1336 Elmwood Ave | 0.10mi | 2/1.0 (-1) | 804 (+5%) | 17mo | $50,000 | $62 | 66 |
| 636 Elmwood Ave | 0.45mi | 2/1.0 (-1) | 705 (-8%) | 1mo | $48,000 | $68 | 58 |
| 1130 Michigan Ave | 0.36mi | 2/1.0 (-1) | 800 (+5%) | 21mo | $23,000 | $29 | 51 |
| 1102 22nd St | 0.52mi | 2/1.5 (-1) | 720 (-6%) | 16mo | $87,000 | $121 | 48 |
| 507 19th St | 0.68mi | 2/1.0 (-1) | 800 (+5%) | 12mo | $16,900 | $21 | 43 |
| 1715 North Ave | 0.74mi | 2/1.0 (-1) | 748 (-2%) | 17mo | $56,000 | $75 | 41 |
| 1610 Walnut Ave | 0.47mi | 3/1.0 | 840 (+10%) | 24mo | $30,000 | $36 | 40 |
| 1364 North Ave | 0.71mi | 2/1.0 (-1) | 805 (+5%) | 14mo | $74,900 | $93 | 39 |
| 2016 Ferry Ave | 0.74mi | 2/1.0 (-1) | 720 (-6%) | 18mo | $65,000 | $90 | 34 |
Match score weights: distance 35% · size 25% · config 20% · recency 20%. Top-matched comps best support the ARV.
Projected returns pro-forma
10.0% appreciation · 8.0% rent growth · sell at horizon
- IRR
- 49.8%
- Equity multiple
- 4.85×
- Total profit
- $73,254
- Equity at exit
- $61,170
- IRR
- 45.8%
- Equity multiple
- 12.00×
- Total profit
- $209,167
- Equity at exit
- $131,915
Cash invested: $19,012 (down + closing). Projections, not guarantees.
Landlord ↔ Tenant lean methodology
- Overall (STATE)
- 15 Strongly Tenant-Friendly
- State New York
- 15 Strongly Tenant-Friendly · D+10
- County
- — inherits STATE
- City
- — inherits STATE
ZIP-level market 14301
- Home prices YoY
- 6.2%
- Rents YoY
- 8.8%
- Active inventory
- 164
- Price-to-rent
- 4.5×
Monthly cashflow live
- Estimated rent
- $1,264 high interval (Pro) →
- Mortgage (P&I)
- −$356
- Tax from tax record
- −$151 /mo · $1,808/yr
- Insurance
- −$28
- HOA
- −$0
- Vacancy / Maint / Mgmt
- −$265
- Net cashflow
- $464
Break-even live
UW: 25.0% down · 7.5% · 30yr · 1.5% tax · 5.0% vac · 8.0% maint · 8.0% mgmt
Financing live
Cash to close
- Down payment
- $16,975
- Closing costs
- $2,037
- Reserves months
- —
- Total cash needed
- —
Loan-product check · same deal, 3 products live
Conventional
25% down · 7.5% · 30yr
- Down + closing
- —
- Monthly P&I
- —
- Monthly cashflow
- —
- DSCR
- —
- Eligible?
- —
Personal DTI + credit; lowest rate.
DSCR
20% down · 8.5% · 30yr
- Down + closing
- —
- Monthly P&I
- —
- Monthly cashflow
- —
- DSCR
- —
- Eligible?
- —
No personal income docs; deal must DSCR.
Hard money
10% down · 12.0% · 12mo
- Down + closing
- —
- Monthly P&I
- —
- Monthly cashflow
- —
- DSCR
- —
- Eligible?
- —
Short-term bridge; refi at stabilization.
Rent comps 16 comps
| Address | Beds | Baths | Sqft | Rent | $/sqft | DOM | Units | Dist |
|---|---|---|---|---|---|---|---|---|
| 754 15th St Niagara Falls, NY | 3.0 | 1.0 | 990 | $1,100 | $1.11 | 23d | 1 | 0.27mi |
| 613 13th St Unit 1 Niagara Falls, NY | 2.0 | 1.0 | 750 | $1,100 | $1.47 | 16d | 1 | 0.44mi |
| 769 19th St Niagara Falls, NY | 2.0 | 1.5 | 960 | $1,400 | $1.46 | 21d | 1 | 0.47mi |
| 616 7th St Niagara Falls, NY | 2.0 | 1.0 | 770 | $1,150 | $1.49 | 23d | 1 | 0.59mi |
| 1817 Ontario Ave Unit 1 Niagara Falls, NY | 2.0 | 1.0 | 999 | $1,899 | $1.90 | 1d | 1 | 0.71mi |
| 1817 Ontario Ave Unit 2 Niagara Falls, NY | 2.0 | 1.0 | 985 | $1,899 | $1.93 | 1d | 1 | 0.71mi |
| 1427 Fort Ave Unit 2 Niagara Falls, NY | 3.0 | 1.0 | 1058 | $950 | $0.90 | 43d | 1 | 0.73mi |
| 420 18th St Unit Upper Niagara Falls, NY | 2.0 | 1.0 | 816 | $1,150 | $1.41 | 43d | 1 | 0.81mi |
| 2473 Pierce Ave Unit 2 Niagara Falls, NY | 2.0 | 1.0 | 1000 | $1,200 | $1.20 | 3d | 1 | 0.83mi |
| 2463 South Ave Niagara Falls, NY | 2.0 | 1.0 | 1008 | $1,100 | $1.09 | 16d | 1 | 0.91mi |
| 434 23rd St Unit Upper Niagara Falls, NY | 2.0 | 1.0 | 816 | $1,100 | $1.35 | 14d | 1 | 0.95mi |
| 1780 Falls St Niagara Falls, NY | 2.0 | 1.0 | 1100 | $1,200 | $1.09 | 43d | 1 | 0.96mi |
| 2814 10th St Niagara Falls, NY | 2.0 | 1.0 | 900 | $900 | $1.00 | 1d | 1 | 0.98mi |
| 420 25th St Niagara Falls, NY | 3.0 | 1.0 | 1101 | $1,500 | $1.36 | 43d | 1 | 1.08mi |
| 2727 Monroe Ave Niagara Falls, NY | 3.0 | 1.0 | 960 | $1,500 | $1.56 | 10d | 1 | 1.21mi |
| 3036 Welch Ave Niagara Falls, NY | 3.0 | 1.0 | 1000 | $1,500 | $1.50 | 1d | 1 | 1.44mi |
Listing history 7 events
-
2026-03-18status Pending
-
2026-03-10$67,900 Active
-
2025-12-01soldstatus $79,900 Closed 297-char remark
Show marketing remark (297 chars)
Newly renovated home. New windows, new bathroom, new carpets and vinyl flooring. High ceilings and light fittings. Some new kitchen cabinets , new counter top and sink. Updated electrical panel. Large solid basement. Detached garage that opens out into the large backyard making for extra parking.
-
2025-11-07status Pending 297-char remark
Show marketing remark (297 chars)
Newly renovated home. New windows, new bathroom, new carpets and vinyl flooring. High ceilings and light fittings. Some new kitchen cabinets , new counter top and sink. Updated electrical panel. Large solid basement. Detached garage that opens out into the large backyard making for extra parking.
-
2025-10-10price $79,900 297-char remark
Show marketing remark (297 chars)
Newly renovated home. New windows, new bathroom, new carpets and vinyl flooring. High ceilings and light fittings. Some new kitchen cabinets , new counter top and sink. Updated electrical panel. Large solid basement. Detached garage that opens out into the large backyard making for extra parking.
-
2025-09-15$85,000 Active 297-char remark
Show marketing remark (297 chars)
Newly renovated home. New windows, new bathroom, new carpets and vinyl flooring. High ceilings and light fittings. Some new kitchen cabinets , new counter top and sink. Updated electrical panel. Large solid basement. Detached garage that opens out into the large backyard making for extra parking.
-
2004-10-26soldstatus $19,000
ⓘ Source: listings_history table (triggers on properties + properties_extension) + one-shot
backfill from property_details.listing_events for pre-trigger history.
Tax reassessment forecast NY · Partial reset (capped growth)
- Current annual tax
- $1,808 · $151/mo
- Projected year-2 tax
- $1,808 · $151/mo
- Expected delta
- $0/yr ($0/mo · 0.0%)
ⓘ Screening estimate from a state-policy table — verify with the county assessor before closing.
Climate risk First Street
- Flood 1/10 Low FEMA zone X (unshaded) · 0% chance over 30 yrs
- Wildfire 3/10 Moderate
- Heat 3/10 Moderate 7 d/yr ≥94°F today · 15 d/yr by 30 yrs out
- Wind 1/10 Low
- Air quality 3/10 Moderate 2 unhealthy d/yr today · 3 by 30 yrs out
Nearby sold comps map
Loading sold comps map…
Walkable amenities ~0.75 mi
Loading nearby amenities…
Taxation est. · year 1
- Rental income
- $15,171
- − Mortgage interest
- −$3,803
- − Property taxes
- −$1,808
- − Insurance
- −$340
- − Repairs & maintenance
- −$1,214
- − Management
- −$1,214
- − Depreciation
- −$1,975
- Taxable income
- $4,817
- Est. tax owed @ 24.0%
- −$1,156
- After-tax cash flow
- $4,408/yr
For passive investors: Depreciation is non-cash, so a rental often shows a tax loss while cash-flowing — sheltering income. Rental losses are passive: they offset passive income freely, and up to $25,000/yr can offset ordinary (W-2) income if you actively participate and your MAGI is under $100k (phasing out to $0 by $150k); unused losses carry forward. On sale, claimed depreciation is recaptured at up to 25%, and gains may owe capital-gains tax (a 1031 exchange can defer both). Figures are a year-1 estimate at your 24.0% rate — not tax advice; consult a CPA.
Schools (NCES district)
- District
- Niagara Falls City School District
- NCES district ID
- 3620820
- Math proficiency
- 26% ▼ -10.00%
- Reading proficiency
- 34% ▲ 3.00%
- Median HH income
- $32,488
- Composite
- 24.5/100
- National rank
- #7655
- State rank
- #578 of 590 in NY
Livability — Niagara Falls
- Score
- 60/100
- State rank
- #956
- US rank
- #18749
Category grades
Schools grade is shown separately in the Schools card above.
Census & demographics
- Census place
- Niagara Falls, NY
- County
- Niagara County · 157,377 people
- City population
- 62,983
- Metro
- Buffalo-Cheektowaga, NY
- Population (ZIP)
- 10,923
- Household income
- $34,549
- Rent vs Own
- Severe rent burden
- 954.0
Population outlook (Niagara County) Hauer SSP2
- Today (2025)
- 204,149 people
- By 2030
- 197,900 · -3.1%
- By 2040
- 182,239 · -10.7%
- By 2050
- 165,198 · -19.1%
- By 2075
- 129,416 · -36.6%
- By 2100
- 96,222 · -52.9%
Race, ethnicity, and origin ACS 2023
- Neighborhood character
- Diverse neighborhood (Simpson 0.58)
- Race & ethnicity
- White 59% Black 25% Two or more races 8% Hispanic / Latino 8% Asian 2%
- Hispanic origin (detail)
- Puerto Rican 3% Cuban 2%
- Common ancestry
- Romanian 6% Slovak 2% Lithuanian 1%
- Foreign-born
- 5% · Canada, China, Dominican Republic
- Languages at home
- 90% English-only · Spanish 6% Other Indo-European 3% Chinese 1%
Political lean MEDSL · Niagara
- 2024 margin
- R (+14.9) · D 42.5% · R 57.5%
- 2008→2024 swing
- -15.9pp toward R · 2008: 1.0pp · 2024: -14.9pp
- All cycles
- 2024: R+14.9 2020: R+9.7 2016: R+19.0 2012: D+0.6 2008: D+1.0
Not yet ingested
- Civics
- —
Market trends
- HPI YoY
- ▲ 15.41%
- Current HPI
- 266.1457
- Rent YoY
- ▲ 8.79%
- Metro
- Buffalo-Cheektowaga, NY
- State GDP YoY
- ▲ 2.60%
- F500 in state
- 92
Industry mix (Fortune 500 HQ in NY)
| Industry | F500 HQs | Revenue |
|---|---|---|
| Financial Services | 10 | $950B |
|
||
| Consumer Goods | 9 | $162B |
|
||
| Insurance | 4 | $225B |
|
||
| Telecommunications | 2 | $144B |
|
||
| Pharmaceuticals | 2 | $112B |
|
||
| Media / Entertainment | 2 | $69B |
|
||
Price history
+257.4% since first listed7 events — show timeline
- 2026-03-18 Pending — WNYREIS
- 2026-03-10 Listed $67,900 WNYREIS
- 2025-12-01 Sold (MLS) $79,900 WNYREIS
- 2025-11-07 Pending — WNYREIS
- 2025-10-10 Price Changed $79,900 WNYREIS
- 2025-09-15 Listed $85,000 WNYREIS
- 2004-10-26 Sold (Public Records) $19,000 Public Records
Property tax history
-8.4%/yrLatest (2025): $1,808 · -11.1% YoY. Source: county tax records.
Cash-flow waterfall
monthlySold comps — $/sqft
last 12 mo · ≤1 miLoading sold comps…