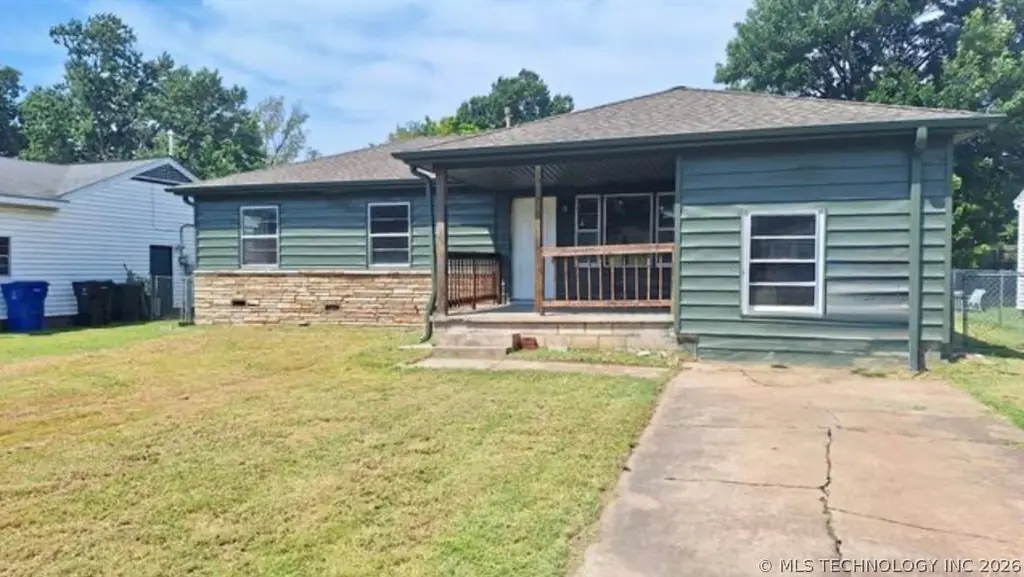
310 S 8th St · Broken Arrow, OK
Flood risk 1/10 · Minimal
- FEMA flood zone
- X (unshaded)
- Chance of flooding over 30 yrs
- 0.0%
- Est. flood insurance / yr
- $507 – $1,088
Fire risk 2/10 · Minimal
- Est. fire insurance / yr
- $2,463 – $4,575
Heat risk 7/10 · Major
- Hot days now (above 111°F)
- 7 days/yr
- Hot days in 30 yrs
- 20 days/yr
Wind risk 3/10 · Minor
- Chance of severe wind over 30 yrs
- 4.0%
Air-quality risk 2/10 · Minimal
- Unhealthy air days now
- 1 days/yr
- Unhealthy air days in 30 yrs
- 1 days/yr
Risk factors via First Street. Map © Google.
Why this score? — see what drove the D- grade
The composite is a weighted blend of 9 inputs, each scored 0–100. Each bar is that input's sub-score; the figure is the points it added to the 100-point composite (weight × sub-score).
- Cash flow +14.6/30.0
- DSCR +4.5/10.0
- ARV discount +4.3/15.0
- Livability +3.9/5.0
- 1% rule +3.6/10.0
- Rent growth +3.2/5.0
- Condition / age +2.5/5.0
- Schools +2.4/10.0
- Appreciation +0.0/10.0
$210,000
🖨 Deal sheet (PDF) 📄 Offer letter ✓ Due diligence
Listing remarks
Back on market, buyer terminated prior to inspections. Clean, well laid-out 3 bedroom, 1.5 bath home with refinished original hardwood floors, brand new granite countertops, and updated interior finishes. Functional floor plan with great natural light and comfortable living spaces. Priced accordingly and sold as-is. Easy to show. Listing agent related to seller.
Key facts
- 7,200 sq ft lot
- Built 1957
- Listed 95 days
Property features AI
Finance
- HOA & community: Gutter(s) listed as community feature
Exterior
- Security: No safety shelter
- Utilities: Electricity available; Natural gas available; Public water; Public sewer
- Home design: Single-story; Faces east; Crawlspace foundation
- Construction: Built with stone, vinyl siding, and wood frame; Asphalt/fiberglass roof
- Exterior features: Covered porch; Lighting; Rain gutters; Shed(s); Chain link fence
Interior
- Kitchen: Dishwasher; Disposal; Oven; Range; Stove; Refrigerator; Gas water heater
- Flooring: Hardwood; Vinyl
- Bathrooms: 1 full bathroom; 1 half bathroom
- Heating & cooling: Central heating (electric and gas); Central air conditioning
- Interior features: Granite counters; Stone counters; High-speed internet; Cable TV; Wired for data; Ceiling fan(s); Programmable thermostat; Aluminum-framed windows
- Laundry & utility: Washer hookup; Electric dryer hookup
Neighborhood map
What this means for you Summary
Snapshot
- This is a 3-bed/1.5-bath single-family listed at $210k.
Deal economics
- At list price, monthly cash flow is $50 ($596/yr) — positive.
- The deal already cash-flows at list — no discount required.
- To meet the 1% rule (rent ≥ 1% of price), the offer needs to be $181k (13.6% below list).
- Recommended offer: $181k (13.6% below list) — sets the bar for 1% rule.
- Cap rate 6.6% vs local median 4.0% in Broken Arrow — top-decile yield for the area; either an underpriced asset or a hidden risk that comps aren't pricing in. Stress-test before assuming the spread holds.
Location & tenants
- Location reads 78/100 on livability (#7 in OK, #2,691 nationally) — a middle-class / working-renter tenant base. Strengths: commute A+, cost of living A+, housing A+; Watch: amenities F.
- Broken Arrow (suburban): math 23% / reading 28% proficiency, ranked #79 of 270 in OK (top 29%) — low school quality limits family demand, transient renter base, plan for 1-2y turnover.
- Zoned schools: Rhoades Es (math 12% / reading 17%, grade F, #604 of 845 statewide, top 76%, 413 students, 0% FRL); Sequoyah Ms (math 12% / reading 15%, grade F, #252 of 345 statewide, top 74%, 720 students, 0% FRL); Broken Arrow Hs (math 22% / reading 36%, grade F, #120 of 447 statewide, top 27%, 4,589 students, 0% FRL) — zoned schools average 0% FRL vs 33% district-wide (33 pts lower); this property's tenant base skews higher-income than the district average.
- Market conditions: Rents rising (+2.9%/yr); 445 active listings in the ZIP; 17 comparable units currently listed for rent nearby; rentals at typical pace (median 18d on market — plan ~3-4 weeks tenant-placement turnaround); solid renter incomes; 2,818 units permitted in Tulsa County in 2024 (518 in 5+ unit buildings).
Forward outlook
- Local home prices are declining (-3.0%/yr); year-one equity from $1k of loan paydown is wiped out by about $6k of value loss. Plan a longer hold.
- Tulsa County population projected at +30% by 2050 — long-run rental-demand tailwind backs the buy-and-hold thesis.
Negotiation context
- It's been on market 95 days — a 9% lower offer ($191k) is reasonable based on typical stale-listing flexibility.
- 6 sale attempts; this cycle's ask is 13900% above the opening price — seller raised mid-cycle; expect resistance to lowballs.
- Current owner paid $48k; list at $210k implies a 338% gain — meaningful room to come down on a strong offer.
Risks & watch-outs
- Watch-outs: built in 1957 — expect roof / HVAC / electrical / plumbing capex.
- Climate carrying-cost: extreme-heat days projected 7→20/yr by 2055 (HVAC capex compounding) — expect insurance premiums to compound above CPI over the hold.
Questions for the listing agent
- It's been on market 95 days. Have you received any prior offers? Is the seller open to a 14% concession, seller financing, or rate buy-down credit?
- Built in 1957 — when were the roof, HVAC, electrical panel, plumbing, and water heater last replaced?
- Why hasn't it sold? Are there any deal-killer items the seller is aware of (foundation, flood, title, zoning, code violations)?
- Is there a deadline driving the sale (1031 exchange, divorce, estate, relocation)? That informs how much negotiation room exists.
- Schools are D-rated, which usually means shorter tenancies and higher turnover. Who's the typical renter profile here, and what's been the actual vacancy rate?
- The area grade is low — what's the realistic commute time and amenity access for the typical tenant pool here? Any planned neighborhood developments (good or bad) we should know about?
- What's the average days-on-market for RENTAL listings here right now (not sales)? A rising rental-DOM trend means longer vacancies and softer asking-rent achievability than the comps imply.
- What's the recent tenant-quality profile in this submarket — average credit score on applications, eviction rate, late-payment / NSF rate, and stable-employment percentage? A property-management company in the area should have these aggregated.
- How much new for-sale + rental construction is in the pipeline within 1–3 miles? Heavy new supply typically softens prices + rents 12–24 months out; constrained supply supports both.
Investment metrics
- 1% rule
- 0.86% ✗
- Cap rate
- 6.58%
- Cash-on-cash
- 1.01%
- DSCR
- 1.05
- GRM
- 9.6
CMA / ARV
- ARV (on-the-fly)
- $196,250
- Comps found
- 12
Show comp detail 12 sales within ~0.75 mi
| Address | Dist | Beds/Ba | Sqft | Sold | Price | $/sf | Match |
|---|---|---|---|---|---|---|---|
| 609 E Ft Worth Pl | 0.17mi | 3/1.0 | 1,270 (+2%) | 9mo | $200,000 | $157 | 80 |
| 305 S 8th St | 0.03mi | 3/1.5 | 1,145 (-8%) | 11mo | $221,000 | $193 | 75 |
| 309 S 7th St | 0.03mi | 3/2.0 | 1,369 (+10%) | 8mo | $195,000 | $142 | 74 |
| 610 S 5th Pl E | 0.27mi | 3/1.5 | 1,322 (+6%) | 8mo | $205,000 | $155 | 72 |
| 301 N 10th St | 0.43mi | 3/2.0 | 1,222 (-2%) | 9mo | $130,000 | $106 | 67 |
| 606 S 4th St | 0.28mi | 3/2.0 | 1,280 (+2%) | 18mo | $203,900 | $159 | 66 |
| 406 S 1st Pl | 0.42mi | 3/1.5 | 1,152 (-8%) | 4mo | $196,000 | $170 | 64 |
| 502 S 4th St | 0.24mi | 3/1.5 | 1,080 (-14%) | 8mo | $165,000 | $153 | 60 |
| 309 E Broadway St N | 0.40mi | 3/1.0 | 1,339 (+7%) | 14mo | $180,000 | $134 | 56 |
| 702 E Elgin Pl | 0.45mi | 3/1.5 | 1,145 (-8%) | 10mo | $190,000 | $166 | 56 |
| 117 N 12th St | 0.37mi | 3/1.5 | 1,085 (-13%) | 13mo | $203,000 | $187 | 50 |
| 1225 E Hartford St | 0.74mi | 3/2.0 | 1,309 (+5%) | 9mo | $195,000 | $149 | 48 |
Match score weights: distance 35% · size 25% · config 20% · recency 20%. Top-matched comps best support the ARV.
Projected returns pro-forma
-3.0% appreciation · 2.94% rent growth · sell at horizon
- IRR
- -14.8%
- Equity multiple
- 0.47×
- Total profit
- $-30,990
- Equity at exit
- $31,312
- IRR
- -6.2%
- Equity multiple
- 0.60×
- Total profit
- $-23,420
- Equity at exit
- $18,157
Cash invested: $58,800 (down + closing). Projections, not guarantees.
Landlord ↔ Tenant lean methodology
- Overall (STATE)
- 83 Strongly Landlord-Friendly
- State Oklahoma
- 83 Strongly Landlord-Friendly · R+20
- County
- — inherits STATE
- City
- — inherits STATE
ZIP-level market 74012
- Rents YoY
- 2.9%
- Active inventory
- 445
- Price-to-rent
- 9.6×
Monthly cashflow live
- Estimated rent
- $1,814 high interval (Pro) →
- Mortgage (P&I)
- −$1,101
- Tax from tax record
- −$195 /mo · $2,339/yr
- Insurance
- −$88
- HOA
- −$0
- Vacancy / Maint / Mgmt
- −$381
- Net cashflow
- $50
Break-even live
Sensitivity live
| Price | -10% $169 | -5% $109 | +0% $50 | +5% $-10 | +10% $-69 |
|---|---|---|---|---|---|
| Rent | -10% $-94 | -5% $-22 | +0% $50 | +5% $121 | +10% $193 |
| Rate | -1.0pp $155 | -0.5pp $103 | base $50 | +0.5pp $-5 | +1.0pp $-60 |
UW: 25.0% down · 7.5% · 30yr · 1.5% tax · 5.0% vac · 8.0% maint · 8.0% mgmt
Financing live
Cash to close
- Down payment
- $52,500
- Closing costs
- $6,300
- Reserves months
- —
- Total cash needed
- —
Loan-product check · same deal, 3 products live
Conventional
25% down · 7.5% · 30yr
- Down + closing
- —
- Monthly P&I
- —
- Monthly cashflow
- —
- DSCR
- —
- Eligible?
- —
Personal DTI + credit; lowest rate.
DSCR
20% down · 8.5% · 30yr
- Down + closing
- —
- Monthly P&I
- —
- Monthly cashflow
- —
- DSCR
- —
- Eligible?
- —
No personal income docs; deal must DSCR.
Hard money
10% down · 12.0% · 12mo
- Down + closing
- —
- Monthly P&I
- —
- Monthly cashflow
- —
- DSCR
- —
- Eligible?
- —
Short-term bridge; refi at stabilization.
Rent comps 17 comps
| Address | Beds | Baths | Sqft | Rent | $/sqft | DOM | Units | Dist |
|---|---|---|---|---|---|---|---|---|
| 322 S 6th St Broken Arrow, OK | 3.0 | 1.0 | 1056 | $1,600 | $1.52 | 25d | 1 | 0.12mi |
| 301 N 10th St Broken Arrow, OK | 3.0 | 2.0 | 1222 | $1,695 | $1.39 | 12d | 1 | 0.41mi |
| 606 N Village Ave Broken Arrow, OK | 3.0 | 1.5 | 1434 | $1,528 | $1.07 | 4d | 1 | 0.60mi |
| 221 W Detroit St Broken Arrow, OK | 4.0 | 2.5 | 1829 | $2,300 | $1.26 | 18d | 1 | 0.74mi |
| 126 E Midway St Unit 122 Broken Arrow, OK | 3.0 | 2.5 | 1363 | $2,000 | $1.47 | 13d | 1 | 0.76mi |
| 507 W Fort Worth St Unit 507 Broken Arrow, OK | 3.0 | 2.5 | 1621 | $2,850 | $1.76 | 18d | 1 | 0.86mi |
| 511 W Fort Worth St Unit 511 Broken Arrow, OK | 3.0 | 2.5 | 1621 | $2,650 | $1.63 | 18d | 1 | 0.87mi |
| 513 W Dallas St Unit A Broken Arrow, OK | 3.0 | 2.0 | 1322 | $1,850 | $1.40 | 5d | 1 | 0.88mi |
| 513 W Dallas St Unit B Broken Arrow, OK | 3.0 | 2.0 | 1362 | $1,850 | $1.36 | 25d | 1 | 0.88mi |
| 820 N Birch Ave Broken Arrow, OK | 2.0 | 2.0 | 1182 | $1,128 | $0.95 | 23d | 1 | 0.99mi |
| 1240 E Richmond St Broken Arrow, OK | 3.0 | 2.0 | 1506 | $1,800 | $1.20 | 23d | 1 | 1.02mi |
| 1713 S 1st St Broken Arrow, OK | 3.0 | 2.0 | 1302 | $1,450 | $1.11 | 25d | 1 | 1.06mi |
| 1101 W Houston St Broken Arrow, OK | 1.0–2.0 | 1.0–2.0 | 800 | $1,170 | $1.46 | 13d | 10 | 1.13mi |
| 921 W Midway St Broken Arrow, OK | 3.0 | 1.0 | 1026 | $1,430 | $1.39 | 18d | 1 | 1.23mi |
| 1008 W Quincy St Broken Arrow, OK | 4.0 | 2.0 | 1617 | $1,750 | $1.08 | 18d | 1 | 1.40mi |
| 1008 W Quincy St Broken Arrow, OK | 4.0 | 2.0 | 1617 | $1,750 | $1.08 | 23d | 1 | 1.40mi |
| 604 S 28th Pl Broken Arrow, OK | 3.0 | 2.0 | 1800 | $1,800 | $1.00 | 25d | 1 | 1.41mi |
Listing history 30 events
-
2026-06-22days on market $210,000 Active 95 DOM
-
2026-06-18days on market $210,000 Active 92 DOM
-
2026-06-17days on market $210,000 Active 91 DOM
-
2026-06-16days on market $210,000 Active 90 DOM
-
2026-06-15days on market $210,000 Active 89 DOM
-
2026-06-13days on market $210,000 Active 87 DOM
-
2026-06-10days on market $210,000 Active 84 DOM
-
2026-06-09days on market $210,000 Active 83 DOM
-
2026-06-08days on market $210,000 Active 82 DOM
-
2026-06-07days on market $210,000 Active 81 DOM
-
2026-06-05days on market $210,000 Active 78 DOM
-
2026-06-03days on market $210,000 Active 77 DOM
-
2026-06-02days on market $210,000 Active 76 DOM
-
2026-06-01days on market $210,000 Active 75 DOM
-
2026-05-31days on market $210,000 Active 74 DOM
-
2026-05-18$1,500
-
2026-04-24status Active
-
2026-04-19status Pending
-
2026-04-18price $210,000
-
2026-03-12$194,000 Active
-
2026-02-19historical
-
2026-02-11price $194,000
-
2025-12-28$199,000 Active
-
2025-12-06historical $1,525
-
2025-10-15price $1,525
-
2025-10-04price $1,650
-
2025-09-24$1,750
-
2025-09-21historical
-
2025-09-04$229,000 Active
-
2006-08-04soldstatus $48,000
ⓘ Source: listings_history table (triggers on properties + properties_extension) + one-shot
backfill from property_details.listing_events for pre-trigger history.
Tax reassessment forecast OK · Resets to sale price
- Current annual tax
- $2,339 · $195/mo
- Projected year-2 tax
- $2,339 · $195/mo
- Expected delta
- $0/yr ($0/mo · 0.0%)
ⓘ Screening estimate from a state-policy table — verify with the county assessor before closing.
Climate risk First Street
- Flood 1/10 Low FEMA zone X (unshaded) · 0% chance over 30 yrs
- Wildfire 2/10 Low
- Heat 7/10 Severe 7 d/yr ≥111°F today · 20 d/yr by 30 yrs out
- Wind 3/10 Moderate 4% chance of damaging wind over 30 yrs
- Air quality 2/10 Low 1 unhealthy d/yr today · 1 by 30 yrs out
Nearby sold comps map
Loading sold comps map…
Walkable amenities ~0.75 mi
Loading nearby amenities…
Taxation est. · year 1
- Rental income
- $21,772
- − Mortgage interest
- −$11,763
- − Property taxes
- −$2,339
- − Insurance
- −$1,050
- − Repairs & maintenance
- −$1,742
- − Management
- −$1,742
- − Depreciation
- −$6,109
- Taxable loss
- −$2,973
- Est. tax savings @ 24.0%
- +$713
- After-tax cash flow
- $1,309/yr
For passive investors: Depreciation is non-cash, so a rental often shows a tax loss while cash-flowing — sheltering income. Rental losses are passive: they offset passive income freely, and up to $25,000/yr can offset ordinary (W-2) income if you actively participate and your MAGI is under $100k (phasing out to $0 by $150k); unused losses carry forward. On sale, claimed depreciation is recaptured at up to 25%, and gains may owe capital-gains tax (a 1031 exchange can defer both). Figures are a year-1 estimate at your 24.0% rate — not tax advice; consult a CPA.
Schools (NCES district)
- District
- Broken Arrow
- NCES district ID
- 4005490
- Math proficiency
- 23% ▼ -9.00%
- Reading proficiency
- 28% ▼ -9.00%
- Median HH income
- $64,646
- Composite
- 23.86/100
- National rank
- #7801
- State rank
- #79 of 270 in OK
Livability — Broken Arrow
- Score
- 78/100
- State rank
- #7
- US rank
- #2691
Category grades
Schools grade is shown separately in the Schools card above.
Census & demographics
- Census place
- Broken Arrow, OK
- County
- Tulsa County · 640,811 people
- City population
- 144,172
- Metro
- Tulsa, OK
- Population (ZIP)
- 65,060
- Household income
- $81,456
- Rent vs Own
- Severe rent burden
- 1378.0
Population outlook (Tulsa County) Hauer SSP2
- Today (2025)
- 723,846 people
- By 2030
- 766,033 · +5.8%
- By 2040
- 851,386 · +17.6%
- By 2050
- 938,389 · +29.6%
- By 2075
- 1,166,011 · +61.1%
- By 2100
- 1,350,277 · +86.5%
Race, ethnicity, and origin ACS 2023
- Neighborhood character
- Diverse neighborhood (Simpson 0.58)
- Race & ethnicity
- White 63% Two or more races 13% Hispanic / Latino 11% Black 7% Asian 5% Native American 5%
- Hispanic origin (detail)
- Mexican 8%
- Common ancestry
- Slovak 2% Italian 2% Lithuanian 2%
- Foreign-born
- 10% · Canada, Vietnam
- Languages at home
- 86% English-only · Spanish 7% Vietnamese 2% Other Asian/Pacific 1%
Political lean MEDSL · Tulsa
- 2024 margin
- R (+15.2) · D 41.3% · R 56.5% · Other 2.2%
- 2008→2024 swing
- +9.2pp toward D · 2008: -24.5pp · 2024: -15.2pp
- All cycles
- 2024: R+15.2 2020: R+15.6 2016: R+22.9 2012: R+27.4 2008: R+24.5
Not yet ingested
- Civics
- —
Market trends
- HPI YoY
- ▼ -170.42%
- Current HPI
- 214.1279
- Rent YoY
- ▲ 2.94%
- Metro
- Tulsa, OK
- State GDP YoY
- ▲ 1.55%
- F500 in state
- 6
Industry mix (Fortune 500 HQ in OK)
| Industry | F500 HQs | Revenue |
|---|---|---|
| Energy | 3 | $48B |
|
||
Price history
-96.9% since first listed15 events — show timeline
- 2026-05-18 Listed for Rent $1,500 TURBOTENANT
- 2026-04-24 Relisted — MLS Technology, Inc.
- 2026-04-19 Pending — MLS Technology, Inc.
- 2026-04-18 Price Changed $210,000 MLS Technology, Inc.
- 2026-03-12 Listed $194,000 MLS Technology, Inc.
- 2026-02-19 Listing Removed — MLS Technology, Inc.
- 2026-02-11 Price Changed $194,000 MLS Technology, Inc.
- 2025-12-28 Listed $199,000 MLS Technology, Inc.
- 2025-12-06 Rental Removed $1,525 APPFOLIO
- 2025-10-15 Price Changed $1,525 APPFOLIO
- 2025-10-04 Price Changed $1,650 APPFOLIO
- 2025-09-24 Listed for Rent $1,750 APPFOLIO
- 2025-09-21 Listing Removed — MLS Technology, Inc.
- 2025-09-04 Listed $229,000 MLS Technology, Inc.
- 2006-08-04 Sold (Public Records) $48,000 Public Records
Property tax history
+9.6%/yrLatest (2025): $2,339 · +4.8% YoY. Source: county tax records.
Cash-flow waterfall
monthlySold comps — $/sqft
last 12 mo · ≤1 miLoading sold comps…