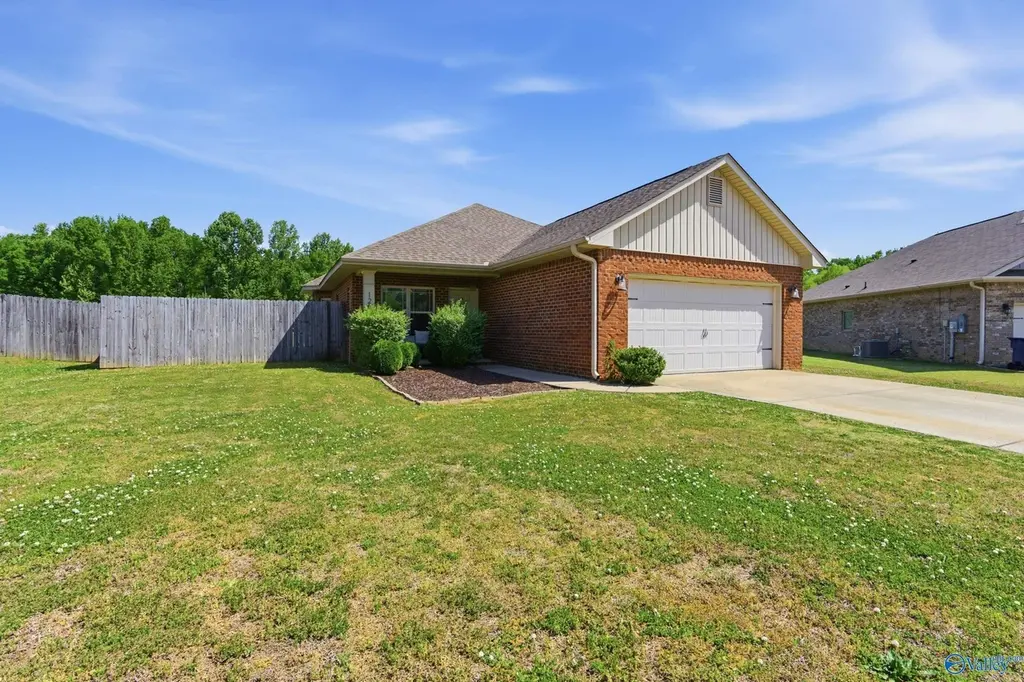
126 Clydesdale Ln · Harvest, AL
Flood risk 1/10 · Minimal
- FEMA flood zone
- X (unshaded)
- Chance of flooding over 30 yrs
- 0.0%
- Est. flood insurance / yr
- $507 – $1,088
Fire risk 4/10 · Minor
- Est. fire insurance / yr
- $916 – $1,700
Heat risk 6/10 · Moderate
- Hot days now (above 103°F)
- 7 days/yr
- Hot days in 30 yrs
- 20 days/yr
Wind risk 4/10 · Minor
- Chance of severe wind over 30 yrs
- 15.0%
Air-quality risk 2/10 · Minimal
- Unhealthy air days now
- 1 days/yr
- Unhealthy air days in 30 yrs
- 1 days/yr
Risk factors via First Street. Map © Google.
Why this score? — see what drove the D- grade
The composite is a weighted blend of 9 inputs, each scored 0–100. Each bar is that input's sub-score; the figure is the points it added to the 100-point composite (weight × sub-score).
- Cash flow +11.7/30.0
- ARV discount +10.0/15.0
- Schools +3.7/10.0
- Livability +3.6/5.0
- DSCR +3.5/10.0
- Rent growth +2.7/5.0
- Condition / age +2.5/5.0
- 1% rule +2.1/10.0
- Appreciation +0.0/10.0
$255,000
🖨 Deal sheet (PDF) 📄 Offer letter ✓ Due diligence
Listing remarks MLS
Recessed lights. Bay window in the kitchen. 9 ft ceilings. Covered back porch. 2 car garage. Programmable thermostat. Beautiful home for potential first time home buyers.
Key facts
- 8,712 sq ft lot
- 2 garage spots
- Built 2015
Property features AI
Finance
- Other: Directions: From Hwy 72 north on Old Railroad Bed; through 4-way stop at Nick Davis; left at the caution light at Yarbrough Road; right on Clydesdale Lane
- Financial info: No financial details provided
- HOA & community: No homeowners association; Subdivision: Yarbrough Farms
Exterior
- Parking: Two-car garage
- Security: No security details provided
- Utilities: Private sewer; Sand filtration water source; Electric power available
- Home design: Single-family residence; One story; Built in 2015; Residential property
- Construction: Brick construction; Slab foundation
- Exterior features: Sidewalk; Cul-de-sac location; Storm shelter; Covered front porch; Front porch; Patio
Interior
- Kitchen: Range; Cooktop; Oven; Dishwasher; Microwave
- Bedrooms: No bedroom count provided
- Flooring: No flooring details provided
- Bathrooms: Two full bathrooms
- Heating & cooling: Central heating; Central cooling
- Interior features: Five total rooms; Two full bathrooms
- Laundry & utility: No laundry details provided
Neighborhood map
What this means for you Summary
Snapshot
- This is a 3-bed/1.0-bath single-family listed at $255k.
Deal economics
- At list price, monthly cash flow is $-72 ($-868/yr) — negative.
- To cash-flow at today's rent, offer at most $242k (5.0% below list).
- To meet the 1% rule (rent ≥ 1% of price), the offer needs to be $181k (29.1% below list).
- Recommended offer: $181k (29.1% below list) — sets the bar for 1% rule.
- Cap rate 6.0% vs local median 3.5% in Harvest — top-decile yield for the area; either an underpriced asset or a hidden risk that comps aren't pricing in. Stress-test before assuming the spread holds.
Location & tenants
- Location reads 72/100 on livability (#27 in AL) — a middle-class / working-renter tenant base. Strengths: crime A+, employment A+, cost of living A+; Watch: amenities F, commute F, health & safety F.
- Madison County (rural): math 27% / reading 56% proficiency, ranked #19 of 129 in AL (top 15%) — families likely to look elsewhere, expect single-tenant / working-renter base with shorter leases.
- Zoned schools: Harvest School (math 19% / reading 46%, grade F, #329 of 627 statewide, top 53%, 734 students, 54% FRL); Sparkman Middle School (math 18% / reading 53%, grade F, #81 of 257 statewide, top 33%, 859 students, 60% FRL); Sparkman High School (math 28% / reading 37%, grade F, #58 of 305 statewide, top 19%, 1,738 students, 37% FRL) — zoned schools average 50% FRL vs 29% district-wide (21 pts higher); higher-poverty schools than district average — tighter screening recommended.
- Market conditions: Rents flat; 675 active listings in the ZIP; 1 comparable units currently listed for rent nearby; solid renter incomes; 4,709 units permitted in Madison County in 2024 (1,186 in 5+ unit buildings).
Forward outlook
- Local home prices are declining (-3.0%/yr); year-one equity from $2k of loan paydown is wiped out by about $8k of value loss. Plan a longer hold.
- Madison County population projected at +18% by 2050 — long-run rental-demand tailwind backs the buy-and-hold thesis.
Negotiation context
- Only 6 days on market — expect competitive offers; lowballing is unlikely to land.
- 3 sale attempts since 11y ago with the ask held roughly flat each time — persistent listings suggest the price (not the market) is what's stuck; bring a comps-based counter.
Risks & watch-outs
- Climate carrying-cost: extreme-heat days projected 7→20/yr by 2055 (HVAC capex compounding) — expect insurance premiums to compound above CPI over the hold.
Questions for the listing agent
- What do current leases actually rent for vs. the listed asking? Can we see a recent rent roll and the last 12 months of T-12 income?
- Is there a deadline driving the sale (1031 exchange, divorce, estate, relocation)? That informs how much negotiation room exists.
- The area grade is low — what's the realistic commute time and amenity access for the typical tenant pool here? Any planned neighborhood developments (good or bad) we should know about?
- What's the average days-on-market for RENTAL listings here right now (not sales)? A rising rental-DOM trend means longer vacancies and softer asking-rent achievability than the comps imply.
- What's the recent tenant-quality profile in this submarket — average credit score on applications, eviction rate, late-payment / NSF rate, and stable-employment percentage? A property-management company in the area should have these aggregated.
- How much new for-sale + rental construction is in the pipeline within 1–3 miles? Heavy new supply typically softens prices + rents 12–24 months out; constrained supply supports both.
Investment metrics
- 1% rule
- 0.71% ✗
- Cap rate
- 5.95%
- Cash-on-cash
- -1.22%
- DSCR
- 0.95
- GRM
- 11.7
CMA / ARV
- ARV (median comp)
- $270,214
- List price
- $255,000
- Delta
- -5.63%
- Verdict
- FAIR
- Comps
- 20 within 1.0 mi
Show comp detail 12 sales within ~0.75 mi
| Address | Dist | Beds/Ba | Sqft | Sold | Price | $/sf | Match |
|---|---|---|---|---|---|---|---|
| 126 Clydesdale Ln | 0.00mi | 3/2.0 | 1,420 (-3%) | 1mo | $255,000 | $180 | 90 |
| 105 Clydesdale Ln | 0.11mi | 3/2.0 | 1,560 (+6%) | 9mo | $255,000 | $163 | 72 |
| 102 Grey Mare St | 0.13mi | 3/2.0 | 1,360 (-7%) | 16mo | $255,000 | $188 | 65 |
| 135 Vasser Farms Dr | 0.72mi | 3/2.0 | 1,444 (-2%) | 7mo | $240,000 | $166 | 54 |
| 123 Vasser Farms Dr | 0.74mi | 3/2.0 | 1,515 (+3%) | 8mo | $240,000 | $158 | 50 |
| 127 Trestle Point Dr | 0.74mi | 4/2.0 (+1) | 1,497 (+2%) | 9mo | $257,900 | $172 | 46 |
| 123 Trestle Point Dr | 0.75mi | 4/2.0 (+1) | 1,497 (+2%) | 8mo | $257,900 | $172 | 46 |
| 137 Trestle Point Dr | 0.71mi | 3/2.0 | 1,344 (-8%) | 6mo | $234,900 | $175 | 44 |
| 203 Trestle Point Dr | 0.66mi | 4/2.0 (+1) | 1,504 (+2%) | 16mo | $255,900 | $170 | 43 |
| 131 Trestle Point Dr | 0.72mi | 3/2.0 | 1,272 (-13%) | 0mo | $260,900 | $205 | 40 |
| 202 Trestle Point Dr | 0.64mi | 3/2.0 | 1,281 (-13%) | 14mo | $239,900 | $187 | 33 |
| 205 Trestle Point Dr | 0.68mi | 3/2.0 | 1,281 (-13%) | 14mo | $239,900 | $187 | 32 |
Match score weights: distance 35% · size 25% · config 20% · recency 20%. Top-matched comps best support the ARV.
Projected returns pro-forma
-3.0% appreciation · 0.81% rent growth · sell at horizon
- IRR
- -20.5%
- Equity multiple
- 0.30×
- Total profit
- $-49,962
- Equity at exit
- $38,021
- IRR
- -18.5%
- Equity multiple
- 0.09×
- Total profit
- $-65,299
- Equity at exit
- $22,048
Cash invested: $71,400 (down + closing). Projections, not guarantees.
Landlord ↔ Tenant lean methodology
- Overall (STATE)
- 90 Strongly Landlord-Friendly
- State Alabama
- 90 Strongly Landlord-Friendly · R+15
- County
- — inherits STATE
- City
- — inherits STATE
ZIP-level market 35749
- Home prices YoY
- -5.4%
- Rents YoY
- 0.8%
- Active inventory
- 675
- Price-to-rent
- 11.7×
Monthly cashflow live
- Estimated rent
- $1,809 medium interval (Pro) →
- Mortgage (P&I)
- −$1,337
- Tax from tax record
- −$58 /mo · $696/yr
- Insurance
- −$106
- HOA
- −$0
- Vacancy / Maint / Mgmt
- −$380
- Net cashflow
- $-72
Break-even live
Sensitivity live
| Price | -10% $72 | -5% $0 | +0% $-72 | +5% $-145 | +10% $-217 |
|---|---|---|---|---|---|
| Rent | -10% $-215 | -5% $-144 | +0% $-72 | +5% $-1 | +10% $71 |
| Rate | -1.0pp $56 | -0.5pp $-7 | base $-72 | +0.5pp $-138 | +1.0pp $-206 |
UW: 25.0% down · 7.5% · 30yr · 1.5% tax · 5.0% vac · 8.0% maint · 8.0% mgmt
Financing live
Cash to close
- Down payment
- $63,750
- Closing costs
- $7,650
- Reserves months
- —
- Total cash needed
- —
Loan-product check · same deal, 3 products live
Conventional
25% down · 7.5% · 30yr
- Down + closing
- —
- Monthly P&I
- —
- Monthly cashflow
- —
- DSCR
- —
- Eligible?
- —
Personal DTI + credit; lowest rate.
DSCR
20% down · 8.5% · 30yr
- Down + closing
- —
- Monthly P&I
- —
- Monthly cashflow
- —
- DSCR
- —
- Eligible?
- —
No personal income docs; deal must DSCR.
Hard money
10% down · 12.0% · 12mo
- Down + closing
- —
- Monthly P&I
- —
- Monthly cashflow
- —
- DSCR
- —
- Eligible?
- —
Short-term bridge; refi at stabilization.
Rent comps 1 comps
| Address | Beds | Baths | Sqft | Rent | $/sqft | DOM | Units | Dist |
|---|---|---|---|---|---|---|---|---|
| 105 Dorchester Ln Harvest, AL | 3.0 | 2.0 | 1700 | $1,750 | $1.03 | 15d | 1 | 1.32mi |
Listing history 8 events
-
2026-05-05status Pending 688-char remark
-
2026-04-30$255,000 Active 688-char remark
-
2020-11-04soldstatus $176,000
-
2020-11-03soldstatus $176,000 Sold 171-char remark
Show marketing remark (171 chars)
Recessed lights. Bay window in the kitchen. 9 ft ceilings. Covered back porch. 2 car garage. Programmable thermostat. Beautiful home for potential first time home buyers.
-
2020-09-14historical Contingent 171-char remark
Show marketing remark (171 chars)
Recessed lights. Bay window in the kitchen. 9 ft ceilings. Covered back porch. 2 car garage. Programmable thermostat. Beautiful home for potential first time home buyers.
-
2020-09-12$168,000 Active 171-char remark
Show marketing remark (171 chars)
Recessed lights. Bay window in the kitchen. 9 ft ceilings. Covered back porch. 2 car garage. Programmable thermostat. Beautiful home for potential first time home buyers.
-
2015-12-18soldstatus $127,645
Show marketing remark (326 chars)
$4,000 BUYER INCENTIVE WITH PREFERRED LENDER!! MOVE IN READY!! Trey ceilings. Recessed lights. Stainless steel appliances. Bay window in the kitchen. 9 ft ceilings. Covered back porch. 2 car garage. Programmable thermostat. Close to shopping, restaurants, and schools. Builder warranty!! Model home open Mon-Sat 10-6, Sun 1-6.
-
2015-01-12$134,850
Show marketing remark (326 chars)
$4,000 BUYER INCENTIVE WITH PREFERRED LENDER!! MOVE IN READY!! Trey ceilings. Recessed lights. Stainless steel appliances. Bay window in the kitchen. 9 ft ceilings. Covered back porch. 2 car garage. Programmable thermostat. Close to shopping, restaurants, and schools. Builder warranty!! Model home open Mon-Sat 10-6, Sun 1-6.
ⓘ Source: listings_history table (triggers on properties + properties_extension) + one-shot
backfill from property_details.listing_events for pre-trigger history.
Tax reassessment forecast AL · Resets to sale price
- Current annual tax
- $696 · $58/mo
- Projected year-2 tax
- $1,046 · $87/mo
- Expected delta
- +$349/yr (+$29/mo · 50.2%)
ⓘ Screening estimate from a state-policy table — verify with the county assessor before closing.
Climate risk First Street
- Flood 1/10 Low FEMA zone X (unshaded) · 0% chance over 30 yrs
- Wildfire 4/10 Moderate
- Heat 6/10 Major 7 d/yr ≥103°F today · 20 d/yr by 30 yrs out
- Wind 4/10 Moderate 15% chance of damaging wind over 30 yrs
- Air quality 2/10 Low 1 unhealthy d/yr today · 1 by 30 yrs out
Nearby sold comps map
Loading sold comps map…
Walkable amenities ~0.75 mi
Loading nearby amenities…
Taxation est. · year 1
- Rental income
- $21,709
- − Mortgage interest
- −$14,284
- − Property taxes
- −$696
- − Insurance
- −$1,275
- − Repairs & maintenance
- −$1,737
- − Management
- −$1,737
- − Depreciation
- −$7,418
- Taxable loss
- −$5,438
- Est. tax savings @ 24.0%
- +$1,305
- After-tax cash flow
- $437/yr
For passive investors: Depreciation is non-cash, so a rental often shows a tax loss while cash-flowing — sheltering income. Rental losses are passive: they offset passive income freely, and up to $25,000/yr can offset ordinary (W-2) income if you actively participate and your MAGI is under $100k (phasing out to $0 by $150k); unused losses carry forward. On sale, claimed depreciation is recaptured at up to 25%, and gains may owe capital-gains tax (a 1031 exchange can defer both). Figures are a year-1 estimate at your 24.0% rate — not tax advice; consult a CPA.
Schools (NCES district)
- District
- Madison County
- NCES district ID
- 0102220
- Math proficiency
- 27% ▼ -32.00%
- Reading proficiency
- 56% ▼ -1.00%
- Median HH income
- $66,058
- Composite
- 37.15/100
- National rank
- #4483
- State rank
- #19 of 129 in AL
Livability — Harvest
- Score
- 72/100
- State rank
- #27
- US rank
- #5986
Category grades
Schools grade is shown separately in the Schools card above.
Census & demographics
- Census place
- Harvest, AL
- County
- Madison County · 380,832 people
- City population
- 30,710
- Metro
- Huntsville, AL
- Population (ZIP)
- 30,710
- Household income
- $103,901
- Rent vs Own
- Severe rent burden
- 174.0
Population outlook (Madison County) Hauer SSP2
- Today (2025)
- 392,086 people
- By 2030
- 409,788 · +4.5%
- By 2040
- 440,557 · +12.4%
- By 2050
- 460,990 · +17.6%
- By 2075
- 502,872 · +28.3%
- By 2100
- 513,623 · +31.0%
Race, ethnicity, and origin ACS 2023
- Neighborhood character
- Diverse neighborhood (Simpson 0.56)
- Race & ethnicity
- White 60% Black 29% Two or more races 7% Hispanic / Latino 4% Asian 2%
- Common ancestry
- Italian 2% Slovak 1% Serbian 1%
- Foreign-born
- 3% · Canada, South Korea
- Languages at home
- 95% English-only · Spanish 3% Korean 1% Other Indo-European 1%
Political lean MEDSL · Madison
- 2024 margin
- Lean R (+9.0) · D 44.7% · R 53.7% · Other 1.6%
- 2008→2024 swing
- +6.0pp toward D · 2008: -14.9pp · 2024: -9.0pp
- All cycles
- 2024: R+9.0 2020: R+8.0 2016: R+16.8 2012: R+18.7 2008: R+14.9
Not yet ingested
- Civics
- —
Market trends
- HPI YoY
- ▼ -16.54%
- Current HPI
- 291.1184
- Rent YoY
- ▲ 0.81%
- Metro
- Huntsville, AL
- State GDP YoY
- ▲ 2.94%
- F500 in state
- 4
Industry mix (Fortune 500 HQ in AL)
| Industry | F500 HQs | Revenue |
|---|---|---|
| Financial Services | 1 | $8B |
|
||
| Healthcare | 1 | $5B |
|
||
Price history
+89.1% since first listed9 events — show timeline
- 2026-06-05 Sold (MLS) $255,000 VMLS
- 2026-05-05 Pending — VMLS
- 2026-04-30 Listed $255,000 VMLS
- 2020-11-04 Sold (Public Records) $176,000 Public Records
- 2020-11-03 Sold (MLS) $176,000 VMLS
- 2020-09-14 Contingent — VMLS
- 2020-09-12 Listed $168,000 VMLS
- 2015-12-18 Sold (MLS) $127,645 VMLS
- 2015-01-12 Listed $134,850 VMLS
Property tax history
+18.7%/yrLatest (2024): $696 · +4.1% YoY. Source: county tax records.
Cash-flow waterfall
monthlySold comps — $/sqft
last 12 mo · ≤1 miLoading sold comps…