 Duplex
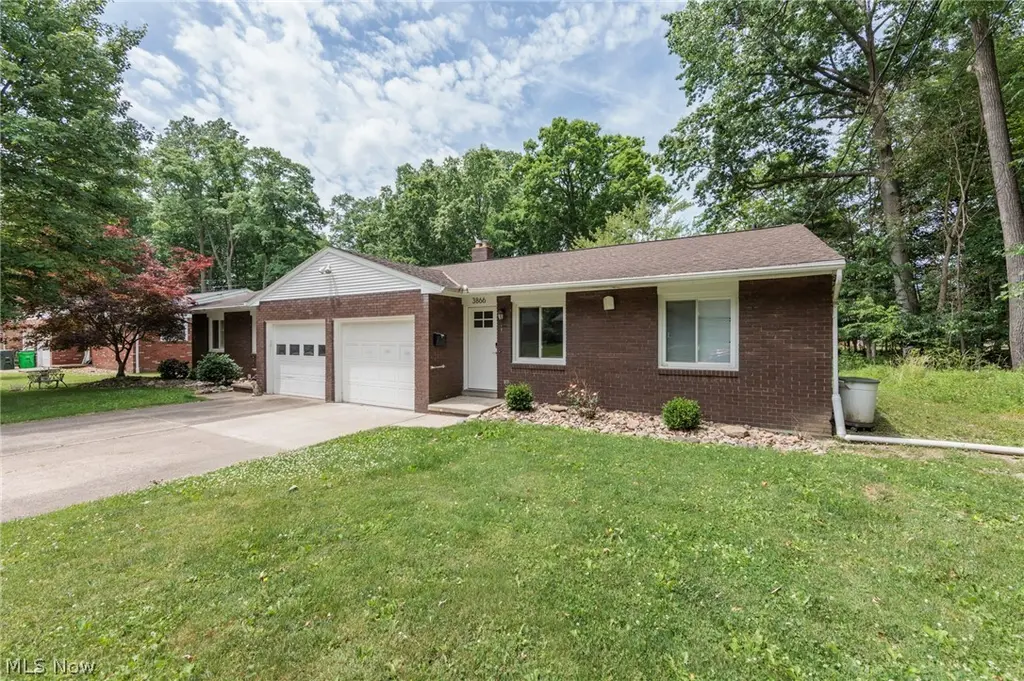
3862 & 3866 Seneca St · Stow, OH
Flood risk 1/10 · Minimal
- FEMA flood zone
- X (unshaded)
- Chance of flooding over 30 yrs
- 0.0%
- Est. flood insurance / yr
- $473 – $860
Fire risk 1/10 · Minimal
- Est. fire insurance / yr
- $713 – $1,323
Heat risk 2/10 · Minimal
- Hot days now (above 96°F)
- 7 days/yr
- Hot days in 30 yrs
- 17 days/yr
Wind risk 1/10 · Minimal
- Chance of severe wind over 30 yrs
- —
Air-quality risk 3/10 · Minor
- Unhealthy air days now
- 2 days/yr
- Unhealthy air days in 30 yrs
- 4 days/yr
Risk factors via First Street. Map © Google.
Why this score? — see what drove the D- grade
The composite is a weighted blend of 9 inputs, each scored 0–100. Each bar is that input's sub-score; the figure is the points it added to the 100-point composite (weight × sub-score).
- Cash flow +11.4/30.0
- Schools +5.3/10.0
- Rent growth +4.6/5.0
- Livability +3.8/5.0
- Condition / age +3.8/5.0
- 1% rule +3.3/10.0
- DSCR +3.3/10.0
- ARV discount +0.8/15.0
- Appreciation +0.0/10.0
$345,000
🖨 Deal sheet 📄 Offer letter ✓ Due diligence
Multi-family units
County records classify this as Multi-Family (2-4 Unit). Listing-text estimate: 2 units. confirmed
Listing remarks
This brick, ranch, duplex is a great investment opportunity in Stow! One side is currently leased for $1230 per month through the end of August. The unit is complete with 2 bedrooms, 1 full bath, and a 1 car garge. The vacant unit has 2 bedrooms, 3 full baths, an additional living room, and first floor laundry. Updates include: newer kitchens, flooring and paint throughout, vinyl windows, newer roof and gutters, HVAC, and a water proofed basement. These units don't come for sale often and this one won't last long!
Key facts
- Vinyl windows
- Newer kitchens
- Newer roof
Tags
Property features AI
Finance
- Other: Property contains one building; Above-grade finished area approximately 2,404
Exterior
- Parking: Attached 2-car garage; Driveway parking
- Utilities: Public water; Public sewer
- Home design: Single-story building
- Construction: Built according to public records; Asphalt and fiberglass roof
- Exterior features: Brick exterior; Paved driveway
Interior
- Bathrooms: Four full bathrooms
- Heating & cooling: Central air conditioning; Gas forced-air heating
- Interior features: Full basement
Neighborhood map
What this means for you Summary
Snapshot
- This is a 2 × 2-bed/2.0-bath units multifamily listed at $345k. Condition is rated good.
Deal economics
- At list price, monthly cash flow is $-120 ($-1k/yr) — negative. Per door: $-60/mo.
- To cash-flow at today's rent, offer at most $328k (5.0% below list).
- To meet the 1% rule (rent ≥ 1% of price), the offer needs to be $287k (16.9% below list).
- Recommended offer: $287k (16.9% below list) — sets the bar for 1% rule.
- Cap rate 5.9% vs local median 3.5% in Stow — top-decile yield for the area; either an underpriced asset or a hidden risk that comps aren't pricing in. Stress-test before assuming the spread holds.
Location & tenants
- Location reads 76/100 on livability (#217 in OH, #3,390 nationally) — a middle-class / working-renter tenant base. Strengths: schools A+, cost of living A+, housing A+; Watch: amenities F, commute F.
- Stow-Munroe Falls City School District (suburban): math 58% / reading 64% proficiency, ranked #247 of 656 in OH (top 38%) — acceptable for families but not a draw, mixed tenant base, ~2y average lease; only 18% free/reduced lunch — higher-income household profile.
- Market conditions: Rents rising fast (+8.6%/yr); 113 active listings in the ZIP; solid renter incomes; 1,114 units permitted in Summit County in 2024 (397 in 5+ unit buildings).
- This rent runs 36% of the median local income ($94k/yr) — at the standard rent-burdened threshold; future hikes will face affordability resistance.
Forward outlook
- Local home prices are declining (-3.0%/yr); year-one equity from $2k of loan paydown is wiped out by about $10k of value loss. Plan a longer hold.
- Summit County population projected to shrink 6% by 2050 — rents likely to lag national; underwrite the cash flow, not the appreciation.
Negotiation context
- Only 2 days on market — expect competitive offers; lowballing is unlikely to land.
Questions for the listing agent
- What do current leases actually rent for vs. the listed asking? Can we see a recent rent roll and the last 12 months of T-12 income?
- Can we see the unit-by-unit rent roll, current vacancy, and any below-market leases? What's the average tenancy length?
- What capital expenditures (roof, boiler, parking lot, exteriors) have been made in the last 5 years, and what's planned in the next 2?
- Built in 1967 — when were the roof, HVAC, electrical panel, plumbing, and water heater last replaced?
- Is there a deadline driving the sale (1031 exchange, divorce, estate, relocation)? That informs how much negotiation room exists.
- Schools are A-rated — typically a magnet for longer-tenancy family renters. What's the average tenant stay here, and is there a school-zone premium baked into asking?
- The area grade is low — what's the realistic commute time and amenity access for the typical tenant pool here? Any planned neighborhood developments (good or bad) we should know about?
- What's the average days-on-market for RENTAL listings here right now (not sales)? A rising rental-DOM trend means longer vacancies and softer asking-rent achievability than the comps imply.
- What's the recent tenant-quality profile in this submarket — average credit score on applications, eviction rate, late-payment / NSF rate, and stable-employment percentage? A property-management company in the area should have these aggregated.
- How much new apartment / multifamily construction is in the pipeline within 1–3 miles? Heavy new supply (>2% of stock underway) typically softens rents 12–24 months out; light construction supports rent growth.
Investment metrics
- 1% rule
- 0.83% ✗
- Cap rate
- 5.88%
- Cash-on-cash
- -1.49%
- DSCR
- 0.93
- GRM
- 10.0
CMA / ARV
- ARV (on-the-fly)
- $300,500
- Comps found
- 5
Show comp detail 5 sales within ~0.75 mi
| Address | Dist | Beds/Ba | Sqft | Sold | Price | $/sf | Match |
|---|---|---|---|---|---|---|---|
| 3807-3811 Osage St | 0.17mi | 4/3.0 | 2,400 (-0%) | 9mo | $280,000 | $117 | 81 |
| 3705-3709 Iona Ave | 0.30mi | 4/3.0 | 2,520 (+5%) | 11mo | $315,000 | $125 | 65 |
| 3780 & 3776 Osage St | 0.21mi | 4/3.0 | 2,280 (-5%) | 17mo | $287,802 | $126 | 64 |
| 3865-3869 Santom Rd N | 0.06mi | 4/2.5 | 2,121 (-12%) | 22mo | $280,000 | $132 | 54 |
| 3497-3495 Marcella Ave | 0.59mi | 4/2.0 | 2,048 (-15%) | 15mo | $245,000 | $120 | 27 |
Match score weights: distance 35% · size 25% · config 20% · recency 20%. Top-matched comps best support the ARV.
Projected returns pro-forma
-3.0% appreciation · 8.0% rent growth · sell at horizon
- IRR
- -13.3%
- Equity multiple
- 0.50×
- Total profit
- $-48,363
- Equity at exit
- $51,441
- IRR
- 2.0%
- Equity multiple
- 1.18×
- Total profit
- $17,150
- Equity at exit
- $29,829
Cash invested: $96,600 (down + closing). Projections, not guarantees.
Landlord ↔ Tenant lean methodology
- Overall (STATE)
- 73 Landlord-Friendly
- State Ohio
- 73 Landlord-Friendly · R+6
- County
- — inherits STATE
- City
- — inherits STATE
ZIP-level market 44224
- Rents YoY
- 8.6%
- Active inventory
- 113
- Price-to-rent
- 20.1×
Monthly cashflow live
- Estimated rent
- $2,866 high interval (Pro) →
- Mortgage (P&I)
- −$1,809
- Tax est. 1.5%
- −$431 /mo · $5,175/yr
- Insurance
- −$144
- HOA
- −$0
- Vacancy / Maint / Mgmt
- −$602
- Net cashflow
- $-120
Break-even live
2-unit breakdown (identical units grouped — click to expand)
| Units | Beds | Baths | Est. rent |
|---|---|---|---|
| 2× units | 2 | 2 | $2,866 |
| #1 | 2 | 2 | $1,433 |
| #2 | 2 | 2 | $1,433 |
| Total (2 units) | $2,866 | ||
UW: 25.0% down · 7.5% · 30yr · 1.5% tax · 5.0% vac · 8.0% maint · 8.0% mgmt
Financing live
Cash to close
- Down payment
- $86,250
- Closing costs
- $10,350
- Reserves months
- —
- Total cash needed
- —
Loan-product check · same deal, 3 products live
Conventional
25% down · 7.5% · 30yr
- Down + closing
- —
- Monthly P&I
- —
- Monthly cashflow
- —
- DSCR
- —
- Eligible?
- —
Personal DTI + credit; lowest rate.
DSCR
20% down · 8.5% · 30yr
- Down + closing
- —
- Monthly P&I
- —
- Monthly cashflow
- —
- DSCR
- —
- Eligible?
- —
No personal income docs; deal must DSCR.
Hard money
10% down · 12.0% · 12mo
- Down + closing
- —
- Monthly P&I
- —
- Monthly cashflow
- —
- DSCR
- —
- Eligible?
- —
Short-term bridge; refi at stabilization.
Listing history 3 events
-
2026-06-14statusdays on market $345,000 Pending 2 DOM
-
2026-06-10remarks 519-char remark
-
2026-06-10$345,000 Active 1 DOM
ⓘ Source: listings_history table (triggers on properties + properties_extension) + one-shot
backfill from property_details.listing_events for pre-trigger history.
Climate risk First Street
- Flood 1/10 Low FEMA zone X (unshaded) · 0% chance over 30 yrs
- Wildfire 1/10 Low
- Heat 2/10 Low 7 d/yr ≥96°F today · 17 d/yr by 30 yrs out
- Wind 1/10 Low
- Air quality 3/10 Moderate 2 unhealthy d/yr today · 4 by 30 yrs out
Nearby sold comps map
Loading sold comps map…
Walkable amenities ~0.75 mi
Loading nearby amenities…
Taxation est. · year 1
- Rental income
- $34,392
- − Mortgage interest
- −$19,325
- − Property taxes
- −$5,175
- − Insurance
- −$1,725
- − Repairs & maintenance
- −$2,751
- − Management
- −$2,751
- − Depreciation
- −$10,036
- Taxable loss
- −$7,372
- Est. tax savings @ 24.0%
- +$1,769
- After-tax cash flow
- $328/yr
For passive investors: Depreciation is non-cash, so a rental often shows a tax loss while cash-flowing — sheltering income. Rental losses are passive: they offset passive income freely, and up to $25,000/yr can offset ordinary (W-2) income if you actively participate and your MAGI is under $100k (phasing out to $0 by $150k); unused losses carry forward. On sale, claimed depreciation is recaptured at up to 25%, and gains may owe capital-gains tax (a 1031 exchange can defer both). Figures are a year-1 estimate at your 24.0% rate — not tax advice; consult a CPA.
Condition & rehab AI · 5 photos
This well-maintained, two-unit property offers a great investment opportunity with modern updates and a good condition score. Potential buyers and renters will appreciate the fresh paint and updated kitchen.
Value-add opportunities
- Both Painting exterior and interior walls — Fresh paint enhances curb appeal and interior aesthetics.
- Both Replacing carpet with hardwood flooring — Hardwood flooring is more durable and adds value to the property.
- Resale Upgrading kitchen appliances — Modern appliances improve the kitchen's functionality and appeal to potential buyers.
- Rental Installing smart home technology — Smart home features can attract tech-savvy renters and add value to the property.
Renovation cost estimate screening
Value-add ROI direction
- Both Painting exterior and interior walls — Fresh paint enhances curb appeal and interior aesthetics. ↑
- Both Replacing carpet with hardwood flooring — Hardwood flooring is more durable and adds value to the property. ↑
- Resale Upgrading kitchen appliances — Modern appliances improve the kitchen's functionality and appeal to potential buyers. ↑
- Rental Installing smart home technology — Smart home features can attract tech-savvy renters and add value to the property. ↑
ⓘ Cost ranges are severity-bucket heuristics (US national rule-of-thumb). Get contractor quotes + a written scope before underwriting a rehab budget.
Schools (NCES district)
- District
- Stow-Munroe Falls City School District
- NCES district ID
- 3904483
- Math proficiency
- 58% ▼ -11.00%
- Reading proficiency
- 64% ▼ -6.00%
- Median HH income
- $64,663
- Composite
- 53.29/100
- National rank
- #1488
- State rank
- #247 of 656 in OH
Livability — Stow
- Score
- 76/100
- State rank
- #217
- US rank
- #3390
Category grades
Schools grade is shown separately in the Schools card above.
Census & demographics
- Census place
- Stow, OH
- County
- Summit County · 440,783 people
- City population
- 39,200
- Metro
- Akron, OH
- Population (ZIP)
- 39,200
- Household income
- $94,287
- Rent vs Own
- Severe rent burden
- 1165.0
Population outlook (Summit County) Hauer SSP2
- Today (2025)
- 546,583 people
- By 2030
- 544,028 · -0.5%
- By 2040
- 531,363 · -2.8%
- By 2050
- 514,923 · -5.8%
- By 2075
- 481,765 · -11.9%
- By 2100
- 432,265 · -20.9%
Race, ethnicity, and origin ACS 2023
- Neighborhood character
- Predominantly White (85%)
- Race & ethnicity
- White 85% Two or more races 6% Black 5% Asian 3% Hispanic / Latino 2%
- Common ancestry
- Romanian 6% Slovak 3% Italian 3%
- Foreign-born
- 7% · Canada, China
- Languages at home
- 93% English-only · Arabic 2% Spanish 1% Other Asian/Pacific 1%
Political lean MEDSL · Summit
- 2024 margin
- Lean D (+7.0) · D 53.0% · R 46.0%
- 2008→2024 swing
- -9.6pp toward R · 2008: 16.6pp · 2024: 7.0pp
- All cycles
- 2024: D+7.0 2020: D+9.6 2016: D+8.2 2012: D+14.8 2008: D+16.6
Not yet ingested
- Civics
- —
Market trends
- HPI YoY
- ▼ -218.72%
- Current HPI
- 208.3063
- Rent YoY
- ▲ 8.56%
- Metro
- Akron, OH
- State GDP YoY
- ▲ 1.98%
- F500 in state
- 48
Industry mix (Fortune 500 HQ in OH)
| Industry | F500 HQs | Revenue |
|---|---|---|
| Insurance | 3 | $145B |
|
||
| Industrial Machinery | 3 | $49B |
|
||
| Financial Services | 3 | $24B |
|
||
| Consumer Goods | 2 | $93B |
|
||
| Aerospace / Defense | 2 | $47B |
|
||
| Utilities | 2 | $33B |
|
||
Price history
1 event — show timeline
- 2026-06-09 Listed $345,000 MLSNOW
Cash-flow waterfall
monthlySold comps — $/sqft
last 12 mo · ≤1 miLoading sold comps…