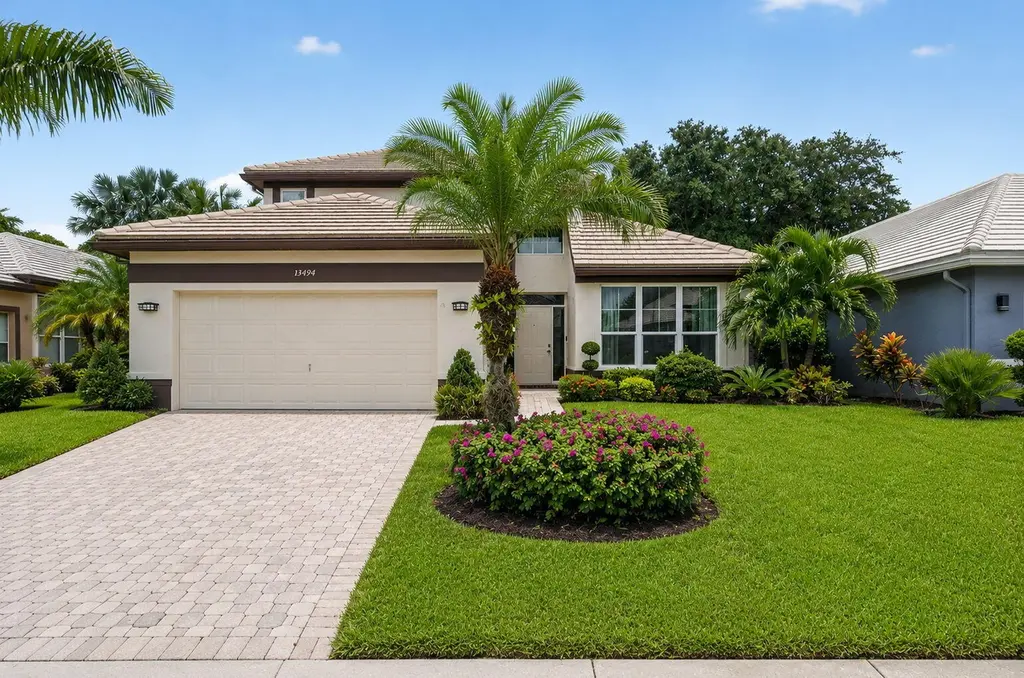
13494 Carrick Green Ct · Delray Beach, FL
Flood risk 1/10 · Minimal
- FEMA flood zone
- X (unshaded)
- Chance of flooding over 30 yrs
- 0.0%
- Est. flood insurance / yr
- $507 – $1,088
Fire risk 4/10 · Minor
- Est. fire insurance / yr
- $947 – $1,759
Heat risk 9/10 · Severe
- Hot days now (above 107°F)
- 7 days/yr
- Hot days in 30 yrs
- 26 days/yr
Wind risk 10/10 · Severe
- Chance of severe wind over 30 yrs
- 99.0%
Air-quality risk 2/10 · Minimal
- Unhealthy air days now
- 0 days/yr
- Unhealthy air days in 30 yrs
- 2 days/yr
Risk factors via First Street. Map © Google.
Why this score? — see what drove the D+ grade
The composite is a weighted blend of 9 inputs, each scored 0–100. Each bar is that input's sub-score; the figure is the points it added to the 100-point composite (weight × sub-score).
- ARV discount +15.0/15.0
- Cash flow +7.9/30.0
- Appreciation +5.3/10.0
- Schools +4.3/10.0
- Livability +3.9/5.0
- 1% rule +2.6/10.0
- Rent growth +2.6/5.0
- Condition / age +2.5/5.0
- DSCR +2.0/10.0
$749,000
🖨 Deal sheet (PDF) 📄 Offer letter ✓ Due diligence
Listing remarks
Welcome to this exceptional 2 story single family residence nestled within the highly sought after Polo Trace ALL AGE community of Delray Beach. Featuring 4 bedrooms, 2.5 bathrooms, and 2,398 square feet of well-designed living space, this home offers the perfect blend of comfort, style, and everyday functionality. Thoughtfully maintained and updated, the property includes a 2022 roof, tankless water heater, and mostly impact glass windows for added peace of mind. Additional features include a dedicated laundry room, 2 car garage, and ceiling fans throughout. Surrounded by lush tropical landscaping, mature palm trees, and a beautifully paved driveway, this home boasts outstanding curb appea
Key facts
- Impact glass windows
- Paved driveway
- 2019 roof
Tags
Property features AI
Finance
- Other: Pets allowed with breed restrictions
- HOA & community: Homeowners association: Polo Trace Delray; Monthly HOA fee; HOA covers cable TV, internet, grounds maintenance, security, common areas, reserve funds, recreation facilities, and pool service; Community amenities include clubhouse, fitness center, heated pool, tennis and pickleball courts, bocce, basketball court, cabana, cafe/restaurant, business center, library, game room, playground, jogging path, sidewalks, street lights, gated entry, on-site management and maintenance
Exterior
- Parking: Attached 2-car garage; Driveway parking; Two covered spaces and two additional open spaces (4 total)
- Security: Gated community with security patrol; Security system; Closed-circuit cameras; Security lights; Smoke detectors
- Utilities: Public sewer; Public water (also well); 200+ amp electric service with multiple 220V circuits (garage, kitchen, laundry); Cable, electricity, and water connected
- Home design: Single family residence; Two-story home; Resale property; Faces west; Located in an all-age community (Polo Trace)
- Construction: Built with block/CONcrete/CB S/stucco and decorative block with stone accents; Concrete and tile roof; Slab foundation; Built by K. Hovnanian Homes (Lexington model)
- Exterior features: Covered and screened patios/porches; Patio; Porch; Many trees; Room for pool; Sidewalks; Oversized lot; Private paved road frontage
Interior
- Kitchen: Dishwasher; Electric range; Microwave; Refrigerator; Garbage disposal; Trash compactor; Freezer; Tankless and electric water heater
- Bedrooms: One bedroom on the main level
- Flooring: Carpet; Tile; Engineered wood
- Bathrooms: Two full bathrooms; One half bathroom
- Heating & cooling: Central electric heating; Central air conditioning; Ceiling fans
- Interior features: Cathedral and vaulted ceilings; High ceilings; Entrance foyer; Kitchen island; Walk-in closets; Split bedroom layout; Upstairs living area; Cabana bath; Intercom; Partially furnished
- Laundry & utility: In-unit laundry; Washer hookup; Laundry room; Laundry on main and lower levels; Utility sink
Neighborhood map
What this means for you Summary
Snapshot
- This is a 4-bed/2.5-bath single-family listed at $749k.
Deal economics
- At list price, monthly cash flow is $-802 ($-10k/yr) — negative.
- To cash-flow at today's rent, offer at most $607k (18.9% below list).
- To meet the 1% rule (rent ≥ 1% of price), the offer needs to be $566k (24.5% below list).
- Recommended offer: $566k (24.5% below list) — sets the bar for 1% rule.
Location & tenants
- Location reads 77/100 on livability (#202 in FL, #3,160 nationally) — a middle-class / working-renter tenant base. Strengths: housing A+, health & safety A+, commute A-; Watch: cost of living C-, crime D-, amenities F.
- Palm Beach (suburban): math 46% / reading 53% proficiency, ranked #34 of 73 in FL (top 47%) — families likely to look elsewhere, expect single-tenant / working-renter base with shorter leases.
- Zoned schools: Hagen Road Elementary School (math 55% / reading 63%, grade B-, #722 of 2,144 statewide, top 34%, 773 students, 46% FRL); Carver Middle School (math 22% / reading 34%, grade F, #486 of 571 statewide, top 86%, 732 students, 73% FRL); Spanish River Community High School (math 64% / reading 74%, grade B, #63 of 667 statewide, top 10%, 2,578 students, 25% FRL) — zoned schools at 48% FRL track the district average.
- Market conditions: Rents flat; 584 active listings in the ZIP; 13 comparable units currently listed for rent nearby; rentals at typical pace (median 21d on market — plan ~3-4 weeks tenant-placement turnaround); solid renter incomes; 3,974 units permitted in Palm Beach County in 2024 (1,012 in 5+ unit buildings).
- At $5,658/mo this rent would consume 85% of the median local household income ($80k/yr) (locally 494% of renters already pay >50% of income on rent) — very limited rent-growth headroom before tenants either downsize or default.
Forward outlook
- In year one you build about $10k of equity ($5k loan paydown + $5k appreciation (0.7% local appreciation)).
- Palm Beach County population projected at +30% by 2050 — long-run rental-demand tailwind backs the buy-and-hold thesis.
- By year 5, paydown + projected appreciation supports a ~$50k cash-out refi (75% LTV) — recoverable capital for the next deal without selling this one.
Negotiation context
- Only 6 days on market — expect competitive offers; lowballing is unlikely to land.
- Current owner paid $193k; list at $749k implies a 288% gain — meaningful room to come down on a strong offer.
Risks & watch-outs
- Climate carrying-cost: severe wind risk, 99% chance of damaging wind over 30y; extreme-heat days projected 7→26/yr by 2055 (HVAC capex compounding) — expect insurance premiums to compound above CPI over the hold.
Questions for the listing agent
- What do current leases actually rent for vs. the listed asking? Can we see a recent rent roll and the last 12 months of T-12 income?
- What does the HOA fee cover, when was the last increase, and are there any pending special assessments or reserve-fund shortfalls?
- Is there a deadline driving the sale (1031 exchange, divorce, estate, relocation)? That informs how much negotiation room exists.
- Schools are B-rated — typically a magnet for longer-tenancy family renters. What's the average tenant stay here, and is there a school-zone premium baked into asking?
- Crime grade is D in this area — have there been break-ins, vandalism, or insurance claims at this property in the last 3 years? What carrier currently insures it and at what premium?
- The area grade is low — what's the realistic commute time and amenity access for the typical tenant pool here? Any planned neighborhood developments (good or bad) we should know about?
- What's the average days-on-market for RENTAL listings here right now (not sales)? A rising rental-DOM trend means longer vacancies and softer asking-rent achievability than the comps imply.
- What's the recent tenant-quality profile in this submarket — average credit score on applications, eviction rate, late-payment / NSF rate, and stable-employment percentage? A property-management company in the area should have these aggregated.
- How much new for-sale + rental construction is in the pipeline within 1–3 miles? Heavy new supply typically softens prices + rents 12–24 months out; constrained supply supports both.
Investment metrics
- 1% rule
- 0.76% ✗
- Cap rate
- 5.01%
- Cash-on-cash
- -4.59%
- DSCR
- 0.80
- GRM
- 11.0
CMA / ARV
- ARV (on-the-fly)
- $1,367,000
- Comps found
- 1
Show comp detail 1 sale within ~0.75 mi
| Address | Dist | Beds/Ba | Sqft | Sold | Price | $/sf | Match |
|---|---|---|---|---|---|---|---|
| 13402 Whistler Mountain Rd | 0.12mi | 3/2.5 (-1) | 2,362 (-14%) | 9mo | $1,180,000 | $500 | 59 |
Match score weights: distance 35% · size 25% · config 20% · recency 20%. Top-matched comps best support the ARV.
Projected returns pro-forma
0.69% appreciation · 0.51% rent growth · sell at horizon
- IRR
- -6.1%
- Equity multiple
- 0.70×
- Total profit
- $-62,179
- Equity at exit
- $243,563
- IRR
- -2.0%
- Equity multiple
- 0.78×
- Total profit
- $-46,552
- Equity at exit
- $314,490
Cash invested: $209,720 (down + closing). Projections, not guarantees.
Landlord ↔ Tenant lean methodology
- Overall (STATE)
- 87 Strongly Landlord-Friendly
- State Florida
- 87 Strongly Landlord-Friendly · R+3
- County
- — inherits STATE
- City
- — inherits STATE
ZIP-level market 33446
- Home prices YoY
- 0.3%
- Rents YoY
- 0.5%
- Active inventory
- 584
- Price-to-rent
- 11.0×
Monthly cashflow live
- Estimated rent
- $5,658 high interval (Pro) →
- Mortgage (P&I)
- −$3,928
- Tax from tax record
- −$336 /mo · $4,038/yr
- Insurance
- −$312
- HOA
- −$696
- Vacancy / Maint / Mgmt
- −$1,188
- Net cashflow
- $-802
Break-even live
Sensitivity live
| Price | -10% $-378 | -5% $-590 | +0% $-802 | +5% $-1,014 | +10% $-1,226 |
|---|---|---|---|---|---|
| Rent | -10% $-1,249 | -5% $-1,026 | +0% $-802 | +5% $-579 | +10% $-355 |
| Rate | -1.0pp $-425 | -0.5pp $-612 | base $-802 | +0.5pp $-996 | +1.0pp $-1,194 |
UW: 25.0% down · 7.5% · 30yr · 1.5% tax · 5.0% vac · 8.0% maint · 8.0% mgmt
Financing live
Cash to close
- Down payment
- $187,250
- Closing costs
- $22,470
- Reserves months
- —
- Total cash needed
- —
Loan-product check · same deal, 3 products live
Conventional
25% down · 7.5% · 30yr
- Down + closing
- —
- Monthly P&I
- —
- Monthly cashflow
- —
- DSCR
- —
- Eligible?
- —
Personal DTI + credit; lowest rate.
DSCR
20% down · 8.5% · 30yr
- Down + closing
- —
- Monthly P&I
- —
- Monthly cashflow
- —
- DSCR
- —
- Eligible?
- —
No personal income docs; deal must DSCR.
Hard money
10% down · 12.0% · 12mo
- Down + closing
- —
- Monthly P&I
- —
- Monthly cashflow
- —
- DSCR
- —
- Eligible?
- —
Short-term bridge; refi at stabilization.
Rent comps 13 comps
| Address | Beds | Baths | Sqft | Rent | $/sqft | DOM | Units | Dist |
|---|---|---|---|---|---|---|---|---|
| 7879 Monarch Ct Delray Beach, FL | 4.0 | 3.0 | 2871 | $7,500 | $2.61 | 26d | 1 | 0.42mi |
| 7879 Monarch Ct Delray Beach, FL | 4.0 | 3.0 | 2871 | $7,500 | $2.61 | 6d | 1 | 0.42mi |
| 7904 Mansfield Hollow Rd Delray Beach, FL | 3.0 | 2.0 | 1865 | $3,950 | $2.12 | 26d | 1 | 0.43mi |
| 8072 Cactus Quartz Cir Delray Beach, FL | 4.0 | 3.0 | 2305 | $5,800 | $2.52 | 26d | 1 | 0.65mi |
| 8068 Lemon Serpentine Ln Delray Beach, FL | 4.0 | 3.0 | 2656 | $6,195 | $2.33 | 22d | 1 | 0.67mi |
| 8092 Lemon Serpentine Ln Delray Beach, FL | 5.0 | 4.0 | 2584 | $5,800 | $2.24 | 26d | 1 | 0.70mi |
| 6812 Belmont Shore Dr Delray Beach, FL | 3.0 | 2.5 | 2353 | $4,250 | $1.81 | 20d | 1 | 0.78mi |
| 13658 Cambria Bay Ln Delray Beach, FL | 3.0 | 2.5 | 2353 | $4,000 | $1.70 | 0d | 1 | 0.80mi |
| 14018 Gold Tigereye Trl Delray Beach, FL | 4.0 | 3.0 | 2305 | $5,600 | $2.43 | 17d | 1 | 0.82mi |
| 12882 Granite Mountain Pass Boynton Beach, FL | 3.0 | 3.0 | 2679 | $10,000 | $3.73 | 1d | 1 | 0.83mi |
| 14184 Rock Salt Rd Delray Beach, FL | 4.0 | 3.0 | 2305 | $5,450 | $2.36 | 26d | 1 | 0.97mi |
| 12196 Landrum Way Boynton Beach, FL | 3.0 | 2.5 | 2436 | $4,750 | $1.95 | 0d | 1 | 1.15mi |
| 8263 Arabian Range Rd Boynton Beach, FL | 4.0 | 3.0 | 2309 | $6,000 | $2.60 | 7d | 1 | 1.17mi |
HOA detail
- Monthly dues
- $696 · $8,352/yr
- Likely covers
- waterlandscaping
Listing history 5 events
-
2026-06-21days on market $749,000 Active 6 DOM
-
2026-06-18days on market $749,000 Active 3 DOM
-
2026-06-17days on market $749,000 Active 2 DOM
-
2026-06-16remarks 699-char remark
-
2026-06-16$749,000 Active 1 DOM
ⓘ Source: listings_history table (triggers on properties + properties_extension) + one-shot
backfill from property_details.listing_events for pre-trigger history.
Tax reassessment forecast FL · Resets to sale price
- Current annual tax
- $4,038 · $336/mo
- Projected year-2 tax
- $6,217 · $518/mo
- Expected delta
- +$2,179/yr (+$182/mo · 54.0%)
ⓘ Screening estimate from a state-policy table — verify with the county assessor before closing.
Climate risk First Street
- Flood 1/10 Low FEMA zone X (unshaded) · 0% chance over 30 yrs
- Wildfire 4/10 Moderate
- Heat 9/10 Extreme 7 d/yr ≥107°F today · 26 d/yr by 30 yrs out
- Wind 10/10 Extreme 99% chance of damaging wind over 30 yrs
- Air quality 2/10 Low 0 unhealthy d/yr today · 2 by 30 yrs out
Nearby sold comps map
Loading sold comps map…
Walkable amenities ~0.75 mi
Loading nearby amenities…
Taxation est. · year 1
- Rental income
- $67,902
- − Mortgage interest
- −$41,956
- − Property taxes
- −$4,038
- − Insurance
- −$3,745
- − Repairs & maintenance
- −$5,432
- − Management
- −$5,432
- − HOA
- −$8,352
- − Depreciation
- −$21,789
- Taxable loss
- −$22,842
- Est. tax savings @ 24.0%
- +$5,482
- After-tax cash flow
- $-4,144/yr
For passive investors: Depreciation is non-cash, so a rental often shows a tax loss while cash-flowing — sheltering income. Rental losses are passive: they offset passive income freely, and up to $25,000/yr can offset ordinary (W-2) income if you actively participate and your MAGI is under $100k (phasing out to $0 by $150k); unused losses carry forward. On sale, claimed depreciation is recaptured at up to 25%, and gains may owe capital-gains tax (a 1031 exchange can defer both). Figures are a year-1 estimate at your 24.0% rate — not tax advice; consult a CPA.
Schools (NCES district)
- District
- Palm Beach
- NCES district ID
- 1201500
- Math proficiency
- 46% ▼ -16.00%
- Reading proficiency
- 53% ▼ -4.00%
- Median HH income
- $53,943
- Composite
- 42.72/100
- National rank
- #3160
- State rank
- #34 of 73 in FL
Livability — Delray Beach
- Score
- 77/100
- State rank
- #202
- US rank
- #3160
Category grades
Schools grade is shown separately in the Schools card above.
Census & demographics
- County
- Palm Beach County · 1,438,312 people
- City population
- 123,167
- Metro
- Miami-Fort Lauderdale-Pompano Beach, FL
- Population (ZIP)
- 28,431
- Household income
- $80,187
- Rent vs Own
- Severe rent burden
- 494.0
Population outlook (Palm Beach County) Hauer SSP2
- Today (2025)
- 1,637,487 people
- By 2030
- 1,743,255 · +6.5%
- By 2040
- 1,948,712 · +19.0%
- By 2050
- 2,132,979 · +30.3%
- By 2075
- 2,530,027 · +54.5%
- By 2100
- 2,706,979 · +65.3%
Race, ethnicity, and origin ACS 2023
- Neighborhood character
- Predominantly White (79%)
- Race & ethnicity
- White 79% Hispanic / Latino 13% Two or more races 9% Black 4%
- Hispanic origin (detail)
- Puerto Rican 3% Dominican 1%
- Common ancestry
- Romanian 9% Scotch-Irish 9% Italian 2%
- Foreign-born
- 20% · Canada, Jamaica, Guatemala
- Languages at home
- 80% English-only · Spanish 12% Other Indo-European 2% French/Haitian/Cajun 2%
Political lean MEDSL · Palm Beach
- 2024 margin
- Toss-up / Even · D 50.0% · R 49.2%
- 2008→2024 swing
- -22.1pp toward R · 2008: 22.9pp · 2024: 0.8pp
- All cycles
- 2024: D+0.8 2020: D+12.8 2016: D+15.3 2012: D+17.0 2008: D+22.9
Not yet ingested
- Civics
- —
Market trends
- HPI YoY
- ▲ 0.69%
- Current HPI
- 242.5138
- Rent YoY
- ▲ 0.51%
- Metro
- Miami-Fort Lauderdale-Pompano Beach, FL
- State GDP YoY
- ▲ 3.28%
- F500 in state
- 36
Industry mix (Fortune 500 HQ in FL)
| Industry | F500 HQs | Revenue |
|---|---|---|
| Industrial Technology | 2 | $29B |
|
||
| Insurance | 2 | $17B |
|
||
| Retail | 1 | $60B |
|
||
| Technology Distribution | 1 | $58B |
|
||
| Homebuilding | 1 | $35B |
|
||
| Technology Manufacturing | 1 | $35B |
|
||
Price history
+288.1% since first listed2 events — show timeline
- 2026-06-15 Listed $749,000 Beaches MLS
- 1995-05-01 Sold (Public Records) $193,000 Public Records
Property tax history
+1.3%/yrLatest (2025): $4,038 · +3.2% YoY. Source: county tax records.
Cash-flow waterfall
monthlySold comps — $/sqft
last 12 mo · ≤1 miLoading sold comps…