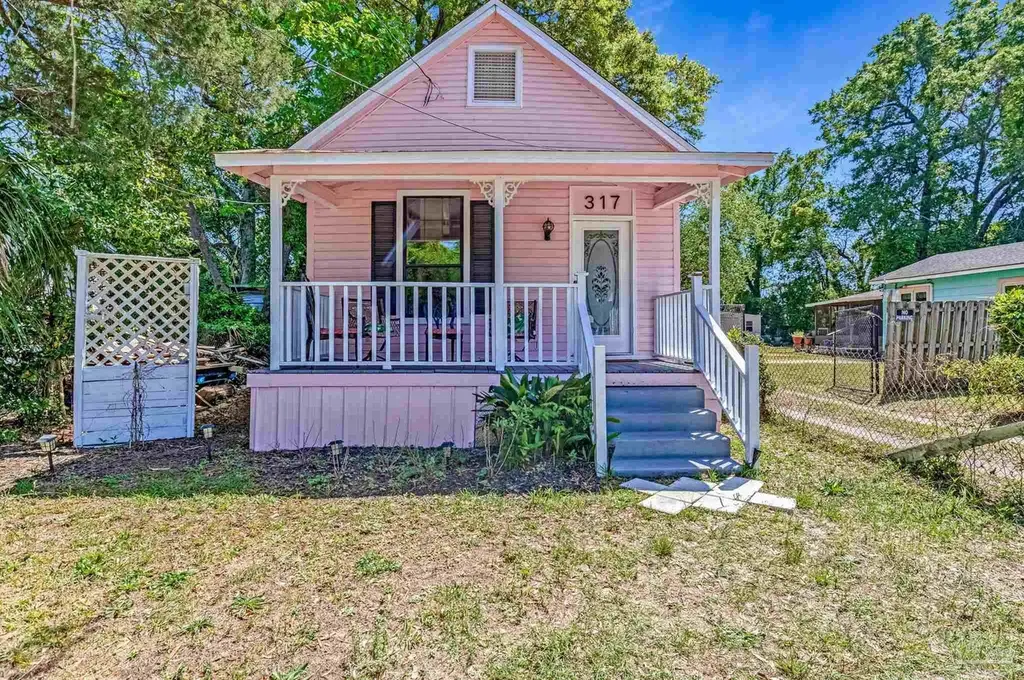
317 E Lee St · Pensacola, FL
Flood risk 1/10 · Minimal
- FEMA flood zone
- X (unshaded)
- Chance of flooding over 30 yrs
- 0.0%
- Est. flood insurance / yr
- $507 – $1,088
Fire risk 1/10 · Minimal
- Est. fire insurance / yr
- $947 – $1,759
Heat risk 10/10 · Severe
- Hot days now (above 105°F)
- 7 days/yr
- Hot days in 30 yrs
- 22 days/yr
Wind risk 9/10 · Severe
- Chance of severe wind over 30 yrs
- 99.0%
Air-quality risk 2/10 · Minimal
- Unhealthy air days now
- 0 days/yr
- Unhealthy air days in 30 yrs
- 1 days/yr
Risk factors via First Street. Map © Google.
Why this score? — see what drove the D grade
The composite is a weighted blend of 9 inputs, each scored 0–100. Each bar is that input's sub-score; the figure is the points it added to the 100-point composite (weight × sub-score).
- ARV discount +14.4/15.0
- Cash flow +10.6/30.0
- Livability +4.2/5.0
- Schools +3.6/10.0
- Rent growth +3.3/5.0
- DSCR +3.1/10.0
- 1% rule +2.8/10.0
- Condition / age +2.5/5.0
- Appreciation +0.0/10.0
$225,000
🖨 Deal sheet (PDF) 📄 Offer letter ✓ Due diligence
Listing remarks MLS
Well-located 2 bedroom, 2 bathroom home offering 1,042 square feet of comfortable, easy living. Inside, the home features a bright, neutral interior with updated finishes, including stainless steel appliances in the kitchen, warm wood cabinetry, and a layout that flows naturally between the main living spaces. The living and dining areas feel open and inviting, with plenty of natural light, while the bedrooms are well-sized with good storage. Both bathrooms have been updated with clean, modern touches, giving the home a fresh, move-in ready feel. Additional features include a dedicated laundry area, ample closet space, and a practical layout that works well for everyday living or rental use. Situated within walking distance to Hollice T. Williams Park and the Cecil T. Hunter Public Pool- currently undergoing a multimillion-dollar renovation - you’ll have convenient access to outdoor space and a growing community amenity. The surrounding area continues to see new construction and redevelopment, adding to the overall appeal of the location. Schedule your private showing today!
Key facts
- Warm wood cabinetry
- Ample closet space
- 3,541 sq ft lot
Tags
Neighborhood map
What this means for you Summary
Snapshot
- This is a 2-bed/1.0-bath single-family listed at $225k.
Deal economics
- At list price, monthly cash flow is $-112 ($-1k/yr) — negative.
- To cash-flow at today's rent, offer at most $205k (8.8% below list).
- To meet the 1% rule (rent ≥ 1% of price), the offer needs to be $175k (22.3% below list).
- Recommended offer: $175k (22.3% below list) — sets the bar for 1% rule.
- Cap rate 5.7% vs local median 3.6% in Pensacola — top-decile yield for the area; either an underpriced asset or a hidden risk that comps aren't pricing in. Stress-test before assuming the spread holds.
Location & tenants
- Location reads 83/100 on livability (#53 in FL, #924 nationally) — a professional / high-income tenant draw. Strengths: commute A+, cost of living A+, housing A+.
- Escambia (suburban): math 40% / reading 45% proficiency, ranked #56 of 73 in FL (top 77%) — families likely to look elsewhere, expect single-tenant / working-renter base with shorter leases.
- Zoned schools: Global Learning Academy (math 11% / reading 19%, grade F, #2,132 of 2,144 statewide, top 100%, 470 students, 90% FRL); J. H. Workman Middle School (math 20% / reading 27%, grade F, #536 of 571 statewide, top 95%, 705 students, 72% FRL); Pensacola High School (math 29% / reading 50%, grade F, #304 of 667 statewide, top 47%, 1,229 students, 55% FRL).
- Zoned-school proficiency averages 26% at this address vs 42% district-wide (-16 pts) — the specific schools serving this property underperform the Escambia average; the district grade overstates school quality for this exact location.
- Market conditions: Rents rising (+3.4%/yr); 240 active listings in the ZIP; 26 comparable units currently listed for rent nearby; rentals at typical pace (median 26d on market — plan ~3-4 weeks tenant-placement turnaround); 1,479 units permitted in Escambia County in 2024 (0 in 5+ unit buildings).
Forward outlook
- Local home prices are declining (-3.0%/yr); year-one equity from $2k of loan paydown is wiped out by about $7k of value loss. Plan a longer hold.
- Escambia County population projected at +13% by 2050 — modest demand growth; plan on rents tracking national, not racing it.
Negotiation context
- It's been on market 72 days — a 6% lower offer ($212k) is reasonable based on typical stale-listing flexibility.
- 3 sale attempts since 2y ago with the ask held roughly flat each time — persistent listings suggest the price (not the market) is what's stuck; bring a comps-based counter.
- Current owner paid $100k; list at $225k implies a 125% gain — meaningful room to come down on a strong offer.
Risks & watch-outs
- Watch-outs: built in 1918 — expect roof / HVAC / electrical / plumbing capex.
- Climate carrying-cost: severe wind risk, 99% chance of damaging wind over 30y; extreme-heat days projected 7→22/yr by 2055 (HVAC capex compounding) — expect insurance premiums to compound above CPI over the hold.
Questions for the listing agent
- What do current leases actually rent for vs. the listed asking? Can we see a recent rent roll and the last 12 months of T-12 income?
- It's been on market 72 days. Have you received any prior offers? Is the seller open to a 22% concession, seller financing, or rate buy-down credit?
- Built in 1918 — when were the roof, HVAC, electrical panel, plumbing, and water heater last replaced?
- Why hasn't it sold? Are there any deal-killer items the seller is aware of (foundation, flood, title, zoning, code violations)?
- Is there a deadline driving the sale (1031 exchange, divorce, estate, relocation)? That informs how much negotiation room exists.
- The area grade is low — what's the realistic commute time and amenity access for the typical tenant pool here? Any planned neighborhood developments (good or bad) we should know about?
- What's the average days-on-market for RENTAL listings here right now (not sales)? A rising rental-DOM trend means longer vacancies and softer asking-rent achievability than the comps imply.
- What's the recent tenant-quality profile in this submarket — average credit score on applications, eviction rate, late-payment / NSF rate, and stable-employment percentage? A property-management company in the area should have these aggregated.
- How much new for-sale + rental construction is in the pipeline within 1–3 miles? Heavy new supply typically softens prices + rents 12–24 months out; constrained supply supports both.
Investment metrics
- 1% rule
- 0.78% ✗
- Cap rate
- 5.70%
- Cash-on-cash
- -2.13%
- DSCR
- 0.91
- GRM
- 10.7
CMA / ARV
- ARV (median comp)
- $265,407
- List price
- $225,000
- Delta
- -15.22%
- Verdict
- UNDERPRICED
- Comps
- 20 within 1.0 mi
Show comp detail 12 sales within ~0.75 mi
| Address | Dist | Beds/Ba | Sqft | Sold | Price | $/sf | Match |
|---|---|---|---|---|---|---|---|
| 410 E Desoto | 0.25mi | 2/1.0 | 900 (-14%) | 2mo | $140,000 | $156 | 64 |
| 1206 N 7th Ave | 0.24mi | 2/2.0 | 900 (-14%) | 4mo | $234,000 | $260 | 59 |
| 815 N 8th Ave | 0.42mi | 2/2.0 | 1,150 (+10%) | 2mo | $389,000 | $338 | 58 |
| 505 N Alcaniz St | 0.57mi | 2/1.5 | 1,056 (+1%) | 17mo | $394,500 | $374 | 55 |
| 408 N Hayne St | 0.62mi | 3/1.0 (+1) | 1,067 (+2%) | 12mo | $100,000 | $94 | 52 |
| 215 E Hernandez St | 0.40mi | 3/2.0 (+1) | 1,120 (+8%) | 13mo | $220,000 | $196 | 49 |
| 2412 N 7th Ave | 0.75mi | 3/2.0 (+1) | 1,084 (+4%) | 4mo | $210,000 | $194 | 46 |
| 2345 N 8th Ave | 0.70mi | 3/2.0 (+1) | 1,120 (+8%) | 2mo | $234,000 | $209 | 44 |
| 506 E Jordan St | 0.51mi | 2/1.0 | 902 (-13%) | 15mo | $90,000 | $100 | 42 |
| 2013 N 11th Ave | 0.64mi | 3/1.0 (+1) | 1,158 (+11%) | 7mo | $290,000 | $250 | 41 |
| 110 E Jordan St | 0.52mi | 3/2.0 (+1) | 1,196 (+15%) | 2mo | $238,000 | $199 | 41 |
| 1119 N Devilliers St | 0.73mi | 2/2.0 | 1,119 (+7%) | 14mo | $330,000 | $295 | 38 |
Match score weights: distance 35% · size 25% · config 20% · recency 20%. Top-matched comps best support the ARV.
Projected returns pro-forma
-3.0% appreciation · 3.39% rent growth · sell at horizon
- IRR
- -19.4%
- Equity multiple
- 0.32×
- Total profit
- $-42,889
- Equity at exit
- $33,548
- IRR
- -11.4%
- Equity multiple
- 0.31×
- Total profit
- $-43,697
- Equity at exit
- $19,454
Cash invested: $63,000 (down + closing). Projections, not guarantees.
Landlord ↔ Tenant lean methodology
- Overall (STATE)
- 87 Strongly Landlord-Friendly
- State Florida
- 87 Strongly Landlord-Friendly · R+3
- County
- — inherits STATE
- City
- — inherits STATE
ZIP-level market 32503
- Rents YoY
- 3.4%
- Active inventory
- 240
- Price-to-rent
- 10.7×
Monthly cashflow live
- Estimated rent
- $1,748 high interval (Pro) →
- Mortgage (P&I)
- −$1,180
- Tax from tax record
- −$219 /mo · $2,629/yr
- Insurance
- −$94
- HOA
- −$0
- Vacancy / Maint / Mgmt
- −$367
- Net cashflow
- $-112
Break-even live
Sensitivity live
| Price | -10% $16 | -5% $-48 | +0% $-112 | +5% $-175 | +10% $-239 |
|---|---|---|---|---|---|
| Rent | -10% $-250 | -5% $-181 | +0% $-112 | +5% $-43 | +10% $27 |
| Rate | -1.0pp $2 | -0.5pp $-54 | base $-112 | +0.5pp $-170 | +1.0pp $-229 |
UW: 25.0% down · 7.5% · 30yr · 1.5% tax · 5.0% vac · 8.0% maint · 8.0% mgmt
Financing live
Cash to close
- Down payment
- $56,250
- Closing costs
- $6,750
- Reserves months
- —
- Total cash needed
- —
Loan-product check · same deal, 3 products live
Conventional
25% down · 7.5% · 30yr
- Down + closing
- —
- Monthly P&I
- —
- Monthly cashflow
- —
- DSCR
- —
- Eligible?
- —
Personal DTI + credit; lowest rate.
DSCR
20% down · 8.5% · 30yr
- Down + closing
- —
- Monthly P&I
- —
- Monthly cashflow
- —
- DSCR
- —
- Eligible?
- —
No personal income docs; deal must DSCR.
Hard money
10% down · 12.0% · 12mo
- Down + closing
- —
- Monthly P&I
- —
- Monthly cashflow
- —
- DSCR
- —
- Eligible?
- —
Short-term bridge; refi at stabilization.
Rent comps 26 comps
| Address | Beds | Baths | Sqft | Rent | $/sqft | DOM | Units | Dist |
|---|---|---|---|---|---|---|---|---|
| 1106 Doctor Martin Luther King Junior Dr Unit A Pensacola, FL | 2.0 | 1.0 | 762 | $1,295 | $1.70 | 16d | 1 | 0.20mi |
| 1011 Doctor M.L.K. Jr Dr Unit B Pensacola, FL | 2.0 | 1.0 | 877 | $1,200 | $1.37 | 25d | 1 | 0.25mi |
| 801 E Gonzalez St Pensacola, FL | 3.0 | 2.0 | 1200 | $2,200 | $1.83 | 16d | 1 | 0.36mi |
| 2008 N 8th Ave Pensacola, FL | 3.0 | 2.0 | 1058 | $1,250 | $1.18 | 16d | 1 | 0.51mi |
| 307 E La Rua St Pensacola, FL | 2.0 | 1.0 | 826 | $1,575 | $1.91 | 23d | 1 | 0.62mi |
| 422 N Davis Hwy Pensacola, FL | 2.0 | 1.5 | 941 | $2,100 | $2.23 | 25d | 1 | 0.63mi |
| 511 E La Rua St Pensacola, FL | 3.0 | 1.0 | 1128 | $1,475 | $1.31 | 16d | 1 | 0.64mi |
| 504 N Spring St Unit B Pensacola, FL | 3.0 | 1.5 | 1485 | $1,995 | $1.34 | 25d | 1 | 0.74mi |
| 407 W Jordan St Unit NA Pensacola, FL | 3.0 | 2.0 | 1300 | $2,200 | $1.69 | 25d | 1 | 0.76mi |
| 2115 N 12th Ave Pensacola, FL | 2.0 | 1.5 | 950 | $1,800 | $1.89 | 16d | 1 | 0.77mi |
| 1215 N C St Pensacola, FL | 3.0 | 1.0 | 1203 | $1,775 | $1.48 | 16d | 1 | 0.85mi |
| 1414 E Mallory St Pensacola, FL | 3.0 | 2.0 | 1323 | $3,400 | $2.57 | 25d | 1 | 0.87mi |
| 721 W Jordan St Pensacola, FL | 3.0 | 2.0 | 1030 | $1,895 | $1.84 | 25d | 1 | 0.88mi |
| 1010 N D St Pensacola, FL | 2.0 | 2.0 | 1196 | $1,850 | $1.55 | 25d | 1 | 0.94mi |
| 615 N A St Pensacola, FL | 3.0 | 2.0 | 1122 | $1,900 | $1.69 | 16d | 1 | 0.96mi |
| 218 Junction Ave Pensacola, FL | 2.0 | 2.5 | 1295 | $2,400 | $1.85 | 25d | 1 | 1.01mi |
| 220 W Chase St Pensacola, FL | 2.0 | 1.0 | 648 | $1,241 | $1.92 | 25d | 1 | 1.02mi |
| 811 N D St Pensacola, FL | 2.0 | 2.0 | 1035 | $1,395 | $1.35 | 25d | 1 | 1.04mi |
| 814 N E St Pensacola, FL | 3.0 | 2.0 | 1440 | $1,695 | $1.18 | 25d | 1 | 1.06mi |
| 1704 E Lee St Pensacola, FL | 3.0 | 2.0 | 1226 | $2,295 | $1.87 | 25d | 1 | 1.08mi |
| 101 E Romana St Pensacola, FL | 3.0 | 1.0–2.0 | 987 | $2,288 | $2.32 | 16d | 20 | 1.13mi |
| 418 N C St Pensacola, FL | 3.0 | 2.0 | 1017 | $2,775 | $2.73 | 16d | 1 | 1.13mi |
| 410 N C St Unit 1367374P Pensacola, FL | 3.0 | 2.0 | 1291 | $3,313 | $2.57 | 16d | 1 | 1.14mi |
| 3131 N 10th Ave Pensacola, FL | 3.0 | 1.5 | 1085 | $1,700 | $1.57 | 25d | 1 | 1.20mi |
| 1720 E La Rua St Unit A Pensacola, FL | 2.0 | 1.0 | 800 | $1,550 | $1.94 | 25d | 1 | 1.26mi |
| 510 N G St Pensacola, FL | 2.0 | 1.0 | 704 | $850 | $1.21 | 25d | 1 | 1.29mi |
Listing history 24 events
-
2026-06-21days on market $225,000 Active 72 DOM
-
2026-06-18days on market $225,000 Active 69 DOM
-
2026-06-17days on market $225,000 Active 68 DOM
-
2026-06-16days on market $225,000 Active 67 DOM
-
2026-06-15days on market $225,000 Active 66 DOM
-
2026-06-14days on market $225,000 Active 64 DOM
-
2026-06-10days on market $225,000 Active 61 DOM
-
2026-06-09days on market $225,000 Active 60 DOM
-
2026-06-08days on market $225,000 Active 59 DOM
-
2026-06-07days on market $225,000 Active 58 DOM
-
2026-06-03days on market $225,000 Active 54 DOM
-
2026-06-02days on market $225,000 Active 53 DOM
-
2026-06-01days on market $225,000 Active 52 DOM
-
2026-05-31days on market $225,000 Active 51 DOM
-
2026-05-31days on market $225,000 Active 50 DOM
-
2026-04-10$225,000 Active 1101-char remark
Show marketing remark (1101 chars)
Well-located 2 bedroom, 2 bathroom home offering 1,042 square feet of comfortable, easy living. Inside, the home features a bright, neutral interior with updated finishes, including stainless steel appliances in the kitchen, warm wood cabinetry, and a layout that flows naturally between the main living spaces. The living and dining areas feel open and inviting, with plenty of natural light, while the bedrooms are well-sized with good storage. Both bathrooms have been updated with clean, modern touches, giving the home a fresh, move-in ready feel. Additional features include a dedicated laundry area, ample closet space, and a practical layout that works well for everyday living or rental use. Situated within walking distance to Hollice T. Williams Park and the Cecil T. Hunter Public Pool- currently undergoing a multimillion-dollar renovation - you’ll have convenient access to outdoor space and a growing community amenity. The surrounding area continues to see new construction and redevelopment, adding to the overall appeal of the location. Schedule your private showing today!
-
2025-12-30historical
-
2025-06-29$276,000 Active
-
2024-09-10soldstatus $99,900
-
2024-09-05status Pending
-
2024-09-04soldstatus $99,900 Sold
-
2024-07-25historical Contingent
-
2024-07-22$99,900 Active
-
2006-01-12soldstatus $37,000
ⓘ Source: listings_history table (triggers on properties + properties_extension) + one-shot
backfill from property_details.listing_events for pre-trigger history.
Tax reassessment forecast FL · Resets to sale price
- Current annual tax
- $2,629 · $219/mo
- Projected year-2 tax
- $2,629 · $219/mo
- Expected delta
- $0/yr ($0/mo · 0.0%)
ⓘ Screening estimate from a state-policy table — verify with the county assessor before closing.
Climate risk First Street
- Flood 1/10 Low FEMA zone X (unshaded) · 0% chance over 30 yrs
- Wildfire 1/10 Low
- Heat 10/10 Extreme 7 d/yr ≥105°F today · 22 d/yr by 30 yrs out
- Wind 9/10 Extreme 99% chance of damaging wind over 30 yrs
- Air quality 2/10 Low 0 unhealthy d/yr today · 1 by 30 yrs out
Nearby sold comps map
Loading sold comps map…
Walkable amenities ~0.75 mi
Loading nearby amenities…
Taxation est. · year 1
- Rental income
- $20,980
- − Mortgage interest
- −$12,603
- − Property taxes
- −$2,629
- − Insurance
- −$1,125
- − Repairs & maintenance
- −$1,678
- − Management
- −$1,678
- − Depreciation
- −$6,545
- Taxable loss
- −$5,280
- Est. tax savings @ 24.0%
- +$1,267
- After-tax cash flow
- $-72/yr
For passive investors: Depreciation is non-cash, so a rental often shows a tax loss while cash-flowing — sheltering income. Rental losses are passive: they offset passive income freely, and up to $25,000/yr can offset ordinary (W-2) income if you actively participate and your MAGI is under $100k (phasing out to $0 by $150k); unused losses carry forward. On sale, claimed depreciation is recaptured at up to 25%, and gains may owe capital-gains tax (a 1031 exchange can defer both). Figures are a year-1 estimate at your 24.0% rate — not tax advice; consult a CPA.
Schools (NCES district)
- District
- Escambia
- NCES district ID
- 1200510
- Math proficiency
- 40% ▼ -9.00%
- Reading proficiency
- 45% ▼ -4.00%
- Median HH income
- $44,649
- Composite
- 36.04/100
- National rank
- #4773
- State rank
- #56 of 73 in FL
Livability — Pensacola
- Score
- 83/100
- State rank
- #53
- US rank
- #924
Category grades
Schools grade is shown separately in the Schools card above.
Census & demographics
- Census place
- Pensacola, FL
- County
- Escambia County · 301,722 people
- City population
- 237,636
- Metro
- Pensacola-Ferry Pass-Brent, FL
- Population (ZIP)
- 33,559
- Household income
- $71,411
- Rent vs Own
- Severe rent burden
- 948.0
Population outlook (Escambia County) Hauer SSP2
- Today (2025)
- 334,637 people
- By 2030
- 345,779 · +3.3%
- By 2040
- 364,828 · +9.0%
- By 2050
- 378,514 · +13.1%
- By 2075
- 403,220 · +20.5%
- By 2100
- 386,125 · +15.4%
Race, ethnicity, and origin ACS 2023
- Neighborhood character
- Predominantly White (68%)
- Race & ethnicity
- White 68% Black 20% Two or more races 6% Hispanic / Latino 5% Asian 2%
- Common ancestry
- Lithuanian 3% Italian 2% Romanian 2%
- Foreign-born
- 5% · Canada, China
- Languages at home
- 93% English-only · Spanish 3% Arabic 1% Tagalog/Filipino 1%
Political lean MEDSL · Escambia
- 2024 margin
- R (+19.5) · D 39.7% · R 59.2% · Other 1.1%
- 2008→2024 swing
- -0.2pp no change · 2008: -19.3pp · 2024: -19.5pp
- All cycles
- 2024: R+19.5 2020: R+15.1 2016: R+20.6 2012: R+20.6 2008: R+19.3
Not yet ingested
- Civics
- —
Market trends
- HPI YoY
- ▼ -300.02%
- Current HPI
- 294.4873
- Rent YoY
- ▲ 3.39%
- Metro
- Pensacola-Ferry Pass-Brent, FL
- State GDP YoY
- ▲ 3.28%
- F500 in state
- 36
Industry mix (Fortune 500 HQ in FL)
| Industry | F500 HQs | Revenue |
|---|---|---|
| Industrial Technology | 2 | $29B |
|
||
| Insurance | 2 | $17B |
|
||
| Retail | 1 | $60B |
|
||
| Technology Distribution | 1 | $58B |
|
||
| Homebuilding | 1 | $35B |
|
||
| Technology Manufacturing | 1 | $35B |
|
||
Price history
+508.1% since first listed9 events — show timeline
- 2026-04-10 Listed $225,000 PARMLS
- 2025-12-30 Listing Removed — PARMLS
- 2025-06-29 Listed $276,000 PARMLS
- 2024-09-10 Sold (Public Records) $99,900 Public Records
- 2024-09-05 Pending — PARMLS
- 2024-09-04 Sold (MLS) $99,900 PARMLS
- 2024-07-25 Contingent — PARMLS
- 2024-07-22 Listed $99,900 PARMLS
- 2006-01-12 Sold (Public Records) $37,000 Public Records
Property tax history
+13.7%/yrLatest (2025): $2,629 · +99.5% YoY. Source: county tax records.
Cash-flow waterfall
monthlySold comps — $/sqft
last 12 mo · ≤1 miLoading sold comps…