10536 Blackjack Oaks Dr · Dallas, TX
Flood risk 1/10 · Minimal
- FEMA flood zone
- X (unshaded)
- Chance of flooding over 30 yrs
- 0.0%
- Est. flood insurance / yr
- $507 – $1,088
Fire risk 1/10 · Minimal
- Est. fire insurance / yr
- $1,222 – $2,270
Heat risk 7/10 · Major
- Hot days now (above 110°F)
- 7 days/yr
- Hot days in 30 yrs
- 24 days/yr
Wind risk 6/10 · Moderate
- Chance of severe wind over 30 yrs
- 27.0%
Air-quality risk 2/10 · Minimal
- Unhealthy air days now
- 1 days/yr
- Unhealthy air days in 30 yrs
- 2 days/yr
Risk factors via First Street. Map © Google.
Why this score? — see what drove the D+ grade
The composite is a weighted blend of 9 inputs, each scored 0–100. Each bar is that input's sub-score; the figure is the points it added to the 100-point composite (weight × sub-score).
- ARV discount +15.0/15.0
- Cash flow +11.4/30.0
- 1% rule +4.9/10.0
- Livability +4.0/5.0
- DSCR +3.3/10.0
- Schools +2.8/10.0
- Condition / age +2.5/5.0
- Rent growth +2.4/5.0
- Appreciation +0.0/10.0
$184,900
🖨 Deal sheet 📄 Offer letter ✓ Due diligence
Listing remarks
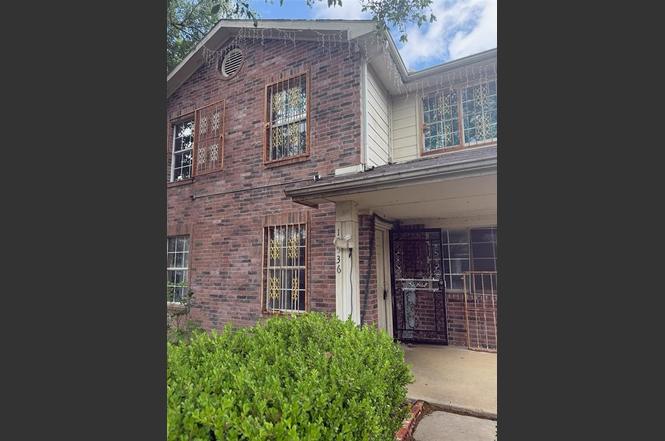
Investor Special with Incredible Potential! This 3-bedroom, 2-bath home offers a fantastic opportunity for investors, first-time buyers, or anyone looking to add their personal touch and build equity. Featuring a functional floor plan and generous living spaces, this property is ready for updates and customization to suit your vision. Conveniently located just minutes from Downtown Dallas, you'll enjoy quick access to major highways, employment centers, dining, shopping, and entertainment. Whether you're searching for your next investment property, a renovation project, or an affordable place to call home, this property presents endless possibilities in a prime location. Don't miss the chan
Key facts
- Prime location
- 4,182 sq ft lot
- 2 garage spots
Tags
Property features AI
Finance
- Other: Probate listing; Possession at closing/funding
- Financial info: Accepts Cash, Conventional and Other listing terms; No second mortgage information
- HOA & community: No homeowners association
Exterior
- Parking: Attached garage; 2 covered garage spaces
- Utilities: City water; City sewer; Not in a municipal utility district
- Home design: Single family residence; Residential property; Two-story; Built in 2000; Subdivision: Hillside Oaks Ph 05 01
- Construction: Brick construction; Composition roof; Slab foundation
- Exterior features: Wrought iron fencing; Lot dimensions approximately 42 x 100
Interior
- Kitchen: Electric range
- Bedrooms: 3 bedrooms (primary bedroom on level 1)
- Flooring: Simulated wood flooring
- Bathrooms: 2 full bathrooms; 1 half bathroom
- Heating & cooling: Central heating; Central electric air conditioning
- Interior features: Cable TV available; High-speed internet available; One living area; One dining area; Two levels
Neighborhood map
What this means for you Summary
Snapshot
- This is a 3-bed/2.5-bath single-family listed at $185k.
Deal economics
- At list price, monthly cash flow is $-65 ($-783/yr) — negative.
- To cash-flow at today's rent, offer at most $173k (6.2% below list).
- To meet the 1% rule (rent ≥ 1% of price), the offer needs to be $182k (1.5% below list).
- Recommended offer: $173k (6.2% below list) — sets the bar for cash-flow.
- Cap rate 5.9% vs local median 2.3% in Dallas — top-decile yield for the area; either an underpriced asset or a hidden risk that comps aren't pricing in. Stress-test before assuming the spread holds.
Location & tenants
- Location reads 81/100 on livability (#24 in TX, #1,380 nationally) — a professional / high-income tenant draw. Strengths: amenities A+, commute A+, housing A+; Watch: crime F.
- Dallas ISD (urban): math 31% / reading 36% proficiency, ranked #559 of 826 in TX (top 68%) — families likely to look elsewhere, expect single-tenant / working-renter base with shorter leases; 83% free/reduced lunch — lower-income household profile, screen leases tightly.
- Zoned schools: Edward Titche El (math 31% / reading 31%, grade F, #2,429 of 4,322 statewide, top 57%, 678 students, 99% FRL) — zoned schools average 99% FRL vs 83% district-wide (16 pts higher); higher-poverty schools than district average — tighter screening recommended.
- Market conditions: Rents soft (-0.4%/yr); 179 active listings in the ZIP; 40 comparable units currently listed for rent nearby; rentals at typical pace (median 24d on market — plan ~3-4 weeks tenant-placement turnaround); 48% of comp listings sitting > 30 days — soft ceiling on asking rent; 12,577 units permitted in Dallas County in 2024 (6,829 in 5+ unit buildings).
- This rent runs 34% of the median local income ($64k/yr) — at the standard rent-burdened threshold; future hikes will face affordability resistance.
Forward outlook
- Local home prices are declining (-3.0%/yr); year-one equity from $1k of loan paydown is wiped out by about $6k of value loss. Plan a longer hold.
- Dallas County population projected at +35% by 2050 — long-run rental-demand tailwind backs the buy-and-hold thesis.
Negotiation context
- Only 3 days on market — expect competitive offers; lowballing is unlikely to land.
Risks & watch-outs
- Watch-outs: property tax is 3.0% of price.
- Climate carrying-cost: major wind risk, 27% chance of damaging wind over 30y; extreme-heat days projected 7→24/yr by 2055 (HVAC capex compounding) — expect insurance premiums to compound above CPI over the hold.
Questions for the listing agent
- What do current leases actually rent for vs. the listed asking? Can we see a recent rent roll and the last 12 months of T-12 income?
- Property tax is high relative to price — has the assessment been appealed recently, and will the sale trigger a re-assessment?
- Is there a deadline driving the sale (1031 exchange, divorce, estate, relocation)? That informs how much negotiation room exists.
- Crime grade is F in this area — have there been break-ins, vandalism, or insurance claims at this property in the last 3 years? What carrier currently insures it and at what premium?
- The area grade is low — what's the realistic commute time and amenity access for the typical tenant pool here? Any planned neighborhood developments (good or bad) we should know about?
- What's the average days-on-market for RENTAL listings here right now (not sales)? A rising rental-DOM trend means longer vacancies and softer asking-rent achievability than the comps imply.
- What's the recent tenant-quality profile in this submarket — average credit score on applications, eviction rate, late-payment / NSF rate, and stable-employment percentage? A property-management company in the area should have these aggregated.
- How much new for-sale + rental construction is in the pipeline within 1–3 miles? Heavy new supply typically softens prices + rents 12–24 months out; constrained supply supports both.
Investment metrics
- 1% rule
- 0.99% ✗
- Cap rate
- 5.87%
- Cash-on-cash
- -1.51%
- DSCR
- 0.93
- GRM
- 8.5
CMA / ARV
- ARV (on-the-fly)
- $244,872
- Comps found
- 12
Show comp detail 12 sales within ~0.75 mi
| Address | Dist | Beds/Ba | Sqft | Sold | Price | $/sf | Match |
|---|---|---|---|---|---|---|---|
| 10419 Blackjack Oaks Dr | 0.09mi | 3/2.0 | 1,371 (+0%) | 2mo | $244,999 | $179 | 92 |
| 2716 Oak Bend Ln | 0.29mi | 3/2.0 | 1,440 (+5%) | 2mo | $259,000 | $180 | 74 |
| 9923 Hustead St | 0.59mi | 3/2.0 | 1,422 (+4%) | 1mo | $225,000 | $158 | 63 |
| 1026 S Sam Houston Rd | 0.41mi | 2/1.0 (-1) | 1,424 (+4%) | 0mo | $300,000 | $211 | 63 |
| 2718 Mossglen Dr | 0.74mi | 3/2.0 | 1,410 (+3%) | 0mo | $297,000 | $211 | 58 |
| 1314 Lorraine Ln | 0.35mi | 3/2.0 | 1,173 (-14%) | 1mo | $250,000 | $213 | 57 |
| 10922 Limestone Dr | 0.60mi | 3/2.0 | 1,268 (-7%) | 5mo | $270,000 | $213 | 54 |
| 9918 Cedar Mountain Cir | 0.66mi | 4/2.0 (+1) | 1,284 (-6%) | 3mo | $198,999 | $155 | 50 |
| 1258 Robinhood Blvd | 0.46mi | 4/2.0 (+1) | 1,548 (+13%) | 2mo | $259,999 | $168 | 48 |
| 9914 Cedar Mountain Cir | 0.67mi | 3/2.0 | 1,202 (-12%) | 2mo | $200,000 | $166 | 45 |
| 9957 Cedar Mountain Cir | 0.70mi | 3/2.0 | 1,196 (-13%) | 2mo | $188,000 | $157 | 43 |
| 2123 Nectar Dr | 0.74mi | 3/2.0 | 1,532 (+12%) | 2mo | $220,000 | $144 | 42 |
Match score weights: distance 35% · size 25% · config 20% · recency 20%. Top-matched comps best support the ARV.
Projected returns pro-forma
-3.0% appreciation · 0.0% rent growth · sell at horizon
- IRR
- -22.8%
- Equity multiple
- 0.24×
- Total profit
- $-39,293
- Equity at exit
- $27,569
- IRR
- -30.4%
- Equity multiple
- -0.15×
- Total profit
- $-59,529
- Equity at exit
- $15,987
Cash invested: $51,772 (down + closing). Projections, not guarantees.
Landlord ↔ Tenant lean methodology
- Overall (STATE)
- 87 Strongly Landlord-Friendly
- State Texas
- 87 Strongly Landlord-Friendly · R+5
- County
- — inherits STATE
- City
- — inherits STATE
ZIP-level market 75227
- Home prices YoY
- -30.9%
- Rents YoY
- -0.4%
- Active inventory
- 179
- Price-to-rent
- 8.5×
Monthly cashflow live
- Estimated rent
- $1,822 high interval (Pro) →
- Mortgage (P&I)
- −$970
- Tax from tax record
- −$458 /mo · $5,498/yr
- Insurance
- −$77
- HOA
- −$0
- Vacancy / Maint / Mgmt
- −$383
- Net cashflow
- $-65
Break-even live
UW: 25.0% down · 7.5% · 30yr · 1.5% tax · 5.0% vac · 8.0% maint · 8.0% mgmt
Financing live
Cash to close
- Down payment
- $46,225
- Closing costs
- $5,547
- Reserves months
- —
- Total cash needed
- —
Loan-product check · same deal, 3 products live
Conventional
25% down · 7.5% · 30yr
- Down + closing
- —
- Monthly P&I
- —
- Monthly cashflow
- —
- DSCR
- —
- Eligible?
- —
Personal DTI + credit; lowest rate.
DSCR
20% down · 8.5% · 30yr
- Down + closing
- —
- Monthly P&I
- —
- Monthly cashflow
- —
- DSCR
- —
- Eligible?
- —
No personal income docs; deal must DSCR.
Hard money
10% down · 12.0% · 12mo
- Down + closing
- —
- Monthly P&I
- —
- Monthly cashflow
- —
- DSCR
- —
- Eligible?
- —
Short-term bridge; refi at stabilization.
Rent comps 40 comps
| Address | Beds | Baths | Sqft | Rent | $/sqft | DOM | Units | Dist |
|---|---|---|---|---|---|---|---|---|
| 2315 Summit Ln Dallas, TX | 3.0 | 2.0 | 1200 | $1,800 | $1.50 | 7d | 1 | 0.13mi |
| 10611 Woodleaf Dr Dallas, TX | 2.0 | 2.0 | 959 | $1,650 | $1.72 | 7d | 1 | 0.15mi |
| 10611 Woodleaf Dr Dallas, TX | 2.0 | 2.0 | 959 | $1,695 | $1.77 | 16d | 1 | 0.15mi |
| 2540 Winter Oak St Dallas, TX | 3.0 | 2.0 | 994 | $1,750 | $1.76 | 20d | 1 | 0.17mi |
| 10320 Carolina Oaks Dr Dallas, TX | 4.0 | 2.0 | 1453 | $1,900 | $1.31 | 7d | 1 | 0.18mi |
| 2603 Winter Oak St Dallas, TX | 3.0 | 2.0 | 1004 | $1,921 | $1.91 | 43d | 1 | 0.22mi |
| 10216 Blackjack Oaks Dr Dallas, TX | 3.0 | 2.0 | 1453 | $1,865 | $1.28 | 24d | 1 | 0.29mi |
| 2255 Nantucket Village Dr Dallas, TX | 3.0 | 2.0 | 1037 | $1,625 | $1.57 | 43d | 1 | 0.29mi |
| 10236 Hillhouse Ln Dallas, TX | 3.0 | 2.0 | 1323 | $1,600 | $1.21 | 43d | 1 | 0.30mi |
| 10320 Nantucket Village Ct Dallas, TX | 3.0 | 2.0 | 1037 | $1,645 | $1.59 | 43d | 1 | 0.31mi |
| 2703 Oak Bend Ln Dallas, TX | 3.0 | 2.0 | 1611 | $2,035 | $1.26 | 43d | 1 | 0.31mi |
| 10212 Hillhouse Ln Dallas, TX | 2.0 | 1.0 | 1183 | $1,499 | $1.27 | 7d | 1 | 0.34mi |
| 2123 Chatham Square Ct Dallas, TX | 4.0 | 2.5 | 1464 | $2,500 | $1.71 | 3d | 1 | 0.39mi |
| 10368 Wood Heights Dr Dallas, TX | 4.0 | 2.5 | 1550 | $2,085 | $1.35 | 43d | 1 | 0.41mi |
| 10348 Wood Heights Dr Dallas, TX | 3.0 | 2.5 | 1358 | $2,000 | $1.47 | 43d | 1 | 0.44mi |
| 9920 Bluffcreek Dr Dallas, TX | 4.0 | 2.0 | 1377 | $2,191 | $1.59 | 24d | 1 | 0.46mi |
| 2041 New Haven Dr Dallas, TX | 3.0 | 1.5 | 1362 | $1,720 | $1.26 | 16d | 1 | 0.47mi |
| 2708 Briarbank Cir Dallas, TX | 3.0 | 2.0 | 1349 | $1,840 | $1.36 | 2d | 1 | 0.49mi |
| 10328 Chelmsford Dr Dallas, TX | 3.0 | 1.0 | 1061 | $1,300 | $1.23 | 43d | 1 | 0.55mi |
| 2255 W Bruton Rd Mesquite, TX | 1.0–3.0 | 1.0–2.0 | 957 | $1,819 | $1.90 | 43d | 12 | 0.57mi |
| 10503 Leroy Ct Dallas, TX | 3.0 | 2.0 | 1253 | $1,941 | $1.55 | 7d | 1 | 0.59mi |
| 10315 Limestone Dr Dallas, TX | 2.0 | 2.0 | 1068 | $1,450 | $1.36 | 43d | 1 | 0.63mi |
| 1939 Naira Dr Dallas, TX | 3.0 | 2.0 | 1415 | $1,850 | $1.31 | 43d | 1 | 0.66mi |
| 1222 S Peachtree Rd Mesquite, TX | 4.0 | 2.0 | 1750 | $2,595 | $1.48 | 2d | 1 | 0.66mi |
| 9921 Cedar Mountain Cir Dallas, TX | 3.0 | 2.0 | 1202 | $1,895 | $1.58 | 43d | 1 | 0.66mi |
| 10206 Shayna Dr Dallas, TX | 3.0 | 2.0 | 1253 | $1,850 | $1.48 | 13d | 1 | 0.74mi |
| 1937 Red Cloud Dr Dallas, TX | 3.0 | 2.0 | 1196 | $1,695 | $1.42 | 43d | 1 | 0.75mi |
| 2025 Norcross Dr Mesquite, TX | 3.0 | 2.0 | 1281 | $1,850 | $1.44 | 43d | 1 | 0.82mi |
| 1705 Allentown Dr Dallas, TX | 3.0 | 2.0 | 1195 | $1,725 | $1.44 | 24d | 1 | 0.83mi |
| 303 Ridgefield Cir Mesquite, TX | 3.0 | 1.0 | 1021 | $2,095 | $2.05 | 24d | 1 | 0.86mi |
| 303 Ridgefield Cir Mesquite, TX | 3.0 | 1.0 | 1021 | $2,095 | $2.05 | 12d | 1 | 0.86mi |
| 303 Ridgefield Cir Mesquite, TX | 3.0 | 1.0 | 1021 | $2,095 | $2.05 | 19d | 1 | 0.86mi |
| 2722 N Saint Augustine Dr Dallas, TX | 4.0 | 2.0 | 1310 | $1,900 | $1.45 | 24d | 1 | 0.92mi |
| 11405 S Blossom Cir Balch Springs, TX | 2.0 | 1.0 | 920 | $1,500 | $1.63 | 1d | 1 | 0.93mi |
| 926 Powell Rd Mesquite, TX | 2.0 | 1.0 | 1126 | $1,800 | $1.60 | 43d | 1 | 0.95mi |
| 9666 Scyene Rd Dallas, TX | 1.0–2.0 | 1.0–2.0 | 753 | $1,286 | $1.71 | 2d | 21 | 0.96mi |
| 9503 Olde Towne Row Dallas, TX | 2.0 | 2.5 | 1140 | $1,350 | $1.18 | 43d | 1 | 0.96mi |
| 9645 Limestone Dr Dallas, TX | 3.0 | 2.0 | 1178 | $2,000 | $1.70 | 43d | 1 | 0.97mi |
| 9467 Olde Towne Row Dallas, TX | 2.0 | 1.5 | 1110 | $975 | $0.88 | 43d | 1 | 1.00mi |
| 9415 Bruton Rd Dallas, TX | 1.0–3.0 | 1.0–2.0 | 885 | $999 | $1.13 | 43d | 1 | 1.00mi |
Listing history 4 events
-
2026-06-18days on market $184,900 Active 3 DOM
-
2026-06-17days on market $184,900 Active 2 DOM
-
2026-06-15remarks 699-char remark
-
2026-06-15$184,900 Active 1 DOM
ⓘ Source: listings_history table (triggers on properties + properties_extension) + one-shot
backfill from property_details.listing_events for pre-trigger history.
Tax reassessment forecast TX · Resets to sale price
- Current annual tax
- $5,498 · $458/mo
- Projected year-2 tax
- $5,498 · $458/mo
- Expected delta
- $0/yr ($0/mo · 0.0%)
ⓘ Screening estimate from a state-policy table — verify with the county assessor before closing.
Climate risk First Street
- Flood 1/10 Low FEMA zone X (unshaded) · 0% chance over 30 yrs
- Wildfire 1/10 Low
- Heat 7/10 Severe 7 d/yr ≥110°F today · 24 d/yr by 30 yrs out
- Wind 6/10 Major 27% chance of damaging wind over 30 yrs
- Air quality 2/10 Low 1 unhealthy d/yr today · 2 by 30 yrs out
Nearby sold comps map
Loading sold comps map…
Walkable amenities ~0.75 mi
Loading nearby amenities…
Taxation est. · year 1
- Rental income
- $21,866
- − Mortgage interest
- −$10,357
- − Property taxes
- −$5,498
- − Insurance
- −$924
- − Repairs & maintenance
- −$1,749
- − Management
- −$1,749
- − Depreciation
- −$5,379
- Taxable loss
- −$3,791
- Est. tax savings @ 24.0%
- +$910
- After-tax cash flow
- $126/yr
For passive investors: Depreciation is non-cash, so a rental often shows a tax loss while cash-flowing — sheltering income. Rental losses are passive: they offset passive income freely, and up to $25,000/yr can offset ordinary (W-2) income if you actively participate and your MAGI is under $100k (phasing out to $0 by $150k); unused losses carry forward. On sale, claimed depreciation is recaptured at up to 25%, and gains may owe capital-gains tax (a 1031 exchange can defer both). Figures are a year-1 estimate at your 24.0% rate — not tax advice; consult a CPA.
Schools (NCES district)
- District
- Dallas ISD
- NCES district ID
- 4816230
- Math proficiency
- 31% ▼ -16.00%
- Reading proficiency
- 36% ▼ -4.00%
- Median HH income
- $42,881
- Composite
- 28.41/100
- National rank
- #6763
- State rank
- #559 of 826 in TX
Livability — Dallas
- Score
- 81/100
- State rank
- #24
- US rank
- #1380
Category grades
Schools grade is shown separately in the Schools card above.
Census & demographics
- Census place
- Dallas, TX
- County
- Dallas County · 2,612,404 people
- City population
- 1,168,437
- Metro
- Dallas-Fort Worth-Arlington, TX
- Population (ZIP)
- 58,319
- Household income
- $64,008
- Rent vs Own
- Severe rent burden
- 1679.0
Population outlook (Dallas County) Hauer SSP2
- Today (2025)
- 2,979,839 people
- By 2030
- 3,191,823 · +7.1%
- By 2040
- 3,619,611 · +21.5%
- By 2050
- 4,026,915 · +35.1%
- By 2075
- 4,957,073 · +66.4%
- By 2100
- 5,508,725 · +84.9%
Race, ethnicity, and origin ACS 2023
- Neighborhood character
- Majority Hispanic (62%)
- Race & ethnicity
- Hispanic / Latino 62% Two or more races 35% Black 28% White 8%
- Hispanic origin (detail)
- Mexican 56%
- Foreign-born
- 27% · Canada, Vietnam
- Languages at home
- 44% English-only · Spanish 55%
Political lean MEDSL · Dallas
- 2024 margin
- Strong D (+22.2) · D 60.2% · R 38.0% · Other 1.8%
- 2008→2024 swing
- +6.9pp toward D · 2008: 15.3pp · 2024: 22.2pp
- All cycles
- 2024: D+22.2 2020: D+31.6 2016: D+26.2 2012: D+15.4 2008: D+15.3
Not yet ingested
- Civics
- —
Market trends
- HPI YoY
- ▼ -148.56%
- Current HPI
- 332.3303
- Rent YoY
- ▼ -0.36%
- Metro
- Dallas-Fort Worth-Arlington, TX
- State GDP YoY
- ▲ 3.95%
- F500 in state
- 110
Industry mix (Fortune 500 HQ in TX)
| Industry | F500 HQs | Revenue |
|---|---|---|
| Energy | 16 | $1,198B |
|
||
| Technology | 5 | $198B |
|
||
| Engineering / Construction | 4 | $72B |
|
||
| Energy Services | 3 | $60B |
|
||
| Utilities | 3 | $41B |
|
||
| Healthcare | 2 | $330B |
|
||
Price history
1 event — show timeline
- 2026-06-15 Listed $184,900 NTREIS
Property tax history
+7.2%/yrLatest (2025): $5,498 · -0.4% YoY. Source: county tax records.
Cash-flow waterfall
monthlySold comps — $/sqft
last 12 mo · ≤1 miLoading sold comps…