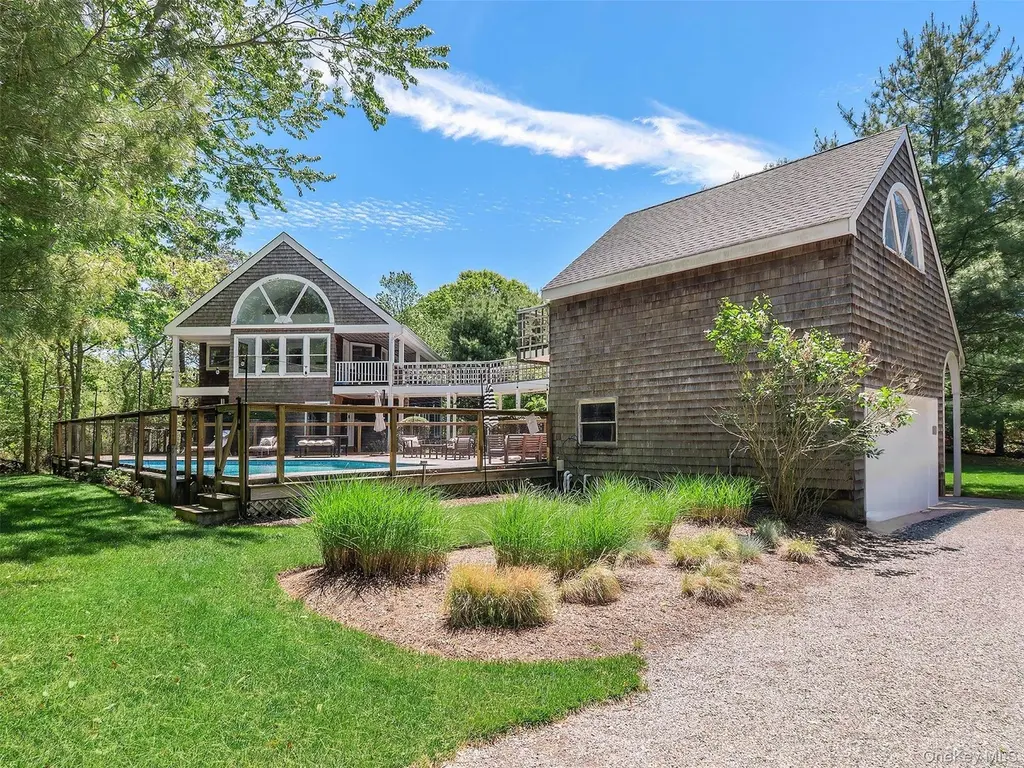
135 Old Meeting House Rd · Quiogue, NY
Flood risk 6/10 · Moderate
- FEMA flood zone
- AE
- Chance of flooding over 30 yrs
- 0.85%
- Est. flood insurance / yr
- $1,737 – $8,500
Fire risk 1/10 · Minimal
- Est. fire insurance / yr
- $691 – $1,283
Heat risk 4/10 · Minor
- Hot days now (above 90°F)
- 7 days/yr
- Hot days in 30 yrs
- 19 days/yr
Wind risk 8/10 · Major
- Chance of severe wind over 30 yrs
- 80.0%
Air-quality risk 2/10 · Minimal
- Unhealthy air days now
- 2 days/yr
- Unhealthy air days in 30 yrs
- 2 days/yr
Risk factors via First Street. Map © Google.
Why this score? — see what drove the A- grade
The composite is a weighted blend of 9 inputs, each scored 0–100. Each bar is that input's sub-score; the figure is the points it added to the 100-point composite (weight × sub-score).
- Cash flow +30.0/30.0
- DSCR +10.0/10.0
- Appreciation +10.0/10.0
- 1% rule +8.6/10.0
- ARV discount +7.5/15.0
- Schools +6.6/10.0
- Livability +3.0/5.0
- Rent growth +2.5/5.0
- Condition / age +2.5/5.0
$1,650,000
🖨 Deal sheet 📄 Offer letter ✓ Due diligence
Listing remarks
Welcome to your summer - memories made here! A fabulous opportunity to own a timeless cedar shingle retreat set on private acre in the heart of Westhampton beach. Designed for effortless Hamptons living, this chic and contemporary gem seamlessly blends classic coastal architecture with relaxed luxury. Sun filled interiors flow seamlessly to expansive outdoor spaces, where a gleaming resort style pool is surrounded by lush landscaping and mature privacy plantings, creating the perfect backdrop for endless summer days and evenings under the stars. The flat and fully useable acre offers exceptional privacy and space for entertaining, relaxation and gathering with family and friends with room f
Key facts
- Resort style pool
- Lush landscaping
- Exceptional privacy
Tags
Property features AI
Exterior
- Parking: Driveway; 2-car garage
- Utilities: Public sewer; Cable available
- Home design: Single family residence
- Construction: Cedar construction
- Exterior features: Landscaped lot; Private lot; Private pool; Not waterfront; Garage(s) on property
Interior
- Kitchen: Cooktop; Gas oven; Refrigerator
- Bedrooms: Rooms total: 8
- Bathrooms: Three full bathrooms; One half bathroom
- Heating & cooling: Baseboard heating; Central air conditioning
- Interior features: First-floor bedroom; First-floor full bath; Cathedral ceilings; High ceilings; Primary bathroom; Master bedroom on main level; Porch
- Laundry & utility: Dryer
Neighborhood map
What this means for you Summary
Snapshot
- This is a 4-bed/4.0-bath single-family listed at $1.65M.
Deal economics
- At list price, monthly cash flow is $7k ($90k/yr) — positive.
- The deal already cash-flows at list — no discount required.
- Meets the 1% rule at list price ($22k rent vs $1.65M).
- Recommended offer: $1.63M (1.5% below list) — sets the bar for market timing.
Location & tenants
- Location reads 59/100 on livability (#1,023 in NY) — a working-class tenant base; expect higher turnover. Strengths: crime A+, employment A+, housing B; Watch: amenities F, commute F, cost of living F.
- Westhampton Beach Union Free School District (suburban): math 72% / reading 75% proficiency, ranked #81 of 590 in NY (top 14%) — strong family-tenant draw, lease renewals of 3-5y typical.
- Zoned schools: Westhampton Beach Elementary School (math 67% / reading 67%, grade B+, #525 of 2,108 statewide, top 27%, 356 students, 43% FRL); Westhampton Middle School (math 61% / reading 63%, grade B+, #136 of 729 statewide, top 20%, 434 students, 26% FRL); Westhampton Beach Senior High School (math 90% / reading 96%, grade A+, #147 of 1,100 statewide, top 14%, 964 students, 24% FRL).
- Market conditions: 112 active listings in the ZIP; 10 comparable units currently listed for rent nearby; rentals at typical pace (median 25d on market — plan ~3-4 weeks tenant-placement turnaround); 40% of comp listings sitting > 30 days — soft ceiling on asking rent; high-income renter base; 1,366 units permitted in Suffolk County in 2024 (216 in 5+ unit buildings).
Forward outlook
- In year one you build about $176k of equity ($11k loan paydown + $165k appreciation (10.0% local appreciation)).
- Suffolk County population projected to shrink 5% by 2050 — rents likely to lag national; underwrite the cash flow, not the appreciation.
- At projected returns (10.0% appreciation + 3.0% rent growth), your $462k cash investment doubles in ~2 years — after that, you're playing with house money.
- By year 2, paydown + projected appreciation supports a ~$284k cash-out refi (75% LTV) — recoverable capital for the next deal without selling this one.
Negotiation context
- It's been on market 21 days — a 2% lower offer ($1.63M) is reasonable based on typical stale-listing flexibility.
- 3 sale attempts since 7y ago with the ask held roughly flat each time — persistent listings suggest the price (not the market) is what's stuck; bring a comps-based counter.
- Current owner paid $475k; list at $1.65M implies a 247% gain — meaningful room to come down on a strong offer.
Risks & watch-outs
- Watch-outs: flood insurance adds $427/mo.
- Climate carrying-cost: in FEMA flood zone AE (mandatory federal flood insurance); severe wind risk, 80% chance of damaging wind over 30y — expect insurance premiums to compound above CPI over the hold.
Questions for the listing agent
- What's the actual annual flood-insurance premium (NFIP or private), and is the property in a SFHA with mandatory coverage?
- Is there a deadline driving the sale (1031 exchange, divorce, estate, relocation)? That informs how much negotiation room exists.
- Schools are D-rated, which usually means shorter tenancies and higher turnover. Who's the typical renter profile here, and what's been the actual vacancy rate?
- What's the average days-on-market for RENTAL listings here right now (not sales)? A rising rental-DOM trend means longer vacancies and softer asking-rent achievability than the comps imply.
- What's the recent tenant-quality profile in this submarket — average credit score on applications, eviction rate, late-payment / NSF rate, and stable-employment percentage? A property-management company in the area should have these aggregated.
- How much new for-sale + rental construction is in the pipeline within 1–3 miles? Heavy new supply typically softens prices + rents 12–24 months out; constrained supply supports both.
Investment metrics
- 1% rule
- 1.36% ✓
- Cap rate
- 12.04%
- Cash-on-cash
- 20.52%
- DSCR
- 1.91
- GRM
- 6.1
CMA / ARV
- ARV (on-the-fly)
- $1,095,996
- Comps found
- 5
Show comp detail 5 sales within ~0.75 mi
| Address | Dist | Beds/Ba | Sqft | Sold | Price | $/sf | Match |
|---|---|---|---|---|---|---|---|
| 7 Quantuck Bay Rd | 0.13mi | 3/2.0 (-1) | 1,770 (+1%) | 8mo | $1,500,000 | $847 | 72 |
| 5 Quantuck Bay Ln | 0.20mi | 3/2.0 (-1) | 1,746 (-0%) | 21mo | $845,000 | $484 | 60 |
| 33 Woodbridge Ln | 0.32mi | 3/2.0 (-1) | 1,926 (+10%) | 12mo | $850,000 | $441 | 46 |
| 20 Deborah Dr | 0.51mi | 3/2.0 (-1) | 1,554 (-11%) | 3mo | $975,000 | $627 | 42 |
| 4 Barker | 0.70mi | 3/2.5 (-1) | 2,000 (+14%) | 7mo | $2,750,000 | $1,375 | 26 |
Match score weights: distance 35% · size 25% · config 20% · recency 20%. Top-matched comps best support the ARV.
Projected returns pro-forma
10.0% appreciation · 3.0% rent growth · sell at horizon
- IRR
- 38.7%
- Equity multiple
- 3.97×
- Total profit
- $1,374,176
- Equity at exit
- $1,486,451
- IRR
- 33.4%
- Equity multiple
- 8.95×
- Total profit
- $3,671,741
- Equity at exit
- $3,205,587
Cash invested: $462,000 (down + closing). Projections, not guarantees.
Landlord ↔ Tenant lean methodology
- Overall (STATE)
- 15 Strongly Tenant-Friendly
- State New York
- 15 Strongly Tenant-Friendly · D+10
- County
- — inherits STATE
- City
- — inherits STATE
ZIP-level market 11978
- Home prices YoY
- 2.9%
- Active inventory
- 112
- Price-to-rent
- 6.1×
Monthly cashflow live
- Estimated rent
- $22,440 medium interval (Pro) →
- Mortgage (P&I)
- −$8,653
- Tax from tax record
- −$489 /mo · $5,865/yr
- Insurance
- −$688
- Flood insurance flood zone
- −$427 /mo · $5,118/yr
- HOA
- −$0
- Vacancy / Maint / Mgmt
- −$4,712
- Net cashflow
- $7,472
Break-even live
UW: 25.0% down · 7.5% · 30yr · 1.5% tax · 5.0% vac · 8.0% maint · 8.0% mgmt
Financing live
Cash to close
- Down payment
- $412,500
- Closing costs
- $49,500
- Reserves months
- —
- Total cash needed
- —
Loan-product check · same deal, 3 products live
Conventional
25% down · 7.5% · 30yr
- Down + closing
- —
- Monthly P&I
- —
- Monthly cashflow
- —
- DSCR
- —
- Eligible?
- —
Personal DTI + credit; lowest rate.
DSCR
20% down · 8.5% · 30yr
- Down + closing
- —
- Monthly P&I
- —
- Monthly cashflow
- —
- DSCR
- —
- Eligible?
- —
No personal income docs; deal must DSCR.
Hard money
10% down · 12.0% · 12mo
- Down + closing
- —
- Monthly P&I
- —
- Monthly cashflow
- —
- DSCR
- —
- Eligible?
- —
Short-term bridge; refi at stabilization.
Rent comps 10 comps
| Address | Beds | Baths | Sqft | Rent | $/sqft | DOM | Units | Dist |
|---|---|---|---|---|---|---|---|---|
| 9 Ocame Ave Westhampton Beach, NY | 4.0 | 3.0 | 1823 | $20,000 | $10.97 | 43d | 1 | 0.49mi |
| 14 Park Cir Quogue, NY | 3.0 | 2.0 | 1300 | $20,000 | $15.38 | 24d | 1 | 0.81mi |
| 44 Griffing Ave Westhampton Beach, NY | 4.0 | 4.5 | 1825 | $12,000 | $6.58 | 19d | 1 | 0.91mi |
| 64 Aspatuck Rd Westhampton Beach, NY | 4.0 | 3.0 | 2157 | $10,000 | $4.64 | 43d | 1 | 0.99mi |
| 60 Aspatuck Rd Westhampton Beach, NY | 4.0 | 3.0 | 2150 | $10,000 | $4.65 | 43d | 1 | 1.03mi |
| 4 Morris Ct Westhampton Beach, NY | 4.0 | 3.5 | 1504 | $30,000 | $19.95 | 24d | 1 | 1.06mi |
| 50 Hazelwood Ave Westhampton Beach, NY | 3.0 | 2.0 | 1112 | $20,000 | $17.99 | 24d | 1 | 1.10mi |
| 243 Sunset Ave Westhampton Beach, NY | 4.0 | 2.0 | 1566 | $28,000 | $17.88 | 3d | 1 | 1.15mi |
| 35 Maple St Westhampton Beach, NY | 3.0 | 2.5 | 1696 | $28,000 | $16.51 | 43d | 1 | 1.30mi |
| 24 Quogue Riverhead Rd Quogue, NY | 3.0 | 3.0 | 2054 | $15,000 | $7.30 | 24d | 1 | 1.49mi |
Listing history 13 events
-
2026-06-18days on market $1,650,000 Active 21 DOM
-
2026-06-17days on market $1,650,000 Active 20 DOM
-
2026-06-16days on market $1,650,000 Active 19 DOM
-
2026-06-15days on market $1,650,000 Active 18 DOM
-
2026-06-13days on market $1,650,000 Active 16 DOM
-
2026-06-09days on market $1,650,000 Active 12 DOM
-
2026-06-08days on market $1,650,000 Active 11 DOM
-
2026-06-07days on market $1,650,000 Active 10 DOM
-
2026-06-04days on market $1,650,000 Active 7 DOM
-
2026-06-03days on market $1,650,000 Active 6 DOM
-
2026-06-02days on market $1,650,000 Active 5 DOM
-
2026-06-01days on market $1,650,000 Active 4 DOM
-
2026-05-31days on market $1,650,000 Active 3 DOM
ⓘ Source: listings_history table (triggers on properties + properties_extension) + one-shot
backfill from property_details.listing_events for pre-trigger history.
Tax reassessment forecast NY · Partial reset (capped growth)
- Current annual tax
- $5,865 · $489/mo
- Projected year-2 tax
- $16,875 · $1,406/mo
- Expected delta
- +$11,010/yr (+$918/mo · 187.7%)
ⓘ Screening estimate from a state-policy table — verify with the county assessor before closing.
Climate risk First Street
- Flood 6/10 Major FEMA zone AE · 85% chance over 30 yrs
- Wildfire 1/10 Low
- Heat 4/10 Moderate 7 d/yr ≥90°F today · 19 d/yr by 30 yrs out
- Wind 8/10 Severe 80% chance of damaging wind over 30 yrs
- Air quality 2/10 Low 2 unhealthy d/yr today · 2 by 30 yrs out
Nearby sold comps map
Loading sold comps map…
Walkable amenities ~0.75 mi
Loading nearby amenities…
Taxation est. · year 1
- Rental income
- $269,282
- − Mortgage interest
- −$92,426
- − Property taxes
- −$5,865
- − Insurance
- −$13,368
- − Repairs & maintenance
- −$21,543
- − Management
- −$21,543
- − Depreciation
- −$48,000
- Taxable income
- $66,538
- Est. tax owed @ 24.0%
- −$15,969
- After-tax cash flow
- $73,697/yr
For passive investors: Depreciation is non-cash, so a rental often shows a tax loss while cash-flowing — sheltering income. Rental losses are passive: they offset passive income freely, and up to $25,000/yr can offset ordinary (W-2) income if you actively participate and your MAGI is under $100k (phasing out to $0 by $150k); unused losses carry forward. On sale, claimed depreciation is recaptured at up to 25%, and gains may owe capital-gains tax (a 1031 exchange can defer both). Figures are a year-1 estimate at your 24.0% rate — not tax advice; consult a CPA.
Schools (NCES district)
- District
- Westhampton Beach Union Free School District
- NCES district ID
- 3631020
- Math proficiency
- 72% ▼ -5.00%
- Reading proficiency
- 75% ▲ 3.00%
- Median HH income
- $88,137
- Composite
- 65.91/100
- National rank
- #444
- State rank
- #81 of 590 in NY
Livability — Quiogue
- Score
- 59/100
- State rank
- #1023
- US rank
- #19962
Category grades
Schools grade is shown separately in the Schools card above.
Census & demographics
- Census place
- Quiogue, NY
- County
- Suffolk County · 679,920 people
- City population
- 4,376
- Metro
- New York-Newark-Jersey City, NY-NJ-PA
- Population (ZIP)
- 4,705
- Household income
- $125,179
- Rent vs Own
- Severe rent burden
- 43.0
Population outlook (Suffolk County) Hauer SSP2
- Today (2025)
- 1,505,262 people
- By 2030
- 1,498,318 · -0.5%
- By 2040
- 1,471,101 · -2.3%
- By 2050
- 1,424,848 · -5.3%
- By 2075
- 1,337,157 · -11.2%
- By 2100
- 1,217,720 · -19.1%
Race, ethnicity, and origin ACS 2023
- Neighborhood character
- Predominantly White (72%)
- Race & ethnicity
- White 72% Two or more races 14% Hispanic / Latino 11% Black 6% Asian 2%
- Hispanic origin (detail)
- Puerto Rican 1%
- Common ancestry
- Romanian 7% Scotch-Irish 2% Italian 2%
- Foreign-born
- 14% · Canada, Jamaica, China
- Languages at home
- 84% English-only · Spanish 10% Other Indo-European 2% Russian/Polish/Slavic 1%
Political lean MEDSL · Suffolk
- 2024 margin
- Lean R (+10.0) · D 45.0% · R 55.0%
- 2008→2024 swing
- -16.0pp toward R · 2008: 6.0pp · 2024: -10.0pp
- All cycles
- 2024: R+10.0 2020: R+0.0 2016: R+8.2 2012: D+2.9 2008: D+6.0
Not yet ingested
- Civics
- —
Market trends
- HPI YoY
- ▲ 13.02%
- Current HPI
- 460.3964
- Rent YoY
- —
- Metro
- New York-Newark-Jersey City, NY-NJ-PA
- State GDP YoY
- ▲ 2.60%
- F500 in state
- 92
Industry mix (Fortune 500 HQ in NY)
| Industry | F500 HQs | Revenue |
|---|---|---|
| Financial Services | 10 | $950B |
|
||
| Consumer Goods | 9 | $162B |
|
||
| Insurance | 4 | $225B |
|
||
| Telecommunications | 2 | $144B |
|
||
| Pharmaceuticals | 2 | $112B |
|
||
| Media / Entertainment | 2 | $69B |
|
||
Price history
+247.4% since first listed7 events — show timeline
- 2026-05-28 Listed $1,650,000 OneKey® MLS as Distributed by MLS Grid
- 2020-05-01 Listing Removed — OneKey® MLS as Distributed by MLS Grid
- 2019-11-01 Price Changed $925,000 OneKey® MLS as Distributed by MLS Grid
- 2019-07-24 Listed $945,000 OneKey® MLS as Distributed by MLS Grid
- 2019-07-06 Listing Removed — OneKey® MLS as Distributed by MLS Grid
- 2019-04-05 Listed $975,000 OneKey® MLS as Distributed by MLS Grid
- 2014-02-05 Sold (Public Records) $475,000 Public Records
Property tax history
+1.7%/yrLatest (2022): $5,865 · +0.0% YoY. Source: county tax records.
Cash-flow waterfall
monthlySold comps — $/sqft
last 12 mo · ≤1 miLoading sold comps…