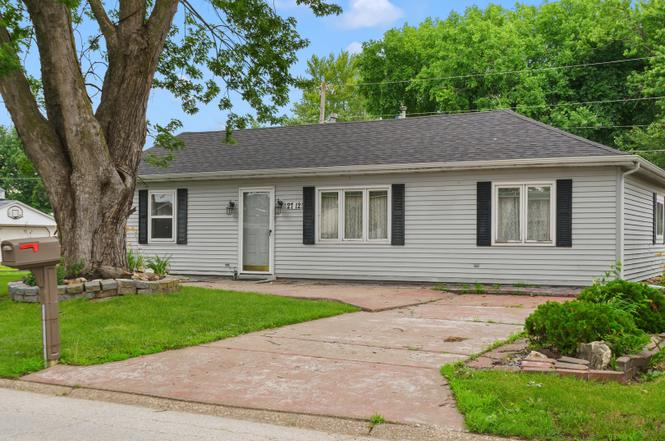
2712 W 67th St · Davenport, IA
Flood risk 1/10 · Minimal
- FEMA flood zone
- X (unshaded)
- Chance of flooding over 30 yrs
- 0.0%
- Est. flood insurance / yr
- $507 – $1,088
Fire risk 1/10 · Minimal
- Est. fire insurance / yr
- $902 – $1,676
Heat risk 3/10 · Minor
- Hot days now (above 103°F)
- 7 days/yr
- Hot days in 30 yrs
- 16 days/yr
Wind risk 2/10 · Minimal
- Chance of severe wind over 30 yrs
- —
Air-quality risk 3/10 · Minor
- Unhealthy air days now
- 2 days/yr
- Unhealthy air days in 30 yrs
- 3 days/yr
Risk factors via First Street. Map © Google.
Why this score? — see what drove the B grade
The composite is a weighted blend of 9 inputs, each scored 0–100. Each bar is that input's sub-score; the figure is the points it added to the 100-point composite (weight × sub-score).
- Cash flow +27.1/30.0
- ARV discount +15.0/15.0
- DSCR +9.4/10.0
- 1% rule +8.0/10.0
- Livability +4.0/5.0
- Schools +3.9/10.0
- Rent growth +3.0/5.0
- Condition / age +2.5/5.0
- Appreciation +0.0/10.0
$125,000
🖨 Deal sheet 📄 Offer letter ✓ Due diligence
Listing remarks
This property holds tremendous potential for those willing to invest a little TLC. Imagine the possibilities with your personal touch in this 3-bedroom, 1-bathroom home, all on one level! With an expansive layout and plenty of added space, this residence is ideal for families or anyone looking to create their dream home. The large living room, featuring an electric fireplace, provides a warm and inviting space for gatherings and relaxation. Enjoy cooking and entertaining in the open kitchen, which offers ample room for creativity and customization. Step outside to a lovely patio-perfect for summer barbecues and outdoor gatherings. The property also includes a shed for extra storage. A spaci
Key facts
- Extra storage
- Newer roof
- Electric fireplace
Tags
Property features AI
Finance
- HOA & community: No master association fee required; Community features include curbs and paved streets
Exterior
- Parking: Attached garage with 2 spaces, concrete driveway, garage door opener
- Utilities: Public water; Public sewer; 100 amp electric service
- Home design: Detached single-family home; One-story; Fee simple ownership; Built approximately 71–80 years ago; Asphalt roof; Vinyl siding
- Construction: Vinyl siding construction; Asphalt roof; Built before 1978
- Exterior features: Patio; Corner, level lot (approximately 61.2 x 100)
Interior
- Kitchen: Range; Range hood; Dishwasher; Refrigerator
- Bedrooms: Three bedrooms on the main level (Master: 14 x 9; Bedroom 2: 11 x 10; Bedroom 3: 11 x 12)
- Bathrooms: One full bathroom
- Heating & cooling: Natural gas heating; Central air conditioning
- Interior features: Seven total rooms; Electric fireplace in the living room
- Laundry & utility: Main-level laundry (7 x 11); Washer and dryer included
Neighborhood map
What this means for you Summary
Snapshot
- This is a 4-bed/2.0-bath single-family listed at $125k.
Deal economics
- At list price, monthly cash flow is $356 ($4k/yr) — positive.
- The deal already cash-flows at list — no discount required.
- Meets the 1% rule at list price ($2k rent vs $125k).
- Cap rate 9.7% vs local median 4.4% in Davenport — top-decile yield for the area; either an underpriced asset or a hidden risk that comps aren't pricing in. Stress-test before assuming the spread holds.
Location & tenants
- Location reads 79/100 on livability (#126 in IA, #2,312 nationally) — a middle-class / working-renter tenant base. Strengths: cost of living A+, housing A+, health & safety A+; Watch: employment C-, crime F.
- Davenport Community School District (urban): math 43% / reading 50% proficiency, ranked #288 of 289 in IA (top 100%) — families likely to look elsewhere, expect single-tenant / working-renter base with shorter leases.
- Market conditions: Rents rising (+1.8%/yr); 162 active listings in the ZIP; 5 comparable units currently listed for rent nearby; rentals leasing fast (median 14d on market — plan ~1-2 weeks tenant-placement turnaround); 40% of comp listings sitting > 30 days — soft ceiling on asking rent; 805 units permitted in Scott County in 2024 (479 in 5+ unit buildings).
Forward outlook
- Local home prices are declining (-3.0%/yr); year-one equity from $864 of loan paydown is wiped out by about $4k of value loss. Plan a longer hold.
- Scott County population projected at +19% by 2050 — long-run rental-demand tailwind backs the buy-and-hold thesis.
Negotiation context
- Only 3 days on market — expect competitive offers; lowballing is unlikely to land.
Risks & watch-outs
- Watch-outs: built in 1954 — expect roof / HVAC / electrical / plumbing capex.
Questions for the listing agent
- Built in 1954 — when were the roof, HVAC, electrical panel, plumbing, and water heater last replaced?
- Is there a deadline driving the sale (1031 exchange, divorce, estate, relocation)? That informs how much negotiation room exists.
- Crime grade is F in this area — have there been break-ins, vandalism, or insurance claims at this property in the last 3 years? What carrier currently insures it and at what premium?
- What's the average days-on-market for RENTAL listings here right now (not sales)? A rising rental-DOM trend means longer vacancies and softer asking-rent achievability than the comps imply.
- What's the recent tenant-quality profile in this submarket — average credit score on applications, eviction rate, late-payment / NSF rate, and stable-employment percentage? A property-management company in the area should have these aggregated.
- How much new for-sale + rental construction is in the pipeline within 1–3 miles? Heavy new supply typically softens prices + rents 12–24 months out; constrained supply supports both.
Investment metrics
- 1% rule
- 1.30% ✓
- Cap rate
- 9.71%
- Cash-on-cash
- 12.20%
- DSCR
- 1.54
- GRM
- 6.4
CMA / ARV
- ARV (on-the-fly)
- $229,680
- Comps found
- 12
Show comp detail 12 sales within ~0.75 mi
| Address | Dist | Beds/Ba | Sqft | Sold | Price | $/sf | Match |
|---|---|---|---|---|---|---|---|
| 6504 Cedar St | 0.38mi | 4/2.0 | 1,602 (+1%) | 4mo | $205,000 | $128 | 77 |
| 2714 W 66th St | 0.08mi | 4/3.0 | 1,462 (-8%) | 4mo | $349,000 | $239 | 76 |
| 6248 Hillandale Rd | 0.38mi | 3/1.5 (-1) | 1,632 (+3%) | 0mo | $225,000 | $138 | 70 |
| 3208 W 64th St | 0.30mi | 4/2.0 | 1,749 (+10%) | 4mo | $225,000 | $129 | 65 |
| 2508 W 60th Pl | 0.46mi | 3/2.0 (-1) | 1,520 (-4%) | 6mo | $230,500 | $152 | 61 |
| 2010 W 63rd St | 0.49mi | 3/2.0 (-1) | 1,686 (+6%) | 0mo | $168,000 | $100 | 61 |
| 6733 Brookview Ln | 0.40mi | 3/3.0 (-1) | 1,489 (-6%) | 5mo | $325,000 | $218 | 58 |
| 2822 High Point Dr | 0.19mi | 3/3.0 (-1) | 1,820 (+15%) | 6mo | $264,000 | $145 | 52 |
| 1724 W 69th St | 0.70mi | 3/2.0 (-1) | 1,686 (+6%) | 4mo | $178,000 | $106 | 49 |
| 2321 W 57th St | 0.70mi | 3/1.5 (-1) | 1,474 (-7%) | 1mo | $246,000 | $167 | 48 |
| 5556 N Thornwood Ave | 0.74mi | 3/2.0 (-1) | 1,715 (+8%) | 2mo | $175,000 | $102 | 45 |
| 1951 W 59 St | 0.75mi | 4/3.0 | 1,428 (-10%) | 0mo | $310,000 | $217 | 44 |
Match score weights: distance 35% · size 25% · config 20% · recency 20%. Top-matched comps best support the ARV.
Projected returns pro-forma
-3.0% appreciation · 1.8% rent growth · sell at horizon
- IRR
- 0.4%
- Equity multiple
- 1.02×
- Total profit
- $528
- Equity at exit
- $18,638
- IRR
- 8.8%
- Equity multiple
- 1.63×
- Total profit
- $22,126
- Equity at exit
- $10,808
Cash invested: $35,000 (down + closing). Projections, not guarantees.
Landlord ↔ Tenant lean methodology
- Overall (STATE)
- 83 Strongly Landlord-Friendly
- State Iowa
- 83 Strongly Landlord-Friendly · R+6
- County
- — inherits STATE
- City
- — inherits STATE
ZIP-level market 52806
- Rents YoY
- 1.8%
- Active inventory
- 162
- Price-to-rent
- 6.4×
Monthly cashflow live
- Estimated rent
- $1,627 high interval (Pro) →
- Mortgage (P&I)
- −$656
- Tax from tax record
- −$222 /mo · $2,664/yr
- Insurance
- −$52
- HOA
- −$0
- Vacancy / Maint / Mgmt
- −$342
- Net cashflow
- $356
Break-even live
UW: 25.0% down · 7.5% · 30yr · 1.5% tax · 5.0% vac · 8.0% maint · 8.0% mgmt
Financing live
Cash to close
- Down payment
- $31,250
- Closing costs
- $3,750
- Reserves months
- —
- Total cash needed
- —
Loan-product check · same deal, 3 products live
Conventional
25% down · 7.5% · 30yr
- Down + closing
- —
- Monthly P&I
- —
- Monthly cashflow
- —
- DSCR
- —
- Eligible?
- —
Personal DTI + credit; lowest rate.
DSCR
20% down · 8.5% · 30yr
- Down + closing
- —
- Monthly P&I
- —
- Monthly cashflow
- —
- DSCR
- —
- Eligible?
- —
No personal income docs; deal must DSCR.
Hard money
10% down · 12.0% · 12mo
- Down + closing
- —
- Monthly P&I
- —
- Monthly cashflow
- —
- DSCR
- —
- Eligible?
- —
Short-term bridge; refi at stabilization.
Rent comps 5 comps
| Address | Beds | Baths | Sqft | Rent | $/sqft | DOM | Units | Dist |
|---|---|---|---|---|---|---|---|---|
| 3021 W 72nd St Unit 4 Davenport, IA | 3.0 | 1.5 | 1079 | $1,375 | $1.27 | 13d | 1 | 0.35mi |
| 5556 N Thornwood Ave Davenport, IA | 3.0 | 2.0 | 1715 | $1,800 | $1.05 | 43d | 1 | 0.77mi |
| 4930 N Dittmer St Davenport, IA | 3.0 | 2.0 | 1104 | $1,184 | $1.07 | 13d | 1 | 1.32mi |
| 5337 Villa Dr Davenport, IA | 2.0–3.0 | 2.5 | 1650 | $2,045 | $1.24 | 13d | 1 | 1.33mi |
| 2806 W 47th St Davenport, IA | 3.0 | 2.0 | 1164 | $1,700 | $1.46 | 43d | 1 | 1.50mi |
Listing history 5 events
-
2026-06-19status $125,000 Pending 3 DOM
-
2026-06-18days on market $125,000 Active 3 DOM
-
2026-06-17days on market $125,000 Active 2 DOM
-
2026-06-15remarks 699-char remark
-
2026-06-15$125,000 Active 1 DOM
ⓘ Source: listings_history table (triggers on properties + properties_extension) + one-shot
backfill from property_details.listing_events for pre-trigger history.
Tax reassessment forecast IA · Partial reset (capped growth)
- Current annual tax
- $2,664 · $222/mo
- Projected year-2 tax
- $2,664 · $222/mo
- Expected delta
- $0/yr ($0/mo · 0.0%)
ⓘ Screening estimate from a state-policy table — verify with the county assessor before closing.
Climate risk First Street
- Flood 1/10 Low FEMA zone X (unshaded) · 0% chance over 30 yrs
- Wildfire 1/10 Low
- Heat 3/10 Moderate 7 d/yr ≥103°F today · 16 d/yr by 30 yrs out
- Wind 2/10 Low
- Air quality 3/10 Moderate 2 unhealthy d/yr today · 3 by 30 yrs out
Nearby sold comps map
Loading sold comps map…
Walkable amenities ~0.75 mi
Loading nearby amenities…
Taxation est. · year 1
- Rental income
- $19,525
- − Mortgage interest
- −$7,002
- − Property taxes
- −$2,664
- − Insurance
- −$625
- − Repairs & maintenance
- −$1,562
- − Management
- −$1,562
- − Depreciation
- −$3,636
- Taxable income
- $2,473
- Est. tax owed @ 24.0%
- −$594
- After-tax cash flow
- $3,676/yr
For passive investors: Depreciation is non-cash, so a rental often shows a tax loss while cash-flowing — sheltering income. Rental losses are passive: they offset passive income freely, and up to $25,000/yr can offset ordinary (W-2) income if you actively participate and your MAGI is under $100k (phasing out to $0 by $150k); unused losses carry forward. On sale, claimed depreciation is recaptured at up to 25%, and gains may owe capital-gains tax (a 1031 exchange can defer both). Figures are a year-1 estimate at your 24.0% rate — not tax advice; consult a CPA.
Schools (NCES district)
- District
- Davenport Community School District
- NCES district ID
- 1908580
- Math proficiency
- 43% ▼ -11.00%
- Reading proficiency
- 50% ▼ -3.00%
- Median HH income
- $46,157
- Composite
- 39.49/100
- National rank
- #3951
- State rank
- #288 of 289 in IA
Livability — Davenport
- Score
- 79/100
- State rank
- #126
- US rank
- #2312
Category grades
Schools grade is shown separately in the Schools card above.
Census & demographics
- Census place
- Davenport, IA
- County
- Scott County · 144,583 people
- City population
- 103,319
- Metro
- Davenport-Moline-Rock Island, IA-IL
- Population (ZIP)
- 26,871
- Household income
- $74,297
- Rent vs Own
- Severe rent burden
- 735.0
Population outlook (Scott County) Hauer SSP2
- Today (2025)
- 188,878 people
- By 2030
- 196,648 · +4.1%
- By 2040
- 210,860 · +11.6%
- By 2050
- 224,359 · +18.8%
- By 2075
- 258,884 · +37.1%
- By 2100
- 286,447 · +51.7%
Race, ethnicity, and origin ACS 2023
- Neighborhood character
- Predominantly White (74%)
- Race & ethnicity
- White 74% Black 12% Hispanic / Latino 7% Two or more races 7% Asian 2%
- Hispanic origin (detail)
- Mexican 6%
- Common ancestry
- Slovak 2% Lithuanian 2% Iranian 1%
- Foreign-born
- 4% · Canada, Vietnam, China
- Languages at home
- 93% English-only · Spanish 3% Vietnamese 1% Chinese 1%
Political lean MEDSL · Scott
- 2024 margin
- Toss-up / Even · D 47.3% · R 51.2% · Other 1.4%
- 2008→2024 swing
- -18.4pp toward R · 2008: 14.6pp · 2024: -3.9pp
- All cycles
- 2024: R+3.9 2020: D+3.5 2016: D+1.4 2012: D+13.8 2008: D+14.6
Not yet ingested
- Civics
- —
Market trends
- HPI YoY
- ▼ -127.41%
- Current HPI
- 185.0808
- Rent YoY
- ▲ 1.80%
- Metro
- Davenport-Moline-Rock Island, IA-IL
- State GDP YoY
- ▲ 2.48%
- F500 in state
- 4
Industry mix (Fortune 500 HQ in IA)
| Industry | F500 HQs | Revenue |
|---|---|---|
| Financial Services | 1 | $16B |
|
||
| Retail / Convenience | 1 | $15B |
|
||
Price history
1 event — show timeline
- 2026-06-15 Listed $125,000 MRED as Distributed by MLS Grid
Property tax history
+1.8%/yrLatest (2025): $2,664 · -4.5% YoY. Source: county tax records.
Cash-flow waterfall
monthlySold comps — $/sqft
last 12 mo · ≤1 miLoading sold comps…