303 E South Mountain Ave #49 · Phoenix, AZ
Flood risk 1/10 · Minimal
- FEMA flood zone
- X (shaded)
- Chance of flooding over 30 yrs
- 0.0%
- Est. flood insurance / yr
- $507 – $1,088
Fire risk 6/10 · Moderate
- Est. fire insurance / yr
- $610 – $1,132
Heat risk 9/10 · Severe
- Hot days now (above 111°F)
- 6 days/yr
- Hot days in 30 yrs
- 16 days/yr
Wind risk 1/10 · Minimal
- Chance of severe wind over 30 yrs
- —
Air-quality risk 2/10 · Minimal
- Unhealthy air days now
- 2 days/yr
- Unhealthy air days in 30 yrs
- 2 days/yr
Risk factors via First Street. Map © Google.
Why this score? — see what drove the B- grade
The composite is a weighted blend of 9 inputs, each scored 0–100. Each bar is that input's sub-score; the figure is the points it added to the 100-point composite (weight × sub-score).
- Cash flow +30.0/30.0
- 1% rule +10.0/10.0
- DSCR +10.0/10.0
- ARV discount +7.5/15.0
- Livability +3.8/5.0
- Condition / age +2.2/5.0
- Rent growth +1.5/5.0
- Schools +1.0/10.0
- Appreciation +0.0/10.0
$75,000
🖨 Deal sheet 📄 Offer letter ✓ Due diligence
Key facts
- 5 parking spots
- Community pool
- Built 1994
Property features AI
Finance
- HOA & community: Land lease of $840 monthly; No association fees listed; Community pool; Near bus stop
Exterior
- Parking: 2 covered parking spaces; 3 open parking spaces; 2 carport spaces
- Utilities: Public sewer; Private water company
- Home design: Manufactured/mobile home; Leasehold ownership
- Construction: Aluminum siding; Steel frame construction; Other roof
- Exterior features: Gravel/stone front and back yard; Private maintained road; Concrete road surface
Interior
- Kitchen: Refrigerator
- Bedrooms: Up to 3 possible bedrooms
- Bathrooms: 2 full bathrooms
- Heating & cooling: Heat pump heating; Central air conditioning; Ceiling fans
- Interior features: Eat-in kitchen; Full bathroom in primary bedroom
Neighborhood map
What this means for you Summary
Snapshot
- This is a 3-bed/2.0-bath manufactured listed at $75k. Condition is rated fair.
Deal economics
- At list price, monthly cash flow is $971 ($12k/yr) — positive.
- The deal already cash-flows at list — no discount required.
- Meets the 1% rule at list price ($2k rent vs $75k).
- Cap rate 21.8% vs local median 3.3% in Phoenix — top-decile yield for the area; either an underpriced asset or a hidden risk that comps aren't pricing in. Stress-test before assuming the spread holds.
Location & tenants
- Location reads 75/100 on livability (#16 in AZ, #3,924 nationally) — a middle-class / working-renter tenant base. Strengths: amenities A+, commute A+, housing A+; Watch: health & safety C-, crime F.
- Roosevelt Elementary District (4279) (urban): math 8% / reading 14% proficiency, ranked #234 of 249 in AZ (top 94%) — low school quality limits family demand, transient renter base, plan for 1-2y turnover.
- Zoned schools: Maxine O Bush Elementary School (math 2% / reading 12%, grade F, #1,076 of 1,109 statewide, top 97%, 262 students, 81% FRL) — zoned schools average 81% FRL vs 36% district-wide (45 pts higher); higher-poverty schools than district average — tighter screening recommended.
- Market conditions: Rents falling (-4.0%/yr); 227 active listings in the ZIP; 4 comparable units currently listed for rent nearby; rentals leasing fast (median 2d on market — plan ~1-2 weeks tenant-placement turnaround); solid renter incomes; 36,011 units permitted in Maricopa County in 2024 (12,801 in 5+ unit buildings).
Forward outlook
- Local home prices are declining (-3.0%/yr); year-one equity from $519 of loan paydown is wiped out by about $2k of value loss. Plan a longer hold.
- Maricopa County population projected at +38% by 2050 — long-run rental-demand tailwind backs the buy-and-hold thesis.
- At projected returns (-3.0% appreciation + 0.0% rent growth), your $21k cash investment doubles in ~3 years — after that, you're playing with house money.
Negotiation context
- Only 3 days on market — expect competitive offers; lowballing is unlikely to land.
Risks & watch-outs
- Climate carrying-cost: major wildfire risk; extreme-heat days projected 6→16/yr by 2055 (HVAC capex compounding) — expect insurance premiums to compound above CPI over the hold.
Questions for the listing agent
- Have any recent inspections been done? Can we get a copy of the seller's disclosures and any deferred-maintenance estimates?
- Is there a deadline driving the sale (1031 exchange, divorce, estate, relocation)? That informs how much negotiation room exists.
- Crime grade is F in this area — have there been break-ins, vandalism, or insurance claims at this property in the last 3 years? What carrier currently insures it and at what premium?
- What's the average days-on-market for RENTAL listings here right now (not sales)? A rising rental-DOM trend means longer vacancies and softer asking-rent achievability than the comps imply.
- What's the recent tenant-quality profile in this submarket — average credit score on applications, eviction rate, late-payment / NSF rate, and stable-employment percentage? A property-management company in the area should have these aggregated.
- How much new for-sale + rental construction is in the pipeline within 1–3 miles? Heavy new supply typically softens prices + rents 12–24 months out; constrained supply supports both.
Investment metrics
- 1% rule
- 2.51% ✓
- Cap rate
- 21.83%
- Cash-on-cash
- 55.50%
- DSCR
- 3.47
- GRM
- 3.3
CMA / ARV
No comps found within radius.
Projected returns pro-forma
-3.0% appreciation · 0.0% rent growth · sell at horizon
- IRR
- 50.4%
- Equity multiple
- 3.11×
- Total profit
- $44,211
- Equity at exit
- $11,183
- IRR
- 54.6%
- Equity multiple
- 5.62×
- Total profit
- $96,916
- Equity at exit
- $6,485
Cash invested: $21,000 (down + closing). Projections, not guarantees.
Landlord ↔ Tenant lean methodology
- Overall (STATE)
- 87 Strongly Landlord-Friendly
- State Arizona
- 87 Strongly Landlord-Friendly · R+3
- County
- — inherits STATE
- City
- — inherits STATE
ZIP-level market 85042
- Home prices YoY
- -27.7%
- Rents YoY
- -4.0%
- Active inventory
- 227
- Price-to-rent
- 3.3×
Monthly cashflow live
- Estimated rent
- $1,886 medium interval (Pro) →
- Mortgage (P&I)
- −$393
- Tax est. 1.5%
- −$94 /mo · $1,125/yr
- Insurance
- −$31
- HOA
- −$0
- Vacancy / Maint / Mgmt
- −$396
- Net cashflow
- $971
Break-even live
UW: 25.0% down · 7.5% · 30yr · 1.5% tax · 5.0% vac · 8.0% maint · 8.0% mgmt
Financing live
Cash to close
- Down payment
- $18,750
- Closing costs
- $2,250
- Reserves months
- —
- Total cash needed
- —
Loan-product check · same deal, 3 products live
Conventional
25% down · 7.5% · 30yr
- Down + closing
- —
- Monthly P&I
- —
- Monthly cashflow
- —
- DSCR
- —
- Eligible?
- —
Personal DTI + credit; lowest rate.
DSCR
20% down · 8.5% · 30yr
- Down + closing
- —
- Monthly P&I
- —
- Monthly cashflow
- —
- DSCR
- —
- Eligible?
- —
No personal income docs; deal must DSCR.
Hard money
10% down · 12.0% · 12mo
- Down + closing
- —
- Monthly P&I
- —
- Monthly cashflow
- —
- DSCR
- —
- Eligible?
- —
Short-term bridge; refi at stabilization.
Rent comps 4 comps
| Address | Beds | Baths | Sqft | Rent | $/sqft | DOM | Units | Dist |
|---|---|---|---|---|---|---|---|---|
| 8350 S Central Ave Phoenix, AZ | 2.0–4.0 | 1.5–2.5 | 1167 | $2,070 | $1.77 | 1d | 8 | 0.29mi |
| 11 E Dobbins Rd Phoenix, AZ | 2.0–4.0 | 1.5–2.5 | 1167 | $2,045 | $1.75 | 1d | 4 | 0.43mi |
| 120 W Dobbins Rd Phoenix, AZ | 1.0–2.0 | 1.0 | 938 | $1,345 | $1.43 | 1d | 3 | 0.51mi |
| 300 E Jessie Owens Pkwy Phoenix, AZ | 1.0–3.0 | 1.0–2.0 | 916 | $1,666 | $1.82 | 1d | 1 | 0.80mi |
Listing history 3 events
-
2026-06-18days on market $75,000 Active 3 DOM
-
2026-06-17days on market $75,000 Active 2 DOM
-
2026-06-16$75,000 Active 1 DOM
ⓘ Source: listings_history table (triggers on properties + properties_extension) + one-shot
backfill from property_details.listing_events for pre-trigger history.
Climate risk First Street
- Flood 1/10 Low FEMA zone X (shaded) · 0% chance over 30 yrs
- Wildfire 6/10 Major
- Heat 9/10 Extreme 6 d/yr ≥111°F today · 16 d/yr by 30 yrs out
- Wind 1/10 Low
- Air quality 2/10 Low 2 unhealthy d/yr today · 2 by 30 yrs out
Nearby sold comps map
Loading sold comps map…
Walkable amenities ~0.75 mi
Loading nearby amenities…
Taxation est. · year 1
- Rental income
- $22,627
- − Mortgage interest
- −$4,201
- − Property taxes
- −$1,125
- − Insurance
- −$375
- − Repairs & maintenance
- −$1,810
- − Management
- −$1,810
- − Depreciation
- −$2,182
- Taxable income
- $11,124
- Est. tax owed @ 24.0%
- −$2,670
- After-tax cash flow
- $8,986/yr
For passive investors: Depreciation is non-cash, so a rental often shows a tax loss while cash-flowing — sheltering income. Rental losses are passive: they offset passive income freely, and up to $25,000/yr can offset ordinary (W-2) income if you actively participate and your MAGI is under $100k (phasing out to $0 by $150k); unused losses carry forward. On sale, claimed depreciation is recaptured at up to 25%, and gains may owe capital-gains tax (a 1031 exchange can defer both). Figures are a year-1 estimate at your 24.0% rate — not tax advice; consult a CPA.
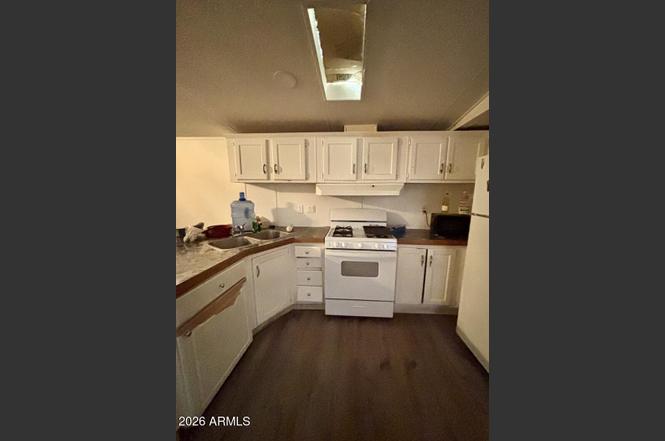
Condition & rehab AI · 4 photos
The home requires moderate repairs and maintenance, including painting and minor repairs, to improve its condition and value.
Repairs flagged
- Minor Painting — Interior walls and exterior siding need touch-up paint.
- Minor Roof inspection — Aging roof may need minor repairs or replacement.
- Minor Window cleaning — Windows appear dusty and could use cleaning.
- Minor HVAC maintenance — No visible issues, but may need cleaning or minor repairs.
- Minor Landscaping — Minimal landscaping could be improved with some updates.
Value-add opportunities
- Both Painting and minor repairs — Improves both resale and rental value by enhancing the home's appearance.
- Both Landscaping — Enhances curb appeal and can attract more potential buyers or renters.
- Both HVAC maintenance — Ensures the home is comfortable and energy-efficient, which is attractive to buyers and renters.
Renovation cost estimate screening
| Repair item | Severity | Est. cost |
|---|---|---|
| Painting · Interior walls and exterior siding need touch-up paint. | Minor | $500–3,000 |
| Roof inspection · Aging roof may need minor repairs or replacement. | Minor | $500–3,000 |
| Window cleaning · Windows appear dusty and could use cleaning. | Minor | $500–3,000 |
| HVAC maintenance · No visible issues, but may need cleaning or minor repairs. | Minor | $500–3,000 |
| Landscaping · Minimal landscaping could be improved with some updates. | Minor | $500–3,000 |
| Total estimated repair cost · 5 items | $2,500–15,000 |
Value-add ROI direction
- Both Painting and minor repairs — Improves both resale and rental value by enhancing the home's appearance. ↑
- Both Landscaping — Enhances curb appeal and can attract more potential buyers or renters. ↑
- Both HVAC maintenance — Ensures the home is comfortable and energy-efficient, which is attractive to buyers and renters. ↑
ⓘ Cost ranges are severity-bucket heuristics (US national rule-of-thumb). Get contractor quotes + a written scope before underwriting a rehab budget.
Schools (NCES district)
- District
- Roosevelt Elementary District (4279)
- NCES district ID
- 0407080
- Math proficiency
- 8% ▼ -13.00%
- Reading proficiency
- 14% ▼ -8.00%
- Median HH income
- $42,813
- Composite
- 9.74/100
- National rank
- #9829
- State rank
- #234 of 249 in AZ
Livability — Phoenix
- Score
- 75/100
- State rank
- #16
- US rank
- #3924
Category grades
Schools grade is shown separately in the Schools card above.
Census & demographics
- Census place
- Phoenix, AZ
- County
- Maricopa County · 4,537,380 people
- City population
- 1,500,198
- Metro
- Phoenix-Mesa-Chandler, AZ
- Population (ZIP)
- 45,903
- Household income
- $88,717
- Rent vs Own
- Severe rent burden
- 1624.0
Population outlook (Maricopa County) Hauer SSP2
- Today (2025)
- 4,979,203 people
- By 2030
- 5,378,229 · +8.0%
- By 2040
- 6,156,598 · +23.6%
- By 2050
- 6,872,376 · +38.0%
- By 2075
- 8,401,270 · +68.7%
- By 2100
- 9,247,439 · +85.7%
Race, ethnicity, and origin ACS 2023
- Neighborhood character
- Diverse neighborhood (Simpson 0.66)
- Race & ethnicity
- Hispanic / Latino 50% Two or more races 29% White 25% Black 14% Asian 4% Native American 2% Pacific Islander 1%
- Hispanic origin (detail)
- Mexican 45%
- Common ancestry
- Romanian 1% Lithuanian 1% Italian 1%
- Foreign-born
- 17% · Canada, China, Vietnam
- Languages at home
- 65% English-only · Spanish 29% Other Asian/Pacific 1% Other Indo-European 1%
Political lean MEDSL · Maricopa
- 2024 margin
- Toss-up / Even · D 47.7% · R 51.2% · Other 1.1%
- 2008→2024 swing
- +7.1pp toward D · 2008: -10.6pp · 2024: -3.5pp
- All cycles
- 2024: R+3.5 2020: D+2.2 2016: R+3.5 2012: R+12.0 2008: R+10.6
Not yet ingested
- Civics
- —
Market trends
- HPI YoY
- ▼ -122.03%
- Current HPI
- 318.0601
- Rent YoY
- ▼ -4.00%
- Metro
- Phoenix-Mesa-Chandler, AZ
- State GDP YoY
- ▲ 4.54%
- F500 in state
- 20
Industry mix (Fortune 500 HQ in AZ)
| Industry | F500 HQs | Revenue |
|---|---|---|
| Technology | 2 | $13B |
|
||
| Mining / Metals | 1 | $23B |
|
||
| Environmental Services | 1 | $16B |
|
||
| Metals / Steel | 1 | $14B |
|
||
| Technology Distribution | 1 | $9B |
|
||
| Homebuilding | 1 | $8B |
|
||
Price history
1 event — show timeline
- 2026-06-15 Listed $75,000 ARMLS
Cash-flow waterfall
monthlySold comps — $/sqft
last 12 mo · ≤1 miLoading sold comps…