210 Urban Rd · Fawn Lake Forest, PA
Flood risk 1/10 · Minimal
- FEMA flood zone
- X (unshaded)
- Chance of flooding over 30 yrs
- 0.0%
- Est. flood insurance / yr
- $473 – $860
Fire risk 5/10 · Moderate
- Est. fire insurance / yr
- $511 – $949
Heat risk 2/10 · Minimal
- Hot days now (above 93°F)
- 7 days/yr
- Hot days in 30 yrs
- 15 days/yr
Wind risk 2/10 · Minimal
- Chance of severe wind over 30 yrs
- 3.0%
Air-quality risk 2/10 · Minimal
- Unhealthy air days now
- 1 days/yr
- Unhealthy air days in 30 yrs
- 2 days/yr
Risk factors via First Street. Map © Google.
Why this score? — see what drove the B- grade
The composite is a weighted blend of 9 inputs, each scored 0–100. Each bar is that input's sub-score; the figure is the points it added to the 100-point composite (weight × sub-score).
- Cash flow +17.5/30.0
- ARV discount +15.0/15.0
- Appreciation +10.0/10.0
- DSCR +5.5/10.0
- 1% rule +5.1/10.0
- Schools +4.2/10.0
- Livability +3.1/5.0
- Rent growth +2.5/5.0
- Condition / age +2.5/5.0
$228,000
🖨 Deal sheet 📄 Offer letter ✓ Due diligence
Listing remarks
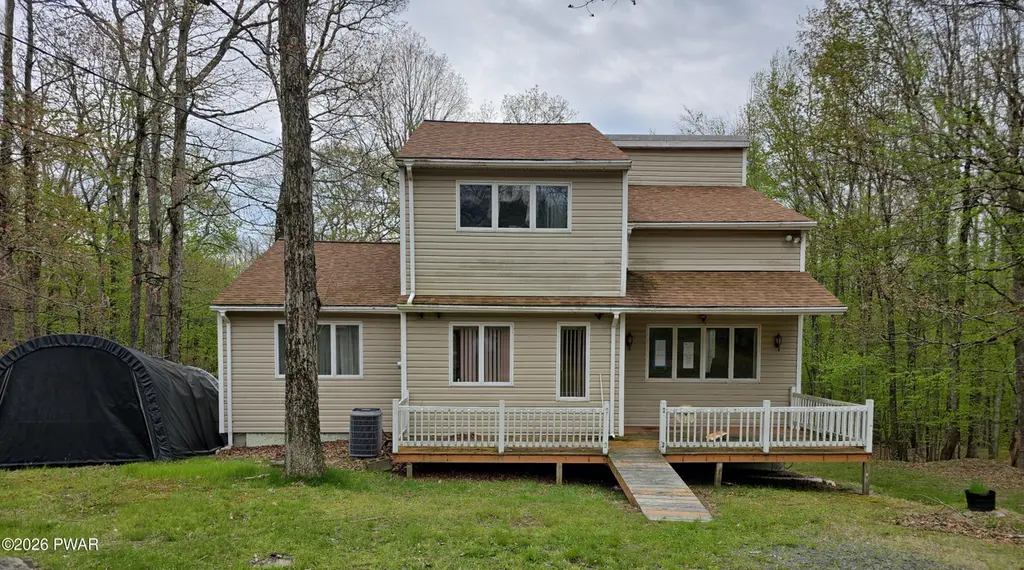
Tucked among the trees of Pike County, this two-story home on Urban Road offers privacy, space, and potential for transformation. The exterior features light siding, a front porch, and a ramp entry, set against a wooded backdrop that gives the property a peaceful, secluded feel. Inside, the layout includes multiple bedrooms and baths, two kitchens, providing flexibility for renovation or multi-use living. The structure itself holds promise with hardwood floors, large windows, and generous ceiling height throughout. The main kitchen opens to a bright living area with sliding doors to the deck, while the lower level includes a workshop and garage space ideal for tools, storage, or creative pr
Key facts
- Large windows
- Multiple kitchens
- Front porch
Tags
Property features AI
Exterior
- Parking: Attached garage (1 car)
- Utilities: Private well water; Septic tank; Electricity connected
- Home design: Single-family residence; Two levels
- Construction: Frame construction with vinyl siding; Asphalt shingle roof; Built as a house
- Exterior features: Deck; Porch; Wooded lot; Paved road access; Publicly maintained road; Has a view
Interior
- Kitchen: Refrigerator included
- Bedrooms: 6 total rooms (includes bedrooms and living spaces)
- Flooring: Hardwood; Tile; Vinyl; Laminate
- Bathrooms: 2 full bathrooms; 1 half bathroom
- Heating & cooling: Baseboard heating; Electric heating; No central air
- Interior features: In-law floorplan; Finished full basement
- Laundry & utility: Has heating (Baseboard, Electric)
Neighborhood map
What this means for you Summary
Snapshot
- This is a 3-bed/2.5-bath single-family listed at $228k.
Deal economics
- At list price, monthly cash flow is $175 ($2k/yr) — positive.
- The deal already cash-flows at list — no discount required.
- Meets the 1% rule at list price ($2k rent vs $228k).
- Recommended offer: $221k (3.0% below list) — sets the bar for market timing.
- Cap rate 7.2% vs local median 4.8% in Fawn Lake Forest — top-decile yield for the area; either an underpriced asset or a hidden risk that comps aren't pricing in. Stress-test before assuming the spread holds.
Location & tenants
- Location reads 61/100 on livability (#1,395 in PA) — a middle-class / working-renter tenant base. Strengths: cost of living A+, housing A+, crime A-; Watch: schools D, amenities F, commute F.
- Wallenpaupack Area SD (rural): math 39% / reading 59% proficiency, ranked #192 of 539 in PA (top 36%) — families likely to look elsewhere, expect single-tenant / working-renter base with shorter leases.
- Market conditions: 371 active listings in the ZIP; 213 units permitted in Pike County in 2024 (0 in 5+ unit buildings).
Forward outlook
- In year one you build about $24k of equity ($2k loan paydown + $23k appreciation (10.0% local appreciation)).
- Pike County population projected at -25% by 2050 — secular population decline; favor cash flow + early exit over multi-decade hold.
- At projected returns (10.0% appreciation + 3.0% rent growth), your $64k cash investment doubles in ~3 years — after that, you're playing with house money.
- By year 2, paydown + projected appreciation supports a ~$39k cash-out refi (75% LTV) — recoverable capital for the next deal without selling this one.
Negotiation context
- It's been on market 34 days — a 3% lower offer ($221k) is reasonable based on typical stale-listing flexibility.
- Current owner paid $18k; list at $228k implies a 1167% gain — meaningful room to come down on a strong offer.
Risks & watch-outs
- Climate carrying-cost: moderate wildfire risk — expect insurance premiums to compound above CPI over the hold.
Questions for the listing agent
- It's been on market 34 days. Have you received any prior offers? Is the seller open to a 3% concession, seller financing, or rate buy-down credit?
- Is there a deadline driving the sale (1031 exchange, divorce, estate, relocation)? That informs how much negotiation room exists.
- Schools are D-rated, which usually means shorter tenancies and higher turnover. Who's the typical renter profile here, and what's been the actual vacancy rate?
- What's the average days-on-market for RENTAL listings here right now (not sales)? A rising rental-DOM trend means longer vacancies and softer asking-rent achievability than the comps imply.
- What's the recent tenant-quality profile in this submarket — average credit score on applications, eviction rate, late-payment / NSF rate, and stable-employment percentage? A property-management company in the area should have these aggregated.
- How much new for-sale + rental construction is in the pipeline within 1–3 miles? Heavy new supply typically softens prices + rents 12–24 months out; constrained supply supports both.
Investment metrics
- 1% rule
- 1.01% ✓
- Cap rate
- 7.21%
- Cash-on-cash
- 3.29%
- DSCR
- 1.15
- GRM
- 8.2
CMA / ARV
- ARV (median comp)
- $432,563
- List price
- $228,000
- Delta
- -47.29%
- Verdict
- UNDERPRICED
- Comps
- 4 within 1.0 mi
Show comp detail 1 sale within ~0.75 mi
| Address | Dist | Beds/Ba | Sqft | Sold | Price | $/sf | Match |
|---|---|---|---|---|---|---|---|
| 180 Urban Rd | 0.31mi | 3/2.0 | 1,855 (-7%) | 9mo | $325,000 | $175 | 64 |
Match score weights: distance 35% · size 25% · config 20% · recency 20%. Top-matched comps best support the ARV.
Projected returns pro-forma
10.0% appreciation · 3.0% rent growth · sell at horizon
- IRR
- 26.7%
- Equity multiple
- 3.12×
- Total profit
- $135,405
- Equity at exit
- $205,400
- IRR
- 23.4%
- Equity multiple
- 7.11×
- Total profit
- $390,132
- Equity at exit
- $442,954
Cash invested: $63,840 (down + closing). Projections, not guarantees.
Landlord ↔ Tenant lean methodology
- Overall (STATE)
- 62 Landlord-Friendly
- State Pennsylvania
- 62 Landlord-Friendly · EVEN
- County
- — inherits STATE
- City
- — inherits STATE
ZIP-level market 18428
- Home prices YoY
- 9.2%
- Active inventory
- 371
- Price-to-rent
- 8.2×
Monthly cashflow live
- Estimated rent
- $2,306 medium interval (Pro) →
- Mortgage (P&I)
- −$1,196
- Tax from tax record
- −$356 /mo · $4,274/yr
- Insurance
- −$95
- HOA
- −$0
- Vacancy / Maint / Mgmt
- −$484
- Net cashflow
- $175
Break-even live
UW: 25.0% down · 7.5% · 30yr · 1.5% tax · 5.0% vac · 8.0% maint · 8.0% mgmt
Financing live
Cash to close
- Down payment
- $57,000
- Closing costs
- $6,840
- Reserves months
- —
- Total cash needed
- —
Loan-product check · same deal, 3 products live
Conventional
25% down · 7.5% · 30yr
- Down + closing
- —
- Monthly P&I
- —
- Monthly cashflow
- —
- DSCR
- —
- Eligible?
- —
Personal DTI + credit; lowest rate.
DSCR
20% down · 8.5% · 30yr
- Down + closing
- —
- Monthly P&I
- —
- Monthly cashflow
- —
- DSCR
- —
- Eligible?
- —
No personal income docs; deal must DSCR.
Hard money
10% down · 12.0% · 12mo
- Down + closing
- —
- Monthly P&I
- —
- Monthly cashflow
- —
- DSCR
- —
- Eligible?
- —
Short-term bridge; refi at stabilization.
Listing history 16 events
-
2026-06-18days on market $228,000 Active 34 DOM
-
2026-06-17days on market $228,000 Active 33 DOM
-
2026-06-16days on market $228,000 Active 32 DOM
-
2026-06-15days on market $228,000 Active 31 DOM
-
2026-06-13pricedays on market $228,000 Active 29 DOM
-
2026-06-13days on market $240,000 Active 28 DOM
-
2026-06-09days on market $240,000 Active 25 DOM
-
2026-06-08days on market $240,000 Active 24 DOM
-
2026-06-07days on market $240,000 Active 23 DOM
-
2026-06-04days on market $240,000 Active 20 DOM
-
2026-06-03days on market $240,000 Active 19 DOM
-
2026-06-02days on market $240,000 Active 18 DOM
-
2026-06-01days on market $240,000 Active 17 DOM
-
2026-05-31days on market $240,000 Active 16 DOM
-
2026-05-15$240,000 Active 954-char remark
-
1990-05-29soldstatus $18,000
ⓘ Source: listings_history table (triggers on properties + properties_extension) + one-shot
backfill from property_details.listing_events for pre-trigger history.
Tax reassessment forecast PA · Partial reset (capped growth)
- Current annual tax
- $4,274 · $356/mo
- Projected year-2 tax
- $4,274 · $356/mo
- Expected delta
- $0/yr ($0/mo · 0.0%)
ⓘ Screening estimate from a state-policy table — verify with the county assessor before closing.
Climate risk First Street
- Flood 1/10 Low FEMA zone X (unshaded) · 0% chance over 30 yrs
- Wildfire 5/10 Major
- Heat 2/10 Low 7 d/yr ≥93°F today · 15 d/yr by 30 yrs out
- Wind 2/10 Low 3% chance of damaging wind over 30 yrs
- Air quality 2/10 Low 1 unhealthy d/yr today · 2 by 30 yrs out
Nearby sold comps map
Loading sold comps map…
Walkable amenities ~0.75 mi
Loading nearby amenities…
Taxation est. · year 1
- Rental income
- $27,675
- − Mortgage interest
- −$12,772
- − Property taxes
- −$4,274
- − Insurance
- −$1,140
- − Repairs & maintenance
- −$2,214
- − Management
- −$2,214
- − Depreciation
- −$6,633
- Taxable loss
- −$1,572
- Est. tax savings @ 24.0%
- +$377
- After-tax cash flow
- $2,478/yr
For passive investors: Depreciation is non-cash, so a rental often shows a tax loss while cash-flowing — sheltering income. Rental losses are passive: they offset passive income freely, and up to $25,000/yr can offset ordinary (W-2) income if you actively participate and your MAGI is under $100k (phasing out to $0 by $150k); unused losses carry forward. On sale, claimed depreciation is recaptured at up to 25%, and gains may owe capital-gains tax (a 1031 exchange can defer both). Figures are a year-1 estimate at your 24.0% rate — not tax advice; consult a CPA.
Schools (NCES district)
- District
- Wallenpaupack Area SD
- NCES district ID
- 4224750
- Math proficiency
- 39% ▼ -10.00%
- Reading proficiency
- 59% ▼ -5.00%
- Median HH income
- $51,027
- Composite
- 41.97/100
- National rank
- #3345
- State rank
- #192 of 539 in PA
Livability — Fawn Lake Forest
- Score
- 61/100
- State rank
- #1395
- US rank
- #17626
Category grades
Schools grade is shown separately in the Schools card above.
Census & demographics
- Population (ZIP)
- 12,446
Population outlook (Pike County) Hauer SSP2
- Today (2025)
- 53,548 people
- By 2030
- 51,622 · -3.6%
- By 2040
- 46,490 · -13.2%
- By 2050
- 40,372 · -24.6%
- By 2075
- 31,951 · -40.3%
- By 2100
- 26,821 · -49.9%
Race, ethnicity, and origin ACS 2023
- Neighborhood character
- Predominantly White (85%)
- Race & ethnicity
- White 85% Hispanic / Latino 8% Two or more races 6% Black 1% Asian 1%
- Hispanic origin (detail)
- Puerto Rican 5%
- Common ancestry
- Romanian 5% Portuguese 3% Italian 2%
- Foreign-born
- 5% · Canada
- Languages at home
- 91% English-only · Spanish 5% Russian/Polish/Slavic 1% Other Asian/Pacific 1%
Political lean MEDSL · Pike
- 2024 margin
- Strong R (+24.1) · D 37.6% · R 61.6%
- 2008→2024 swing
- -19.8pp toward R · 2008: -4.2pp · 2024: -24.1pp
- All cycles
- 2024: R+24.1 2020: R+19.0 2016: R+26.0 2012: R+11.0 2008: R+4.2
Not yet ingested
- Civics
- —
Market trends
- HPI YoY
- ▲ 28.60%
- Current HPI
- 340.8254
- Rent YoY
- —
- Metro
- —
- State GDP YoY
- ▲ 1.68%
- F500 in state
- 34
Industry mix (Fortune 500 HQ in PA)
| Industry | F500 HQs | Revenue |
|---|---|---|
| Healthcare | 2 | $309B |
|
||
| Insurance | 2 | $27B |
|
||
| Telecommunications / Media | 1 | $124B |
|
||
| Industrial Distribution | 1 | $22B |
|
||
| Financial Services | 1 | $20B |
|
||
| Chemicals / Materials | 1 | $18B |
|
||
Price history
+1166.7% since first listed3 events — show timeline
- 2026-06-13 Price Changed $228,000 PWMLS
- 2026-05-15 Listed $240,000 PWMLS
- 1990-05-29 Sold (Public Records) $18,000 Public Records
Property tax history
+2.6%/yrLatest (2026): $4,274 · +2.8% YoY. Source: county tax records.
Cash-flow waterfall
monthlySold comps — $/sqft
last 12 mo · ≤1 miLoading sold comps…