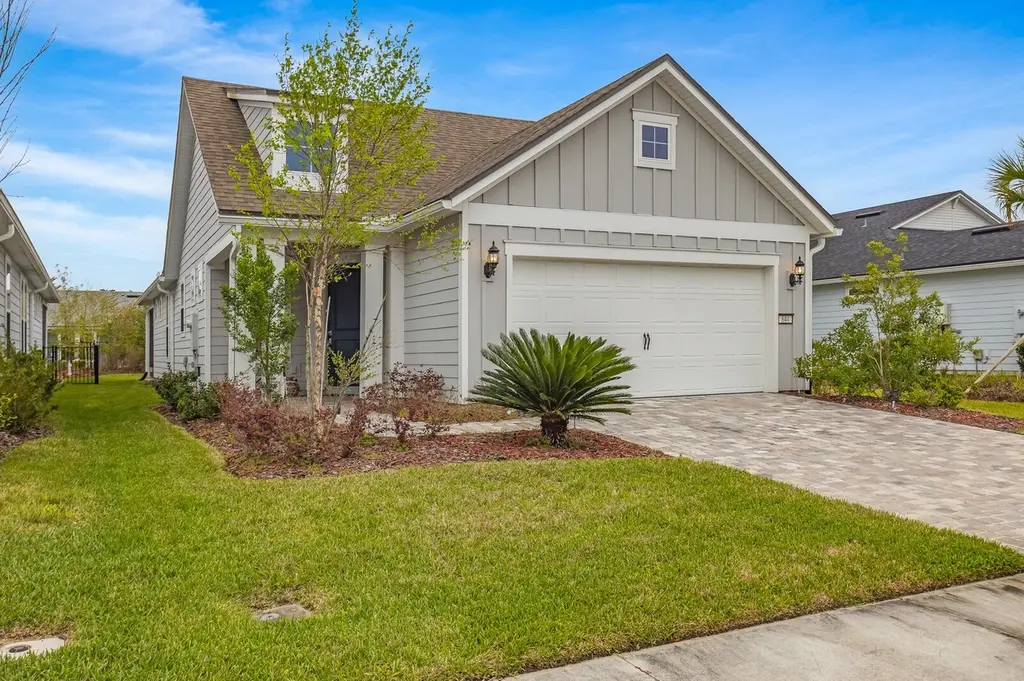
644 Jubilee Cir · Yulee, FL
Flood risk 1/10 · Minimal
- FEMA flood zone
- X (unshaded)
- Chance of flooding over 30 yrs
- 0.0%
- Est. flood insurance / yr
- $507 – $1,088
Fire risk 5/10 · Moderate
- Est. fire insurance / yr
- $947 – $1,759
Heat risk 9/10 · Severe
- Hot days now (above 106°F)
- 7 days/yr
- Hot days in 30 yrs
- 19 days/yr
Wind risk 9/10 · Severe
- Chance of severe wind over 30 yrs
- 99.0%
Air-quality risk 5/10 · Moderate
- Unhealthy air days now
- 6 days/yr
- Unhealthy air days in 30 yrs
- 7 days/yr
Risk factors via First Street. Map © Google.
Why this score? — see what drove the D- grade
The composite is a weighted blend of 9 inputs, each scored 0–100. Each bar is that input's sub-score; the figure is the points it added to the 100-point composite (weight × sub-score).
- Appreciation +10.0/10.0
- Schools +6.0/10.0
- Cash flow +4.4/30.0
- ARV discount +4.1/15.0
- Livability +3.3/5.0
- Rent growth +3.2/5.0
- Condition / age +2.5/5.0
- 1% rule +1.7/10.0
- DSCR +0.0/10.0
$370,000
🖨 Deal sheet 📄 Offer letter ✓ Due diligence
Listing remarks
MOVIVATED SELLER!! Welcome to Del Webb Wildlight and this beautifully upgraded Contour model, offering a compelling opportunity to own a move-in ready home that goes beyond what typical builder inventory provides. This home already includes valuable upgrades and enhancements that add both comfort and long term value without the additional out of pocket expense or post closing projects. Inside, the gourmet kitchen serves as the heart of the home, complete with a Whirlpool 4-door refrigerator and upgraded finishes designed for both everyday living and entertaining. Ceiling fans throughout enhance comfort, while the garage features a professionally coated floor for a clean, finished look. Step
Key facts
- Gourmet kitchen
- French drain
- Screened porch
Tags
Property features AI
Finance
- HOA & community: Homeowners association with monthly fee of $365; Additional annual association fee of $337; Community amenities include gated access and a pool
Exterior
- Parking: Two-car garage with garage door opener
- Security: Gated community
- Utilities: Public water; Public sewer
- Home design: Single-story home; Shingle roof; Fiber cement exterior; Built by Pulte
- Construction: Fiber cement construction; Shingle roof
- Exterior features: Sprinkler / irrigation; Screened patio/porch; Community pool; Gated community; Paved road access; PUD zoning; Resale property
Interior
- Kitchen: Dishwasher; Microwave; Refrigerator; Stove; Icemaker; Some gas appliances
- Bathrooms: 2 full bathrooms
- Heating & cooling: Central heating (electric); Central air conditioning (electric)
- Interior features: Insulated windows; Split bedrooms
- Laundry & utility: Washer; Dryer
Neighborhood map
What this means for you Summary
Snapshot
- This is a 2-bed/2.0-bath single-family listed at $370k.
Deal economics
- At list price, monthly cash flow is $-965 ($-12k/yr) — negative.
- To cash-flow at today's rent, offer at most $200k (46.1% below list).
- To meet the 1% rule (rent ≥ 1% of price), the offer needs to be $246k (33.5% below list).
- Recommended offer: $200k (46.1% below list) — sets the bar for cash-flow.
Location & tenants
- Location reads 66/100 on livability (#605 in FL) — a middle-class / working-renter tenant base. Strengths: housing A+, cost of living A-, crime B+; Watch: amenities F, commute F, health & safety F.
- Nassau (town): math 74% / reading 65% proficiency, ranked #4 of 73 in FL (top 6%) — acceptable for families but not a draw, mixed tenant base, ~2y average lease.
- Market conditions: Rents rising (+2.9%/yr); 596 active listings in the ZIP; 7 comparable units currently listed for rent nearby; rentals leasing fast (median 12d on market — plan ~1-2 weeks tenant-placement turnaround); solid renter incomes; 953 units permitted in Nassau County in 2024 (24 in 5+ unit buildings).
- This rent runs 32% of the median local income ($93k/yr) — at the standard rent-burdened threshold; future hikes will face affordability resistance.
Forward outlook
- In year one you build about $40k of equity ($3k loan paydown + $37k appreciation (10.0% local appreciation)).
- Nassau County population projected at +17% by 2050 — long-run rental-demand tailwind backs the buy-and-hold thesis.
- By year 2, paydown + projected appreciation supports a ~$64k cash-out refi (75% LTV) — recoverable capital for the next deal without selling this one.
Negotiation context
- It's been on market 84 days — a 6% lower offer ($348k) is reasonable based on typical stale-listing flexibility.
- 15 sale attempts since 4y ago; this cycle's ask has dropped $40k (10%) from the opening price — seller is motivated, your offer sets the floor, not the list.
Risks & watch-outs
- Climate carrying-cost: severe wind risk, 99% chance of damaging wind over 30y; moderate wildfire risk; extreme-heat days projected 7→19/yr by 2055 (HVAC capex compounding) — expect insurance premiums to compound above CPI over the hold.
Questions for the listing agent
- What do current leases actually rent for vs. the listed asking? Can we see a recent rent roll and the last 12 months of T-12 income?
- It's been on market 84 days. Have you received any prior offers? Is the seller open to a 46% concession, seller financing, or rate buy-down credit?
- What does the HOA fee cover, when was the last increase, and are there any pending special assessments or reserve-fund shortfalls?
- Why hasn't it sold? Are there any deal-killer items the seller is aware of (foundation, flood, title, zoning, code violations)?
- Is there a deadline driving the sale (1031 exchange, divorce, estate, relocation)? That informs how much negotiation room exists.
- Schools are B-rated — typically a magnet for longer-tenancy family renters. What's the average tenant stay here, and is there a school-zone premium baked into asking?
- The area grade is low — what's the realistic commute time and amenity access for the typical tenant pool here? Any planned neighborhood developments (good or bad) we should know about?
- What's the average days-on-market for RENTAL listings here right now (not sales)? A rising rental-DOM trend means longer vacancies and softer asking-rent achievability than the comps imply.
- What's the recent tenant-quality profile in this submarket — average credit score on applications, eviction rate, late-payment / NSF rate, and stable-employment percentage? A property-management company in the area should have these aggregated.
- How much new for-sale + rental construction is in the pipeline within 1–3 miles? Heavy new supply typically softens prices + rents 12–24 months out; constrained supply supports both.
Investment metrics
- 1% rule
- 0.67% ✗
- Cap rate
- 3.16%
- Cash-on-cash
- -11.18%
- DSCR
- 0.50
- GRM
- 12.5
CMA / ARV
- ARV (on-the-fly)
- $343,740
- Comps found
- 12
Show comp detail 12 sales within ~0.75 mi
| Address | Dist | Beds/Ba | Sqft | Sold | Price | $/sf | Match |
|---|---|---|---|---|---|---|---|
| 688 Continuum Loop | 0.18mi | 2/2.0 | 1,348 (0%) | 1mo | $425,000 | $315 | 91 |
| 444 Tranquil Trail Cir | 0.26mi | 2/2.0 | 1,343 (-0%) | 4mo | $442,040 | $329 | 84 |
| 401 Tranquil Trail Cir | 0.33mi | 2/2.0 | 1,343 (-0%) | 1mo | $379,410 | $283 | 84 |
| 350 Tranquil Trail Cir | 0.29mi | 2/2.0 | 1,343 (-0%) | 8mo | $431,910 | $322 | 80 |
| 479 Jubilee Cir | 0.10mi | 2/2.0 | 1,542 (+14%) | 1mo | $371,000 | $241 | 71 |
| 173 Eureka Ct | 0.03mi | 2/2.0 | 1,542 (+14%) | 7mo | $368,000 | $239 | 68 |
| 564 Jubilee Cir | 0.06mi | 3/2.0 (+1) | 1,542 (+14%) | 0mo | $320,000 | $208 | 68 |
| 531 Goodwill Ct | 0.27mi | 2/2.0 | 1,490 (+10%) | 5mo | $379,445 | $255 | 66 |
| 777 Del Webb Pkwy | 0.54mi | 3/2.0 (+1) | 1,405 (+4%) | 4mo | $472,040 | $336 | 60 |
| 636 Del Webb Pkwy | 0.38mi | 2/2.0 | 1,529 (+13%) | 2mo | $364,090 | $238 | 58 |
| 301 Ecliptic Loop | 0.38mi | 2/2.0 | 1,529 (+13%) | 6mo | $365,000 | $239 | 55 |
| 277 Ecliptic Lp | 0.40mi | 2/2.0 | 1,529 (+13%) | 8mo | $370,990 | $243 | 53 |
Match score weights: distance 35% · size 25% · config 20% · recency 20%. Top-matched comps best support the ARV.
Projected returns pro-forma
10.0% appreciation · 2.88% rent growth · sell at horizon
- IRR
- 16.4%
- Equity multiple
- 2.35×
- Total profit
- $140,002
- Equity at exit
- $333,325
- IRR
- 15.7%
- Equity multiple
- 5.45×
- Total profit
- $460,527
- Equity at exit
- $718,829
Cash invested: $103,600 (down + closing). Projections, not guarantees.
Landlord ↔ Tenant lean methodology
- Overall (STATE)
- 87 Strongly Landlord-Friendly
- State Florida
- 87 Strongly Landlord-Friendly · R+3
- County
- — inherits STATE
- City
- — inherits STATE
ZIP-level market 32097
- Home prices YoY
- 19.5%
- Rents YoY
- 2.9%
- Active inventory
- 596
- Price-to-rent
- 12.5×
Monthly cashflow live
- Estimated rent
- $2,462 high interval (Pro) →
- Mortgage (P&I)
- −$1,940
- Tax from tax record
- −$423 /mo · $5,074/yr
- Insurance
- −$154
- HOA
- −$393
- Vacancy / Maint / Mgmt
- −$517
- Net cashflow
- $-965
Break-even live
UW: 25.0% down · 7.5% · 30yr · 1.5% tax · 5.0% vac · 8.0% maint · 8.0% mgmt
Financing live
Cash to close
- Down payment
- $92,500
- Closing costs
- $11,100
- Reserves months
- —
- Total cash needed
- —
Loan-product check · same deal, 3 products live
Conventional
25% down · 7.5% · 30yr
- Down + closing
- —
- Monthly P&I
- —
- Monthly cashflow
- —
- DSCR
- —
- Eligible?
- —
Personal DTI + credit; lowest rate.
DSCR
20% down · 8.5% · 30yr
- Down + closing
- —
- Monthly P&I
- —
- Monthly cashflow
- —
- DSCR
- —
- Eligible?
- —
No personal income docs; deal must DSCR.
Hard money
10% down · 12.0% · 12mo
- Down + closing
- —
- Monthly P&I
- —
- Monthly cashflow
- —
- DSCR
- —
- Eligible?
- —
Short-term bridge; refi at stabilization.
Rent comps 7 comps
| Address | Beds | Baths | Sqft | Rent | $/sqft | DOM | Units | Dist |
|---|---|---|---|---|---|---|---|---|
| 722 Cool Breeze Way Yulee, FL | 2.0 | 2.0 | 1541 | $3,100 | $2.01 | 21d | 1 | 0.32mi |
| 719 Cool Breeze Way Yulee, FL | 3.0 | 2.0 | 1575 | $2,995 | $1.90 | 11d | 1 | 0.33mi |
| 305 Whitby Dr Yulee, FL | 1.0–3.0 | 1.0–2.5 | 1279 | $2,292 | $1.79 | 1d | 45 | 1.01mi |
| 125 Daydream Ave Yulee, FL | 1.0–2.0 | 1.0–2.0 | 897 | $2,049 | $2.28 | 1d | 11 | 1.02mi |
| 77040 Deer Ln Unit 16 Yulee, FL | 3.0 | 1.5 | 924 | $1,500 | $1.62 | 23d | 1 | 1.13mi |
| 78030 Susi Ln Yulee, FL | 3.0 | 1.0 | 924 | $1,500 | $1.62 | 23d | 1 | 1.13mi |
| 549 Wildlight Ave Yulee, FL | 1.0–3.0 | 1.0–2.0 | 988 | $1,897 | $1.92 | 1d | 32 | 1.23mi |
HOA detail
- Monthly dues
- $393 · $4,716/yr
- Likely covers
- pool
Listing history 50 events
-
2026-06-18days on market $370,000 Active 84 DOM
-
2026-06-17days on market $370,000 Active 83 DOM
-
2026-06-16days on market $370,000 Active 82 DOM
-
2026-06-15days on market $370,000 Active 81 DOM
-
2026-06-13days on market $370,000 Active 79 DOM
-
2026-06-13days on market $370,000 Active 78 DOM
-
2026-06-09days on market $370,000 Active 75 DOM
-
2026-06-08days on market $370,000 Active 74 DOM
-
2026-06-07days on market $370,000 Active 73 DOM
-
2026-06-05days on market $370,000 Active 70 DOM
-
2026-06-03days on market $370,000 Active 69 DOM
-
2026-06-02days on market $370,000 Active 68 DOM
-
2026-06-01days on market $370,000 Active 67 DOM
-
2026-05-31days on market $370,000 Active 66 DOM
-
2026-04-29price $370,000
-
2026-04-29price $370,000
-
2026-04-21price $399,000
-
2026-04-21price $399,000
-
2026-03-25$410,000 Active
-
2026-03-25$410,000 Active
-
2025-12-25historical
-
2025-10-16$370,000 Active
-
2025-10-16$370,000 Active
-
2025-09-28historical
-
2025-08-20price $370,000
-
2025-08-20price $370,000
-
2025-08-19price $383,000
-
2025-08-03price $383,000
-
2025-06-07$389,000 Active
-
2025-06-07$389,000 Active
-
2025-05-25historical
-
2025-05-14$405,000 Active
-
2025-05-14$405,000 Active
-
2025-02-28historical
-
2025-01-09$415,000 Active
-
2025-01-09$415,000 Active
-
2024-12-04historical
-
2024-08-27price $429,000
-
2024-08-27price $429,000
-
2024-08-15$429,900 Active
-
2024-08-15$429,900 Active
-
2024-08-09price $423,900
-
2024-08-09historical
-
2024-06-17price $419,900
-
2024-06-04price $439,900
-
2024-05-16$444,900 Active
-
2023-08-11soldstatus $398,244 Sold
-
2023-08-11soldstatus $398,300 Closed
-
2023-04-28status Pending
-
2023-04-21status Pending
ⓘ Source: listings_history table (triggers on properties + properties_extension) + one-shot
backfill from property_details.listing_events for pre-trigger history.
Tax reassessment forecast FL · Resets to sale price
- Current annual tax
- $5,074 · $423/mo
- Projected year-2 tax
- $5,074 · $423/mo
- Expected delta
- $0/yr ($0/mo · 0.0%)
ⓘ Screening estimate from a state-policy table — verify with the county assessor before closing.
Climate risk First Street
- Flood 1/10 Low FEMA zone X (unshaded) · 0% chance over 30 yrs
- Wildfire 5/10 Major
- Heat 9/10 Extreme 7 d/yr ≥106°F today · 19 d/yr by 30 yrs out
- Wind 9/10 Extreme 99% chance of damaging wind over 30 yrs
- Air quality 5/10 Major 6 unhealthy d/yr today · 7 by 30 yrs out
Nearby sold comps map
Loading sold comps map…
Walkable amenities ~0.75 mi
Loading nearby amenities…
Taxation est. · year 1
- Rental income
- $29,548
- − Mortgage interest
- −$20,726
- − Property taxes
- −$5,074
- − Insurance
- −$1,850
- − Repairs & maintenance
- −$2,364
- − Management
- −$2,364
- − HOA
- −$4,716
- − Depreciation
- −$10,764
- Taxable loss
- −$18,309
- Est. tax savings @ 24.0%
- +$4,394
- After-tax cash flow
- $-7,187/yr
For passive investors: Depreciation is non-cash, so a rental often shows a tax loss while cash-flowing — sheltering income. Rental losses are passive: they offset passive income freely, and up to $25,000/yr can offset ordinary (W-2) income if you actively participate and your MAGI is under $100k (phasing out to $0 by $150k); unused losses carry forward. On sale, claimed depreciation is recaptured at up to 25%, and gains may owe capital-gains tax (a 1031 exchange can defer both). Figures are a year-1 estimate at your 24.0% rate — not tax advice; consult a CPA.
Schools (NCES district)
- District
- Nassau
- NCES district ID
- 1201350
- Math proficiency
- 74% ▼ -2.00%
- Reading proficiency
- 65% ▼ -2.00%
- Median HH income
- $58,267
- Composite
- 59.79/100
- National rank
- #899
- State rank
- #4 of 73 in FL
Livability — Yulee
- Score
- 66/100
- State rank
- #605
- US rank
- #11615
Category grades
Schools grade is shown separately in the Schools card above.
Census & demographics
- County
- Nassau County · 67,729 people
- City population
- 26,700
- Metro
- Jacksonville, FL
- Population (ZIP)
- 26,700
- Household income
- $93,161
- Rent vs Own
- Severe rent burden
- 404.0
Population outlook (Nassau County) Hauer SSP2
- Today (2025)
- 88,419 people
- By 2030
- 92,679 · +4.8%
- By 2040
- 99,257 · +12.3%
- By 2050
- 103,378 · +16.9%
- By 2075
- 109,726 · +24.1%
- By 2100
- 107,006 · +21.0%
Race, ethnicity, and origin ACS 2023
- Neighborhood character
- Predominantly White (75%)
- Race & ethnicity
- White 75% Two or more races 9% Black 9% Hispanic / Latino 8% Asian 1% Native American 1%
- Hispanic origin (detail)
- Mexican 2% Puerto Rican 2%
- Common ancestry
- Lithuanian 4% Italian 3% Romanian 2%
- Foreign-born
- 4% · Canada, Vietnam
- Languages at home
- 93% English-only · Spanish 5% Vietnamese 1%
Political lean MEDSL · Nassau
- 2024 margin
- Solid R (+46.9) · D 26.1% · R 73.1%
- 2008→2024 swing
- -3.1pp toward R · 2008: -43.8pp · 2024: -46.9pp
- All cycles
- 2024: R+46.9 2020: R+45.9 2016: R+50.2 2012: R+48.6 2008: R+43.8
Not yet ingested
- Civics
- —
Market trends
- HPI YoY
- ▲ 49.35%
- Current HPI
- 301.9299
- Rent YoY
- ▲ 2.88%
- Metro
- Jacksonville, FL
- State GDP YoY
- ▲ 3.28%
- F500 in state
- 36
Industry mix (Fortune 500 HQ in FL)
| Industry | F500 HQs | Revenue |
|---|---|---|
| Industrial Technology | 2 | $29B |
|
||
| Insurance | 2 | $17B |
|
||
| Retail | 1 | $60B |
|
||
| Technology Distribution | 1 | $58B |
|
||
| Homebuilding | 1 | $35B |
|
||
| Technology Manufacturing | 1 | $35B |
|
||
Price history
-14.5% since first listed64 events — show timeline
- 2026-04-29 Price Changed $370,000 realMLS
- 2026-04-29 Price Changed $370,000 AINCAR
- 2026-04-21 Price Changed $399,000 AINCAR
- 2026-04-21 Price Changed $399,000 realMLS
- 2026-03-25 Listed $410,000 AINCAR
- 2026-03-25 Listed $410,000 realMLS
- 2025-12-25 Listing Removed — realMLS
- 2025-10-16 Listed $370,000 AINCAR
- 2025-10-16 Listed $370,000 realMLS
- 2025-09-28 Listing Removed — realMLS
- 2025-08-20 Price Changed $370,000 realMLS
- 2025-08-20 Price Changed $370,000 AINCAR
- 2025-08-19 Price Changed $383,000 realMLS
- 2025-08-03 Price Changed $383,000 AINCAR
- 2025-06-07 Listed $389,000 realMLS
- 2025-06-07 Listed $389,000 AINCAR
- 2025-05-25 Listing Removed — realMLS
- 2025-05-14 Listed $405,000 realMLS
- 2025-05-14 Listed $405,000 AINCAR
- 2025-02-28 Listing Removed — realMLS
- 2025-01-09 Listed $415,000 AINCAR
- 2025-01-09 Listed $415,000 realMLS
- 2024-12-04 Listing Removed — realMLS
- 2024-08-27 Price Changed $429,000 realMLS
- 2024-08-27 Price Changed $429,000 AINCAR
- 2024-08-15 Listed $429,900 realMLS
- 2024-08-15 Listed $429,900 AINCAR
- 2024-08-09 Price Changed $423,900 realMLS
- 2024-08-09 Listing Removed — realMLS
- 2024-06-17 Price Changed $419,900 realMLS
- 2024-06-04 Price Changed $439,900 realMLS
- 2024-05-16 Listed $444,900 realMLS
- 2023-08-11 Sold (MLS) $398,300 AINCAR
- 2023-08-11 Sold (MLS) $398,244 realMLS
- 2023-04-28 Pending — AINCAR
- 2023-04-21 Pending — realMLS
- 2023-04-14 Price Changed $411,920 AINCAR
- 2023-03-10 Price Changed $412,420 AINCAR
- 2023-03-10 Price Changed $412,420 realMLS
- 2023-03-03 Price Changed $417,420 realMLS
- 2023-03-03 Price Changed $417,420 AINCAR
- 2023-02-24 Price Changed $424,420 AINCAR
- 2023-02-23 Price Changed $424,420 realMLS
- 2023-02-18 Price Changed $417,860 AINCAR
- 2023-02-09 Price Changed $417,860 realMLS
- 2023-01-13 Price Changed $418,360 AINCAR
- 2023-01-12 Price Changed $418,360 realMLS
- 2022-12-22 Price Changed $420,360 AINCAR
- 2022-12-22 Price Changed $420,360 realMLS
- 2022-12-09 Price Changed $420,860 AINCAR
- 2022-12-09 Price Changed $420,860 realMLS
- 2022-12-02 Price Changed $425,860 realMLS
- 2022-12-02 Price Changed $425,860 AINCAR
- 2022-11-28 Price Changed $420,860 AINCAR
- 2022-11-23 Price Changed $420,860 realMLS
- 2022-11-17 Price Changed $425,860 AINCAR
- 2022-11-10 Price Changed $425,860 realMLS
- 2022-10-27 Price Changed $429,760 AINCAR
- 2022-10-14 Price Changed $429,760 realMLS
- 2022-10-07 Price Changed $434,760 AINCAR
- 2022-10-07 Price Changed $434,760 realMLS
- 2022-09-15 Price Changed $433,560 realMLS
- 2022-08-31 Listed $433,560 AINCAR
- 2022-08-02 Listed $432,560 realMLS
Property tax history
+53.5%/yrLatest (2025): $5,074 · +2.1% YoY. Source: county tax records.
Cash-flow waterfall
monthlySold comps — $/sqft
last 12 mo · ≤1 miLoading sold comps…